INCREASING THE THROUGHPUT
FOR INSULATING AND DEGASSING
MEDIUM VOLTAGE CABLES
Bachelor thesis
ii Author Tom Boerrigter
s1624024
Educational Program
Industrial Engineering and Management Faculty Behavioural, Management and Social Sciences
University of Twente
Supervisors
Dr. Ir. P. Hoffmann (First supervisor University of Twente) Dr. Ir. E.A. Lalla-Ruiz (Second supervisor University of Twente)
H.J. Horstink (Supervisor Twentsche Kabelfabriek) T. Bijen (Supervisor Twentsche Kabelfabriek)
University of Twente Twentsche Kabelfabriek BV
Drienerlolaan 5 Spinnerstraat 15
7522 NB, Enschede 7481 KJ Haaksbergen
iii
Foreword
This is my thesis on ‘increasing the throughput for insulating and degassing medium voltage cables’.
The subject for this research was Twentsche Kabelfabriek BV in Haaksbergen, who also gave me the time and space to conduct it on-site. The research is done to put my knowledge into practice and to conclude my bachelor study, Industrial Engineering and Management, at the University of Twente. The reason for TKF for having this research was to get a fresh look at their production processes and to find a way to increase the throughput. I started in late January and finished in July, after which I had some more time to finalize this report and discuss its results until September.
Supervision from TKF came from Henk Jan Horstink and Tom Bijen, supply chain manager and capacity planner at the Energie department, respectively. I would like to thank them for their guidance this whole research, which was something I wished for at the beginning. It really helped me to get a grip on what I was doing, i.e. what next steps to take or what direction to head for. Together they carried the feeling that they supported this research, which was a great motivator. To have their supervision and assurance that this research would succeed, I am very grateful.
I also want to thank my supervisors from the University of Twente. Petra Hoffmann guided me during the set-up and the research itself, and knew how to motivate me and be critical to my own work. Later on, Eduardo Lalla-Ruiz was there to guide me in the technical parts and was more of a helping hand than a standard second supervisor normally is.
Tom Boerrigter,
iv
Summary
In this research we find an answer to the question how to increase the throughput at insulating and degassing medium voltage cables. The setting of this research is Twentsche Kabelfabriek (TKF) location Haaksbergen, department ‘Energie’. In an assessment of the ongoing problems in their production line, we encounter the core problem that states that short-term decisions do not take the whole production line into account. Because the whole production line is quite complex, we narrow our scope to the insulating and degassing stages.
We describe the production line within our scope with relevance to our KPIs. These KPIs are throughput, lateness in delivery and standstill of degassing rooms. For measuring these KPIs, we want to have a framework accompanied by a solving method. Of course, there are multiple frameworks and solving methods, and we have to choose the one that fits our situation best. This is done by a review of regularly used frameworks. When comparing, we found that creating a custom algorithm to our situation suits best, and a heuristic must be applied to solve it. For this, we chose steepest hill climbing. Both the custom algorithm and the heuristic are written in Visual Basic for
Applications, because of TKF’s familiarity with Excel and VBA.
We have created an Excel tool that retrieves data from the database of TKF and creates a production schedule. Based on the intentions of the user, both the conceptual schedule and the schedule created by steepest hill climbing can be obtained independently of each other. The tool has to purpose to be easy to use and has several options to specify the situation. This tool is also the basis on which we have retrieved our results and conducted our experiments.
For the results, we have created three different situations. First, we used the standard situation, after which we conducted two experiments with the following conditions: 1. No standstill of degassing rooms allowed, 2. First two orders are locked. The data for these situations were retrieved at 8 different points in time.
Throughput can be improved significantly by applying the steepest hill climbing heuristic. On average a positive change up to 21,8% was retrieved in the standard situation. Experiments resulted in a lower throughput, but all showed improvement. The lateness in delivery showed us that initially sometimes half of the product are expected to be delivered too late. Steepest hill climbing and the experiments did not really change these numbers. Standstill of degassing rooms were highest when applying steepest hill climbing, which gives the impression that a higher use of the degassing rooms does not always result in a higher throughput.
v
Definitions and abbreviations
CDCC Completely Dry Cured and Cooled Curing
Degassing A process that is used for the vulcanization (form a net) of thick cables with XLPE insulation.
Insulating The application of three layers of insulating material around an aluminum or copper core by the CDCC line
KPI Key Performance Indicator
LP Linear Programming
Production line A sequence of machines that each contribute an operation for creating the final product
Query Order to the database to perform a certain action and possibly return
information
TKF Twentsche Kabelfabriek
TKH Twentsche Kabel Holding
vi
Table of contents
Foreword ...iii
Definitions and abbreviations ... v
List of figures ... viii
List of tables ... ix
Introduction ... 1
Twentsche Kabelfabriek BV ... 1
‘Energie’ department ... 1
Reason for research ... 2
Overview of problems at TKF ... 2
Problem cluster ... 7
Core problem ... 7
Setting the scope ... 8
Research questions ... 10
Research design ... 11
Key aspects of the production line ... 12
Production planning ... 12
Insulating ... 13
Degassing... 14
Remaining production steps ... 15
Theoretical framework ... 17
Linear programming ... 17
Custom algorithm ... 18
Markov decision process ... 19
Petri net ... 20
Concept matrix ... 20
Implementation of theory ... 24
Purpose and layout of deliverable ... 24
Information from database ... 26
Conceptual model ... 26
Steepest hill climbing ... 30
Results and experimentations ... 31
Conceptual model ... 31
vii
Experiment: No standstill degassing rooms ... 40
Experiment: First two orders locked ... 44
Summary ... 47
Guideline to maintaining results ... 50
Excel file ... 50
Results ... 51
Conclusions and recommendations ... 52
Conclusions ... 52
Recommendations ... 53
Further research ... 53
Bibliography ... 54
Appendix A: Overview of lost hours week 5, 2019 ... 55
Appendix B: Layout conceptual model ... 56
Appendix C: Exsion queries ... 58
Appendix D: Flowcharts conceptual model ... 59
Appendix E: Flowcharts steepest hill climbing ... 67
Appendix F: Comparison total run times ... 69
viii
List of figures
Figure 1: Overview of the production line ... 1
Figure 2: Problem cluster ... 7
Figure 3: Overview stages of scope ... 9
Figure 4: Example of a constructed schedule using parallel machine scheduling. Source: (Gacias, Artigues, & Lopez, 2010) ... 18
Figure 5: Example of a Markov chain ... 19
Figure 6: Example of a graphical notation of a system using Petri net ... 20
Figure 7: Iterating through neighbourhood from starting position ... 23
Figure 8: Iterating through neighbourhood from new starting position ... 23
Figure 9: Throughput averages of the normal situation and experiment situations ... 48
Figure 10: Standstill averages of the normal situation and experiment situations ... 48
Figure 11: Comparison throughput averages and standstill averages ... 49
Figure 12: First 25 rows of conceptual model, CDCC sheet ... 56
Figure 13: First 25 rows of conceptual model, degassing sheet ... 56
Figure 14: First 25 rows of conceptual model, schedule sheet part 2 ... 57
Figure 15: First 25 rows of conceptual model, schedule sheet part 1 ... 57
Figure 16: Exsion query for CDCC results ... 58
Figure 17: Exsion query for degassing results ... 58
Figure 18: Flowcharts Sub "Convert To Number", "Clear Results", "All Products" and "Assign Arrays" ... 59
Figure 19: Flowchart Sub "Calculation" ... 60
Figure 20: Flowchart Sub "Production and Setting Time"... 61
Figure 21: Left side of flowchart Sub "Two Empty" ... 62
Figure 22: Right side of flowchart Sub "Two Empty" ... 62
Figure 23: Flowchart Sub "Second Empty"... 63
Figure 24: Flowchart Sub "First Empty" ... 64
Figure 25: Flowchart Sub "Two Full" ... 65
Figure 26: Flowchart Sub "Degassing Time" ... 65
Figure 27: Flowchart Sub "Nr. Of Products To Degas" ... 66
Figure 28: Flowchart Sub "Priorities" ... 67
ix
List of tables
Table 1: Total of realized and lost man-hours. (Database TKF, January - February 2019) ... 3
Table 2: Degassing times per voltage class. (TKF, 2019) ... 5
Table 3: Expression summary production planning ... 12
Table 4: Expression summary insulating ... 14
Table 5: Expression summary degassing ... 15
Table 6: Maximum speed of every production step ... 16
Table 7: Concept matrix for scoring frameworks ... 21
Table 8: Arrays of product information variables ... 28
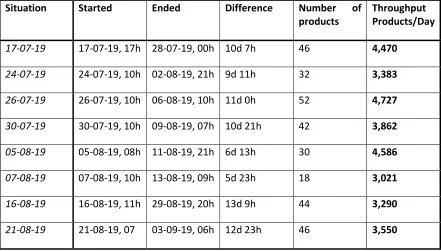
Table 9: Throughput of conceptual model ... 32
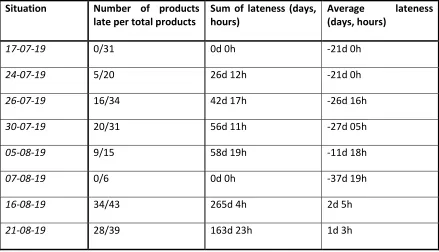
Table 10: Lateness in delivery conceptual model ... 33
Table 11: Standstill of degassing rooms conceptual model ... 34
Table 12: Throughput of steepest hill climbing ... 35
Table 13: Comparison throughput of conceptual model and steepest hill climbing ... 35
Table 14: Lateness in delivery steepest hill climbing ... 37
Table 15: Comparison of lateness between conceptual and steepest hill climbing ... 38
Table 16: Standstill of degassing rooms steepest hill climbing ... 39
Table 17: Comparison standstill of degassing rooms conceptual and steepest hill climbing ... 39
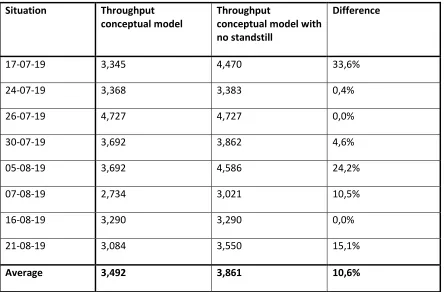
Table 18: Throughput of conceptual model with no standstill ... 40
Table 19: Comparison throughput conceptual model and conceptual model with no standstill .... 41
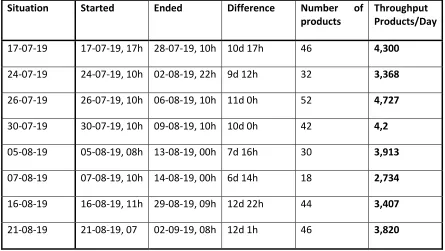
Table 20: Throughput of steepest hill climbing with no standstill ... 42
Table 21: Comparison throughput steepest hill climbing and no standstill ... 42
Table 22: Comparison lateness in delivery, steepest hill climbing and no standstill ... 43
Table 23: Throughput of steepest hill climbing with first two orders locked ... 44
Table 24: Comparison throughput steepest hill climbing and first two orders locked ... 45
Table 25: Comparison lateness in delivery, steepest hill climbing and first two locked... 46
Table 26: Standstill of degassing rooms first two orders locked steepest hill climbing ... 46
Table 27: Comparison standstill of degassing rooms, steepest hill climbing and first two orders locked ... 47
1
1
Introduction
This chapter serves as an introduction to the research and its foundations. Section 1.1 and 1.2 give a description of the company and department respectively, where the research was conducted. From section 1.3 to 1.6, we discuss the ongoing problems and provide reasoning for the tackling of our chosen core problem. After choosing our core problem we set a scope for the research (1.7) to which we adapt our research questions and our research design in sections 1.8 and 1.9.
1.1
Twentsche Kabelfabriek BV
Twentsche Kabelfabriek is a producer of electricity and fiberglass cables. It is founded in Haaksbergen in 1930 and has stayed there ever since. In 1980 it became part of the Twentsche Kabel Holding Group which is listed at the Euronext exchange in Amsterdam and became part of the AMX Index. The core business of TKF is creating safe and reliable energy- and data connections with a broad portfolio on cables, systems and services. Their markets can be divided into three segments: Building Solutions (Construction, Rail infra, Sustainable energy, etc.), Industrial Solutions (Heavy industry, Marine & Offshore, Oil gas & Petrochemistry) and Telecom Solutions (Telecom). Besides the factory in Haaksbergen, there is a separate factory in Lochem which produces for Haaksbergen. At this time the location in Haaksbergen has over 480 employees and an office and factory space of 165.000 m2. The location in Lochem is a lot smaller and has only a few dozen employees.
1.2
‘Energie’ department
The ‘Energie’ department is the oldest and the
most complex department at TKF. Its complexity is due to the number of steps the whole process takes. Also, the machines and materials are large and take time to adjust and clean. In Figure 1 an overview of the stages medium voltage cables need to pass in production is given. We will now discuss this overview for a basic understanding of the subjects that are used throughout the whole research.
The ‘CDCC Lochem’ and ‘CDCC Haaksbergen’ are
[image:10.612.320.525.374.696.2]machines that are located in Lochem and Haaksbergen respectively. These machines cover the core conductor, mostly aluminum or copper, with three insulation layers. When materials produced in Lochem are finished, they need transportation to Haaksbergen. After insulating, the cables enter the degassing process. This process gives the gasses that are released during the heating and
2
cooling of insulation material a chance to escape. If cables are sufficiently degassed they enter the screening line. At the screening line, cables get wrapped with copper wires and tape to ground them. If the end product must be a single-core cable, it can be moved to the jacketing line. Should the cable be a triple-core cable, it first has to pass the drumtwister. This machine places semi-finished products made out of rubber between the cables to fill up the gaps, and then wraps around copper and tape like the screening line. All cables pass the jacketing line for a plastic layer with an injected brand for recognition. The cable has reached its end product state and only needs a final inspection before it can be shipped to the customer.
1.3
Reason for research
A production line such as described can have a lot of differences in throughput times between machines. Different throughput times means there is always a bottleneck present. This bottleneck can of course shift to another machine if speed and occupation are being changed. Balancing out this series of throughput times is not an easy task, and can easily be distorted by a lot of factors whose description can be found at section 1.4. If a distortion at a single machine is not intercepted well, it can influence performances in the whole chain.
At TKF productivity of production is monitored each day, in order to be able to quickly intervene and make modifications to the production planning if necessary. Productivity is expressed as man efficiency and has a calculated target of 85% each day for the whole year. This target (norm) indicates that of all the hours of labour, 85% has to be used at a machine that is in production. Reality turns out that this target is most of the times not met and that productivity heavily fluctuates per day. Together with the management, we conclude that machines and personnel are not used up to standard. To find out possible causes for this action problem, all problems relevant to this case are discussed in the next section.
1.4
Overview of problems at TKF
It is essential for solving an action problem to map all the underlying problems. To get a first good look at the ongoing problems, interviews with various employees with a managerial function were held. Persons were chosen with relevance to planning, production and factory personnel. The interviews addressed the problems within the department concerning the production line and views on the functioning of other personnel in that department. It would be unwise to assume that all relevant problems lie within these two subjects, so we addressed overlapping subjects to catch possible hidden problems by not necessarily sticking to the primal conversation topic.
Number of man-hours cannot be met
3
Data is recorded at the main database for each machine in the production line. Processing time and setting time are part of these recordings. It is the case on almost a daily basis that the recorded machine-hours do not match the planned hours for production. The difference is a loss of man-hours, which is unwanted. Table 1 gives an insight into the loss of man-hours on recent ‘normal weeks’. Appendix A: Overview of lost hours week 5, 2019 gives an insight into how the hours lost are monitored on a daily basis.
Week 2, 2019 Week 3, 2019 Week 5, 2019 Week 6, 2019
Total man-hours realized 2139 2258 2196 2014
Total man-hours lost 361 389 448 378
Percentage lost/realized x 100%
16,88% 17,23% 20,40% 18,77%
Table 1: Total of realized and lost man-hours. (Database TKF, January - February 2019)
Over these 4 weeks in Table 1, 18,31% of the realized hours are lost on average. This means that the same percentage is wasted financially to wages, and it means a delay for the production planning. A delay in the production planning leads to less flexibility in choosing what to produce, which can cause the management to take production decisions that differ from their planning and cause a more negative outcome.
There are multiple reasons for the lost man-hours and they are all addressed in the subsections below.
Lack of motivation operating personnel
Motivation is hard to express, but it is not hard to get a general feeling of the working atmosphere and the corresponding motivation of the operating personnel. From conversations with the team manager and Value Stream Manager, we can say that production work at TKF can be monotonous and not challenging. It can occur that certain personnel does not pick up new tasks without any good reason. It means that they are literally doing their time. This is noticed by their team leader who monitors their performance and attitude. The lack of motivation affects the effectiveness of the personnel negatively, and subsequently production.
Lack of communication about tasks
To continue on the previous problem of the lack of motivation, picking up tasks can go wrong from two sides. Motivation on the one hand, not having control over personnel on the other hand. If a team leader forgets to communicate about future tasks or does not notice someone that is waiting for a new task, time can go to waste. This problem was noticed by the Value Stream Manager. We will not quantify this problem, because of its small impact on the action problem based on the low occurrence frequency. Besides the relevance, it is not the topic of this research to monitor and
4
Production can stagnate
The stagnation of production means that reality deviates from the planning. This results in the problems that are mentioned in subsections 1.4.1.
The stagnation of production is a collective term for a couple of problems that are present at TKF. Because all machines are in a chain, problems at one machine can work on multiple machines or even get enlarged. The problems that fall under the stagnation of production are listed in subsections 1.4.5 to 1.4.10.
Machines can stand still
Every operator on a machine has the task to keep up registration of his hours during their shift. Most of the time these hours are spent on production and conversion, but can also be spent on other tasks that are described as lost hours. During the lost hours, machines can lose its speed or stand still. TKF describes reasons for this as follows:
Code Description 1 Speed loss 2 Reel change
3 Malfunction machine
4 Production process disruption 5 Error handling
6 Incomplete order 7 Diverse
For code 4 and 7, an added explanation for why this has happened is required to give the team manager an insight. According to the team manager, handling of this registration form by the operators is not done neatly most of the times. Often the explanation is told during the morning monitoring, or is passed from mouth to mouth.
Unfortunately, results are not being recorded for longer than a week. There is no data about what codes for lost hours occur more often than others. To collect this data we would need more time than this research can cover.
The team leader of the factory personnel described that the reason ‘Diverse’ is most of the times a reel arriving too late. For a description of this problem see section ‘Delay by reels arriving too late’.
Degassing room can be full
All medium voltage cables that come out of the CDCC are emitting gas that arises from the heating process at the CDCC. This gas must evaporate before a new layer can be applied to the cables or else it affects the quality. When the temperature is higher, degassing will take shorter. If a reel comes of the CDCC it immediately begins to degas. Setting the reel aside at an empty space in the factory is a way to degas the cable. Another way to degas the cable is to store it in a degassing room. This room will heat up to 70 °C to speed up the process.
5 Voltage class
(kV)
Degassing time CDCC cores Insulation thickness (mm)
Tnom20
20 °C [h]
Tnom70
70 °C [h]
6/10 3,4 87 52
8,7/15 4,5 120 55
12/20 5,5 160 59
18/30 8 300 73
≥20/35 10 470 89
Table 2: Degassing times per voltage class. (TKF, 2019)
As can be seen from the table, degassing in a degassing room can be 87
52= 1,67 (3,4 mm insulation)
up to 470
89 = 5,28 (10 mm insulation) times shorter than in the factory. This can save a relevant
amount of time and gives more flexibility to the production process. On the other hand, the degassing room can be a bottleneck and slow a certain order down because of the lack of space, which causes the reels to degas outside the degassing room. This is the main problem that is experienced.
To sketch an example: On average, a cable has to be in the room for 52+55+59+73+89
5 = 2,73 days.
In reality, cables of higher voltage classes get priority because this saves the most time. For now we take an even distribution of voltage classes for convenience, because it saves a lot of calculations. This average already sketches the problem and will be amplified in reality because of priority to higher voltage classes. According to the log data from the first month of production in 2019, ranging from the 3rd of January till the 3rd of February, 194 reels of cables are produced. On average this is 6,26 per day. Multiplying this by the 2,73 results in 17 reels. To conclude: in 2,73 days 14 reels can be degassed, while 17 reels are produced. This applies for an even distribution of voltage classes, meaning that in reality degassing rooms are longer occupied than 2,73 days because of the aforementioned priority to higher voltage classes.
To finish the degassing process, cables that come out of the degassing room need to cool down. Cooling down can take half a day up to a whole day. It is mere guesswork when a full reel has cooled down enough, and depends on when the factory worker finds it sufficient.
Delay by reels arriving too late
At the ‘Energie’ department there is always one person working on a forklift truck. This person lifts
heavy reels to the place where they are needed. Most of the times he works on call and can experience a high workload from time to time. There are large carts on which factory personnel can move reels themselves, but these are taking up much space. This is why they do not get used all the time. To have an extra forklift truck is quite expensive, this is why TKF chooses to have only one.
6
Not enough semi-finished products on stock
Semi-finished products are needed to fill up the spaces between cores in a triple-core cable, and are made out of rubber. The decision point of making a single core or a triple-core cable can change between two points in the chain. The first point being at the CDCC, which means that the demand at the rubber production line is known a couple of days beforehand. The second point is located just after the screening line and gives the rubber production line no time to anticipate. Choices at this point are mostly made out of necessity and can have the result of having an empty stock. This means that rubber needs to be produced which can have its effects on the production schedule.
Machines cannot handle the demand
As a result of the congestions and gaps, a queue can grow at a machine. The speed of the machine depends on the thickness of the insulation, but is also fixed per thickness. In almost all cases, there is always a machine that produces the slowest. This machine is at that moment the bottleneck and must be kept going at all cost.
Short-term production decisions do not take the whole production line into
account
7
1.5
Problem cluster
The problems that are present at TKF are connected to each other. They can all be described as causes for the action problem. Figure 2 displays the action problem in bold at the right. The problems with an outgoing arrow are causes for the problems they are pointing to. From what we can see, there is a loop present that can cause a downward spiral.
Figure 2: Problem cluster
1.6
Core problem
As it can be seen in the problem cluster, there are multiple problems going on at TKF. It is clear that we want to get as many problems out of the way as possible. Therefore we need to look at the effectiveness of solving a particular problem. If we solve a problem, but not the cause, it is most likely that the problem is going to occur again after some time. It is clear that we need to tackle a problem that has no cause. (Heerkens & Van Winden, 2012) describes a set of rules to find this core problem, the four rules of thumb.
First of all, the problem needs to be present. If there is no evidence that it really is a problem, then it has no use to tackle it. We have covered the presence of the problems in section 1.5.
Second, we need to go back to the problems that have no causes themselves. In our problem cluster,
there are three problems that are possible core problems: ‘Machines can stand still’, ‘Short-term production decisions do not intercept congestion and gaps’ and ‘Lack of motivation and communication about tasks’.
8
Fourth and last, choose the most important problem which is the problem that has the most result. In this case, it is the problem ‘Short-term production decisions do not intercept congestion and
gaps’. It is connected to 7 other problems and has an effect on the loop. From now on, this is our core problem that is going to be tackled in this research.
1.7
Setting the scope
With the use of the problem cluster we have found our core problem and in doing so made boundaries that prevent us from deviating into the wrong direction. But, even with having to deal with one problem, researches can vary over the same problem when there is difference in the scope. We set our scope by taking into account our limitations and TKF’s demands for the research to be
of value for them.
Limitations
For the execution of this research, we have a directive of 10 weeks. This has its effects on, for example, the complexity of the theory, the number of factors that can be dealt with and what shape experiments can be molded in.
Evaluating the number of variables of the whole production line gives us a first insight into its complexity. According to the capacity planner and supply chain manager, there are over 100 products to consider. Each product has its own specifications like setup time or thickness, and production length varying per order. For all of the 10 machines that can be used to produce the cables, regulations are never the same. Operating times differ, product priorities can shift because of the situation and exceptions are not unfamiliar.
For our research we preferably want a single theory to be sufficient for finding solutions, because of the time it takes for finding, understanding, evaluating the theory and translating it to our
situation. At the ‘Energie’ department we have machines in series and in parallel, thus needing
different theoretical approaches. With the addition of the many variables, it can be predicted that most theories do not cover all factors which could lead to the necessity of combining different theories.
Scope
Due to the arguments in section 1.7.1 we need to narrow down our scope for it to fit in the stated 10 weeks. With the agreement of TKF that we cannot take all machines of the production line into account, we selected those that have the most room for improvement and can have a large effect on the problem. This is presented in Figure 3.
The CDCC and degassing rooms are the parts in the production line where most of the production order is determined. Because there are a lot of combinations of products in different orders, it is impracticable to calculate these by hand. This is also the reason why there is room for improvement because there has never been insight in the effects of decisions at this stage. For the subsequent stages in the production line, the production order is mostly locked and its effect is easier to predict manually.
9
Key performance indicators
We want to measure our core problem with the help of key performance indicators (KPIs). The KPIs are drafted variables to analyze the outcomes in the result phase of this research. They are a result
from TKF’s wishes and knowledge of the researcher on this topic.
The first KPI is throughput, meaning the rate at which items emerge from the process, i.e. the number of items passing through the process per unit of time (Slack, Brandon-Jones, & Johnston, 2013). A production line that is efficient with its time, can cause a high throughput rate. The more products produced in a time unit, the greater the financial benefit.
Lateness in delivery is our second KPI. With the customers of TKF, a delivery date for each end product is set before production. It can be seen as a deadline that in some cases cannot be met, due to several reasons like machine or production failure. This KPI let us see if the current production and our research results operate within the prefixed boundaries.
Standstill of degassing rooms is our third and last KPI. By standstill, we mean that a degassing room is not degassing any reels and is not cooling down nor warming up. It simply means that the degassing room has no temporary function, which can raise the question if both degassing rooms are still necessary or if it is not used to its full extent.
10
1.8
Research questions
We distinguish research question between one main question and multiple questions. The sub-questions serve as smaller steps to provide an answer for the main question, which is going to be answered at the end of this research.
Main question
In order to raise the efficiency of the use of machine and personnel in the production line, we want to establish a high and constant throughput by answering the following question:
“How can TKF gain a higher throughput of medium voltage cables at the insulating and degassing stages?
Sub-questions
1. What are the key aspects of the production line that are relevant to the KPIs?
We want to describe all of the properties of the production line that lie within our scope. This is necessary for getting to know the situation and correctly translating it for later optimization purposes.
2. What framework must be used to express the production line for optimization purposes? In order to translate our situation, we must have the tools for expressing it. We need to choose the framework that suits the most to our situation.
3. What method must be used for optimization calculations?
Besides a framework for expressing our situation, a method is needed to quantify the situation.
4. How to implement TKF’s situation into the framework and method?
Because there are lots of ways to translate the same situation, a wrong turn can easily be made. We want to create a translation that is organized, user-friendly and is low in computing time.
5. What are the effects of different production approaches?
When having the tools to calculate the current but also a custom situation, we can observe the effects of specific conditions being changed and if that might be beneficial.
6. How to implement and maintain the production approaches and their outcomes?
11
1.9
Research design
This research is built up in 7 chapters, each with its own purposes to answer a sub-question.
Chapter 1 is about problem identification and has this research design as its result.
Chapter 2 serves as a context analysis, which serves to provide answer for research question 1. Information for this comes from TKF and every detail that is analyzed can be a building brick for a more correct conclusion at the end of this research.
Chapter 3 contains a review of different frameworks and methods, that all have its own properties for expressing and calculating similar situations. When reviewing, we choose the ones that are closest to our objective and need little modifications. Logically, in this chapter we provide answer for sub-questions 2 and 3.
Chapter 4 describes the implementation of our framework and method to resemble the situation of TKF. Research question 4 is answered here, and we will have a model for quantifying situations.
Chapter 5 encompasses all results that come from current situation simulations and the experiments that lie within the possibilities of TKF. It is the answer to our 5th sub-question.
For maintaining the presented results in the future, we provide the user a guideline in chapter 6. This guideline encompasses the fixed and unfixed parts of the tool and describes the steps to execute the experiments.
12
2
Key aspects of the production line
In this chapter we discuss the processes and its accompanying numbers and rules that are of importance to our production line. We can utilize these as a basis for the findings in chapter 4. Section 2.1 describes the processes that precede to insulating and degassing. Subsequently, we discuss insulating and degassing in sections 2.2 and 2.3 respectively. To close our chapter, we describe our expression on the remainder of the production line in 2.4.
2.1
Production planning
Before production can be started at the CDCC, a couple of steps are preceded. For instance, the material that is used for production must be available, and a plan is needed for creating a production schedule.
Order release
Orders at the ‘Energie’ department are received from the production planning department. They
have contact with the customer and agree on a certain delivery date. It is up to the ‘Energie’
department to produce these products, and ideally produce them on time. From an overview with the open orders, which is an overview that could even go up to half a year from now, orders can be selected to produce. By releasing them, a priority is given and they are in the waiting line ready to be produced. This is then linked to the operating employees.
Wire drawing
Wire drawing is the production step that precedes insulation. Wires come in the form of aluminum or copper and are drawn by a machine designed for this material. The wires are bundled in bunches and transported on increasingly faster-turning discs, which causes the material to stretch. Dies for drawing with synthetic diamonds give the aluminum wire a controlled diameter. The produced wire is rolled on a reel and is ready for insulating.
Because the wire drawing precedes the insulation, one cannot start insulating without having thought about this step. The schedule for insulating must always take into account the schedule of wire drawing.
Expression summary production planning
Expression Answer
The connection between wire drawing and insulating
The wire first has to be drawn for it to be insulated. Schedules need tuning.
Order release An order can be produced if it is release by the management.
Table 3: Expression summary production planning
13
2.2
Insulating
The CDCC is the most complex insulation line at TKF. CDCC is an abbreviation of Completely Dry Cured and Cooled Curing. In short, the process is as follows: Aluminum or copper conductors are preheated and provided of 3 layers of plastic in 1 spray nozzle by extrusion. Next, the insulation is vulcanized and cooled. This happens in a long trajectory of heated tubes with nitrogen filling, and later by tubes and baths with cooling water. An accumulator system makes it possible to weld a new reel with a conductor to an emptying reel. In this way, production can be continued without interruption. The cables consist of 3 layers of plastic: semiconductor – insulation – semiconductor. The plastics that are fed to the extruder must be extremely pure, meaning there cannot be any dust or residual products present. This is why a thorough clean-up is needed after a material or setup change. Without the use of nitrogen in this process, gas bubbles can arise within the insulation and make the cable useless.
CDCC Haaksbergen and Lochem
TKF possesses 2 CDCC lines, 1 in Haaksbergen and 1 in Lochem. The CDCC in Lochem is bought for expansion of the production line in Haaksbergen. Besides medium voltage cables, it can also produce high voltage cables. Its production speed is a lot higher because it is a newer and more advanced machine. A disadvantage of this machine is that it is located in Lochem and must be transported to Haaksbergen for further operations. When a product is finished it is transported to Haaksbergen the next day, this takes about half an hour. Operating times for the CDCC in Lochem are either 0 hours per week or 80 hours per week.
The decision to produce in Lochem is not an easy decision and depends on the current situation. Because of complexity reasons we consider the CDCC as only 1 machine, namely the CDCC in Haaksbergen. This choice is proposed by TKF and ensures that a solution with this situation still has value for them. Reason for this are the future plans for the CDCC in Lochem (it can produce more than medium voltage cables) and that the majority of the cables are produced in Haaksbergen.
Operating times in Haaksbergen are continuous for the CDCC. There are three work shifts of 8 hours per day that alternate. A workweek starts with the night shift on Sunday at 22:00 and understandably ends there too.
When production is started at the CDCC, the first couple of meters are for testing the setup and usually wasted. The last couple of meters are wasted too, because the machine operates until the order is complete, leaving the residual meters for production support. In between these wasted meters, the machine can keep running until the reels in use are full or empty and need changing.
14
Expression summary insulating
Expression Answer
There are 2 CDCC lines. 1 in Haaksbergen and 1 in Lochem
We consider only the CDCC in Haaksbergen
Operating times CDCC Haaksbergen Continuous. Workweek begins and ends on Sunday at 22:00
Setup time of a product Is set and can be found in the database
Table 4: Expression summary insulating
2.3
Degassing
Degassing is a process that is used for the vulcanization (form a net) of thick cables with XLPE insulation, and starts directly after the insulation process. XLPE is a type of plastic that is applied to the core of energy cables. Over time, a chemical reaction takes place that makes the insulation capable of enduring a short maximum operating temperature of 200 °C (short-circuit situation). The conventional operating temperature of a cable is at most 90 °C. Each cable degasses automatically and must be completely degassed before the next operation. After a specified time, the structure of the XLPE changes and the cables is cooled down. We describe the two ways by which a cable can be degassed at TKF.
Degassing room 1 and 2
As it is earlier described in sub-section 1.4.6, TKF has 2 degassing rooms available for medium voltage cables. In this research we call these degassing room 1 and degassing room 2, with a respective capacity of 10 and 4 reels. The reels with the insulated cores are placed in a room with heated water tanks by a forklift truck driver.
15
Storage space degassing
Because TKF does not have the space to put all reels in degassing rooms, they make use of the
natural degassing characteristic of the medium voltage cables. In ‘Table 2: Degassing times per voltage class. (TKF, 2019)’ we can see the degassing times in hours if they are not put in a degassing room (20 °C). The storage space for these reels comprises 15 rows with 4 places in each row. Next to each row there is a pillar on which a paper is placed with information about the reels (voltage class, order number, etc.).
Expression summary degassing
Expression Answer
Space in degassing room 1 and 2 10 and 4 reels, respectively
Warm-up and cooling-down time together 24 hours
Products excluded from degassing rooms Voltage class 6/10 kV
What products are placed in a degassing room? Depends on production order and decisions of production planner
Number of storage places outside degassing rooms
60
Degassing times outside and inside the degassing rooms
Table 2: Degassing times per voltage class. (TKF, 2019)
Operating times degassing rooms and storage space
Continuous. Workweek begins and ends on Sunday at 22:00
Table 5: Expression summary degassing
2.4
Remaining production steps
As we discussed in chapter 1, the production line consists of more steps than just insulating and degassing. ‘Table 6: Maximum speed of every production step’ shows the maximum speed each
16 Production step Max. meter/minute
CDCC 25 m/min
Screening line 1 125 m/min
Screening line 2 100 m/min
Drumtwister 100 m/min
Rubber line 25 m/min
Jacketing line 1 125 m/min
Jacketing line 2 125 m/min
Table 6: Maximum speed of every production step
The CDCC, together with the rubber line, are the machines that have the lowest maximum production speed. Based on these numbers we can state that these have the potential to be a bottleneck. On an average day, the rubber line does not have to produce constantly because rubber is only needed for producing triple-core cables. This means that there is extra time available most of the times to cover a potential problem and produce rubber if the stock is running empty. The CDCC, on the other hand, is with its lowest maximum speed and continuous production schedule a constant threat to be the bottleneck. When TKF makes use of the CDCC in Lochem, they see it as a last resort so we will not take this machine into account.
17
3
Theoretical framework
In this chapter we are finding the answer to sub-question 2 and 3, “What framework must be used
to express the production line for optimization purposes?” and “What method must be used for optimization calculations?”, respectively. In section 3.1 up to 3.4, we discuss frameworks that are compatible with the situation of this research and are widely used. Subsequent to that, we discuss one or multiple solving methods that come with the framework or are applicable to it. To conclude the chapter and to provide an answer for the two sub-questions, we develop a concept matrix to score our findings and substantiate our choice in section 3.5.
Below, we describe 4 different theoretical frameworks. From a literature search in the databases of Scopus and Web of Science, we discovered that these are widely used and have been applied to similar cases. Of course, there are a lot of other theoretical frameworks but they did not pass our first scan on applicability.
3.1
Linear programming
Framework
Although linear programming may sound like it needs coding on a computer, it does not necessarily has something to do with that. It is a method for solving optimization problems and eventually can be made applicable for the use of a computer, to make use of its computing power. According to (Winston, 2004) a linear programming problem is an optimization problem for which we can do the following:
1. We attempt to maximize (or minimize) a linear function of the decision variables. The function that is to be maximized or minimized is called the objective function.
2. The values of the decision variables must satisfy a set of constraints. Each constraint must be a linear equation or linear inequality.
3. A sign restriction is associated with each variable. For any variable xi, the sign restriction specifies that xi must be either nonnegative (xi ≥ 0) or unrestricted in sign (urs)
An LP problem has an objective function that gives a score on the decisions that are made. This score creates support for optimization. This objective function is linear and built on variables that depend on decision variables, accompanied by accessory parameters. Constraints describe what is possible in a situation, otherwise objective functions for minimization and maximization will always turn out to be 0 and infinity, respectively. These constraints are built from variables and parameters too.
Parallel machine scheduling
18
Solving methods
Linear programming problems start off as small problems that can be calculated by hand, but as soon as the number of variables rises or the event horizon moves further away, it quickly is not efficient to calculate these problems without the use of a computer. There are a lot of companies providing a linear programming solver, with Microsoft being the most well-known. Microsoft Office provides a tool in Excel
called ‘Excel Solver’, which makes it easy to
translate an objective function, variables and restrictions into a computer and calculates the possible outcomes in order to pick the minimum of maximum.
Parallel machine scheduling is mostly solved by handmade solvers in the software of one’s own likes.
Still, there are some companies that provide a solver as an add-on from a software package. Because the theory is less used than linear programming, the software is less used and developed, leaving most solvers with missing functions that might be applicable to most situations.
3.2
Custom algorithm
Framework
Algorithms are widely used in multiple disciplines and can be expressed as a set of instructions. In mathematical situations, they are mostly used for computational purposes. The instructions in an algorithm can range from just performing one task, to whole software programs and beyond. The limit of an algorithm depends on the allowable size of the software it is written in.
The instructions that an algorithm perform can be very specific, which makes it adaptable to any situation. This is the reason that a custom algorithm represents a situation much better than a general algorithm. To let the algorithm make decisions, data is needed as an input. When put through the algorithm, the data is processed in a way that is desired, which represents the output.
Creating a custom algorithm for computational purposes is called computer programming. Computer programming needs a programming language, which is mostly connected to the software of choice. Languages are quite similar but each has its benefits, also depending on the capabilities of the software. Well-known programming languages are, among others, Python, Java, C++ and Visual Basic for Applications (VBA).
For this research, we will zoom in on VBA for its familiarity with TKF and the researcher’s knowledge. It is integrated with all Microsoft Office applications and started off with Excel, which is the application where it is most used. VBA is the underlying algorithm for the functions that can be used in Excel and creates the possibility to extend these with custom functions. The programming language itself can be found in a VBA manual and there are numerous fora about the possibilities and how to use its notations.
[image:27.612.316.511.86.195.2]19
Solving methods
When designing and programming an algorithm, the way to getting the desired output must be designed and programmed too. This means that a solving method for an algorithm is a couple of extra instructions incorporated into the algorithm and can easily be made suitable to any situation, like the algorithm itself. Luckily, there are some handles that guide the programmer in the right direction, because there are a lot of ways to solve a situation. We call these handles heuristics and according to (Stelios H. Zanakis, 1981): “Operations Researchers have seen heuristics as procedures
to reduce search in problem-solving activities or a means to obtain acceptable solutions within a
limited computing time”. For programming a heuristic, there are a set of instructions associated with the heuristic of choice which serves as the general part. This general part can later be translated to the exact situation.
3.3
Markov decision process
Framework
All Markov decision processes have its fundaments in Markov chains and satisfy the Markov property. Before we discuss these processes, we shortly take a look at Markov chains.
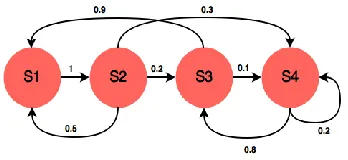
In (Gagniuc, 2017), a Markov chain is described
as follows: “A Markov chain is a stochastic
model describing a sequence of possible events in which the probability of each event depends only on the state attained in the previous
event.” In Figure 5: Example of a Markov chain the state an object can be in is depicted by a circle. Between these circles arrows are placed, representing the possible transitions between states and the chances a transition takes place.
To extend this short description of Markov chains to Markov decision processes, the latter has an addition of allowing rewards and decision making. The rewards are given when moving into a new state, but cannot be all the same. Decision making overrules the chances associated with the transitions. Markov decisions processes can be used for a large portion of all the optimization problems because the chain has no limit and all specific decisions can be applied.
Solving methods
It is conventional that Markov decision processes that are of a larger scale, are computed by an algorithm. There are some generic algorithms available, but to make it situation specific it needs tweaking. The boundary to where algorithms take over from manual calculations is when the user finds it more effective and less time consuming. A problem with the scale described in this research is impracticable to calculate manually, so a situation specific algorithm should be made. As is discussed in section 3.2, creating an algorithm is most convenient with the use of Microsoft Office’s
[image:28.612.345.519.336.416.2]VBA.
20
3.4
Petri net
Framework
A Petri net is a graphical tool for the description and analysis of concurrent processes which arise in systems with many components (distributed systems) (C. A. Petri, 2008). It includes a specific notation which holds for all software and for manual description. The cornerstones for a Petri net are the following:
Tokens represent any object that travels through the described system. They pass on between states, indicated by transitions. One can place restrictions on transitions or states to represent waiting times, a fixed number of places or a different rule. When a transition of tokens is made, it is called firing a token. Petri net as a graphical tool creates a very intuitive and clear overview of a system, which can be useful for communication towards others. Simulation of the system is an option and creates a feeling of the flow.
Solving methods
Software for Petri net notations most of the times come with various analysis options. By simulating the system, a lot of different transitions can be expressed by probabilities, the steady-state of the system is easily calculated, and one can see if queues arise. There is no clear leader in the development of Petri net software, all companies have their own variant with its own options. Unlike the other frameworks, Petri net does not deliver a schedule but creates an overview of various distributions.
3.5
Concept matrix
Choosing the framework
To find an answer for our second sub-question and a partial motivation for the answer to the third sub-question, we make use of a concept matrix. In a concept matrix we score the frameworks by elements that we think are of importance. These elements are based on findings in the literature and preferences of TKF. The elements that were derived from findings in the literature address the points on which TKF’s situation differ, but are needed to accurately describe it. Preference elements
came up when discussing the possible solving methods and their implementations with the supervisors. We describe these elements in a random order below.
‘The framework must be compatible with the software TKF uses’. Eventually, TKF is the environment
to where the framework is implemented. Should they decide to adopt this framework, accompanied with the solving method, then instant compatibility with their software is desired. According to the supervisors of this research, it is not likely that they immediately want to invest if they do not own the software that is used. This can lead to deliverables that are not taken serious from the beginning.
21
‘There must be possibilities for specifying to TKF’s situation’. Frameworks can be, as described in
the previous sub-sections, quite general. It is meant to serve for a whole set of problems, which can all be individually different. A framework that cannot be specified to a certain situation, result in a non-closing expression and conclusion. Another advantage of the flexibility of a framework is that it lends itself easier for experimentation. With experimentation being one of the main topics in chapter 5, the option to experiment is much desired.
‘Making a distinction between orders must be possible’. We cannot look at the orders as if they are all the same. Each order has its own specific length, thickness, setup time, and so on. Making a distinction between orders is an important factor in creating a closing expression.
‘Easy to use when solving’. We want to create a deliverable that does not need inside information
or extensive knowledge. Should a new person use the deliverable, then he or she must be able to use it without consulting this research or the researcher.
‘The framework in combination with the solving method must not be time-consuming when solving’.
There can be multiple ways for solving to be time-consuming. For instance, the translation between the framework and solving method is not easy. Another option is that solving takes up a lot of computing time or requires extensive input delivery from its user. It is preferable to have a solving method that does not take more than 30 seconds to compute an answer. The solving method must be quick because it becomes a burden when the user has to wait long, and then he or she is most likely to run it once and not to try different options.
Overview of concept matrix elements:
1. The framework must be compatible with the software TKF uses 2. There must be possibilities for specifying to TKF’s situation
3. Making a distinction between orders must be possible 4. Easy to use when solving
5. The framework in combination with the solving method must not be time-consuming when solving
1 2 3 4 5
Linear programming X X X X
Parallel machine scheduling X X X
Custom algorithm X X X X X
Markov decision process X X X
Petri net X X
22
The frameworks are scored by the elements in the concept matrix in ‘Table 7: Concept matrix for scoring frameworks’, by checking the boxes with an ‘X’ if the element applies to the framework. An empty box means that the element does not apply to the framework.
We can see that custom algorithm scores a perfect match and linear programming is close. The other three frameworks have two or more mismatches, leaving them unworthy for consideration. Linear programming misses the 5th element, due to the complexity with all variables and relations. Overall, creating a custom algorithm is a better fit because it can be specified more easily and it is less time consuming to set up. It can also be easily shaped in the way TKF desires. This is why we choose creating a custom algorithm as our framework and as an answer to our 2nd sub-questions.
To find the answer to sub-question 3, we must turn to the solving methods that go along with custom algorithms. In section 3.2.2, we found that heuristics serve as handles for cutting computing time. The algorithm itself is created to be a solving method, with the heuristic as a powerful addition. In the next sub-section, we describe which heuristic is best for our research.
Choosing a heuristic
Our problem is best described as a scheduling problem, sometimes called a combinatorial problem. For these problems, a certain heuristic technique applies very well. In sub-section 3.2.2 we described the definition of a heuristic.
“Local search is an emerging paradigm for combinatorial search, which has been recently shown to
be very effective for a large number of combinatorial problems.” (Moscato & Schaerf, 1998). As the title of the technique states, it is based on looking at close solutions which are in the search space. Within the search space, after defining its size, solutions are checked by iteratively stepping to neighbour solutions. Each solution is then assessed by checking the objective function, in order to maximize or minimize the outcome of this function.
Moscato & Schaerf (1998) presents three popular local search techniques. ‘Hill climbing’, the most
simple one, is based on only accepting neighbour solutions that are better or equal, never accepting worsening moves. There are different forms of hill climbing like steepest hill climbing, random hill climbing or min-conflict hill climbing. The other two popular local search techniques are approaches for improving the hill climbing technique. ‘Simulated Annealing’ relies on probabilistic, memoryless decisions and ‘Tabu Search’ is based on the use of memory of previously visited solutions.
Because of familiarity and time planning, Simulated Annealing and Tabu Search take up more time for understanding and implementing, we choose to focus on the hill climbing technique. More
23
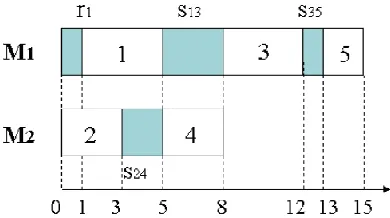
Steepest hill climbing iterates from its starting position through all neighbourhood solutions. It accepts the solution only if it is an improving solution. By completing the iteration from the starting position, the solution with the most improvement is selected as the new solution.
To visualize the technique, we sketch an example. In Figure 7: Iterating through neighbourhood from starting position the starting position is 1. It is switched with its neighbours 2, 3, 4 and 5 only to accept a solution that has a better outcome in its objective function. In our case, swapping 1 and 3 was the solution with the most improvement in the objective function. Now, we change the starting position from 1 to 2 and iterate again through all its neighbours, see Figure 8: Iterating through neighbourhood from new starting position. This process of changing the starting position and iterating through its neighbours gets repeated for all possible starting positions. We eventually end up with our local minimum or maximum which we take as the best solution.
To conclude this chapter with an answer to both
sub-question 2 and 3, the best approach in this research is to build our own custom algorithm (sub-question 2), in combination with the steepest hill climbing technique for optimization calculations (sub-question 3).
Figure 7: Iterating through neighbourhood from starting position
24
4
Implementation of theory
This chapter describes the way the production line of TKF is translated into a conceptual model based on the findings in chapter 3. By doing so, we answer sub-question 4: ‘How to implement TKF’s
situation into the framework and method?’. We start off in section 4.1 with defining our goal, meaning what purpose and layout the deliverable should possess. From there, we can describe the building blocks that together fulfill the purpose and fill in the layout. The first building block is obtaining the required data out of the database and is described in section 4.2. The second building block is creating the conceptual model in section 4.3. The conceptual model should be able to process the data from the database. Thereby it must be the result of the findings regarding the framework chosen in chapter 3, and be a foundation for realizing the findings regarding the heuristic. The latter condition is described in section 4.4 and is also our final building block.
4.1
Purpose and layout of deliverable
Purpose
Our goal is to translate the situation of TKF into a conceptual model, with the use of a custom
algorithm. To add to that algorithm, we make use of the heuristic ‘steepest hill climbing’ for
optimization calculations. If we created the conceptual model correctly, then it serves the answer to tackle our core problem which is measured by our KPI’s. Thus, we need to make sure our conceptual model quantifies the situation based on the KPI’s.
The first KPI, throughput, is measured by the number of products that is produced per unit of time. We do this by creating an overview of the orders with their time of completion. By then, it is simply dividing the number of orders produced by the time it took to produce all orders. The overview of the production is described in sub-section 4.1.2.
Lateness in delivery, our second KPI, can be measured by the difference between the set time of completion and the calculated time of completion. The calculated time of completion can be obtained from the production overview we create.
The third and last KPI, standstill of degassing rooms, is the percentage of the total production time that the degassing rooms are not in use. From our earlier mentioned overview in 4.1.2, we can see how long the degassing rooms are not in use.
Besides the purpose of measuring our KPI’s, it serves as a platform on which TKF obtains schedules, should they decide to use it. This adds a new purpose to our conceptual model, namely the model being a tool that provides overview on production scheduling and can optimize the situation when desired.
Layout
The layout of the conceptual model must include easy access for reviewing the KPI’s. When taking
it from the perspective of a tool for TKF, we want a simple layout that speaks for itself. Layouts for the sheet in the excel file can be found in ‘Appendix B: Layout conceptual model’. In the excel file
we have the following sheets:
25
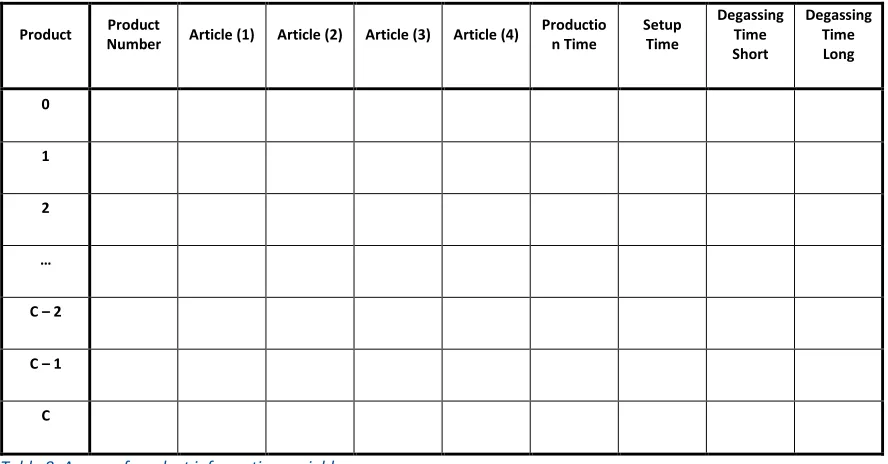
Per product, we have the ability to lock it so steepest hill climbing will not consider solutions in which this product is swapped. Then we have about 5 columns with information about the product, useful for interpreting the obtained schedule. The length, processing time and setup time provide information for calculations. In the column named priority, the priority given by TKF is displayed and products are sorted to this value. The column value represents the short degassing time and the delivery date end product is incorporated for calculations in the ‘Due Date’ sheet. At last, we have the column ‘Order’ which is a tool for the execution of the steepest hill climbing heuristic.
2. Degassing
The sheet about degassing displays the same product information as the CDCC sheet. In the column
‘Whichdegassing room?’ the user can indicate if a certain product is present in 1 of the 2 degassing
rooms. Should this be the case, the user can fill in the number of hours it is already degassing in column G.
3. Schedule
This sheet provides the option to execute the calculations for the conceptual model, as well as for the steepest hill climbing heuristic. When executed, it provides an overview of the products that passed the CDCC, Degassing room 1, Degassing room 2 or no degassing room at all. All relevant product information is given, as well as the time it started insulating and/or degassing or finished insulating and/or degassing.
4. Due date
This sheet gives an overview of the products, with its product information, on when it is finished degassing and when the end product is expected to be delivered. Based on these dates, the difference is calculated.
5. Exsion
The Exsion sheet provides the tool for retrieving the right data from the database. It has 1 tool for the products at the CDCC and 1 tool for the products in the degassing stage.
6. Temporary copy
A temporary copy is made as a backup for the heuristic to compare the initial situation with the new situation.
7. Initial copy
The initial copy is made before orders are swapped by the heuristic. It makes it possible to return to the initial situation and to run the conceptual model after the heuristic ran.
8. Parameters
26
4.2
Information from database
At TKF, almost every productional action and all product information is recorded and stored in a database. This database can be accessed by employees via an ERP system. The software is called Navision and is used throughout all departments. It is used to find information, see what is currently in production or to release and remove products. In addition to Navision, there is Exsion. Exsion is a paid tool in Microsoft Excel, that has a couple of functions regarding getting information out of a database. With the right queries, Exsion can merge different tables, product and production information to the user's likes. It serves as a bridge between the database and Excel and can save the user a considerable amount of time.
Together with the supervisors of TKF, in particular Tom Bijen, we have established the elements and filters that are necessary for our conceptual model, which we will describe below. There are also some elements that are of importance for TKF to be present in the tool. Most important, is that we get all the information of the orders that are scheduled for insulation or are at the CDCC, and the products that are degassing. We shortly discuss the two Exsion queries that we use for our conceptual model and tool below. These queries can be found in Appendix C: Exsion queries.
CDCC
We want to request the data of the orders that are currently at the CDCC, and the orders that are in line for insulation. Figure 16: Exsion query for CDCC results in Appendix C: Exsion queries shows the query that we use for these products. We filter out the products with a length shorter than 200 meters because these are test reels or remnants from the actual order. Furthermore, we ignore the products that have a degassing time lower than 50 hours, denoted by ‘Waarde’. These orders do not belong to this production line. An order can only show up if it is finished at its previous operation, filtering out the orders that are scheduled for the long term and have not yet passed the wire drawing.
We sort the results to their priority, which is assigned by the production planner. Should multiple orders have the same priority, a second filter puts them in order of shortest delivery date of the end product.
Degassing rooms
With the query displayed in Figure 17: Exsion query for degassing results, we request the data of the orders that are currently degassing. This means that they can either be in degassing room 1, degassing room 2 or at the storage space for degassing. From the information in the database, we cannot make a distinction about the orders locations. As it is done with the CDCC query, we do not want the orders with a degassing time lower than 50 hours at degassing too.