University of Warwick institutional repository:
http://go.warwick.ac.uk/wrap
A Thesis Submitted for the Degree of PhD at the University of Warwick
http://go.warwick.ac.uk/wrap/62117
This thesis is made available online and is protected by original copyright.
Please scroll down to view the document itself.
Structure and Dynamics of Protein in the
Permeation and Gating of Potassium Ion Channels:
Identifying Molecular Determinants and Developing
Coarse-Grained Approaches
by
Salvatore Mario Cosseddu
Thesis
Submitted to the University of Warwick
for the degree of
Doctor of Philosophy
School of Engineering
Contents
List of Figures iv
Acknowledgments viii
Declarations ix
Abstract x
Chapter 1 Introduction 1
1.1 KcsA. . . 2
1.1.1 Gating . . . 4
1.1.2 Permeation . . . 7
1.1.3 Selectivity . . . 9
1.2 Aim of the work . . . 10
Chapter 2 Methods 13 2.1 Molecular Dynamics . . . 13
2.2 Free energies Methods . . . 17
2.2.1 Free energies and MD . . . 17
2.2.2 Umbrella sampling . . . 18
2.2.3 Metadynamics . . . 19
2.2.4 MetaD parameters . . . 20
2.3 Simulation set up . . . 21
2.3.1 Embedding protein in the membrane . . . 22
2.4 General analysis . . . 23
2.4.1 Order parameters or Collective variables . . . 23
Chapter 3 Dynamics of the ions and free-energy calculations 26
3.1 Methods . . . 28
3.2 Analysis of equilibrium dynamics . . . 28
3.3 Conclusions . . . 32
Chapter 4 Identification of the network of residues affecting SF dy-namics 34 4.1 Introduction . . . 34
4.2 Results. . . 36
4.3 Analysis of E71A dynamics . . . 37
4.4 Permeation test on V76 flipped conformation . . . 44
4.5 Comparison of WT, Y82A and R64A . . . 45
4.5.1 Analysis of dynamics of R64A and Y82A. . . 45
4.5.2 R64-L81 interplay . . . 48
4.6 Energetics of the arginine motions . . . 50
4.6.1 FES for R64 dynamics . . . 50
4.6.2 FES for R89 dynamics . . . 53
4.7 1d FESs for d71. . . 54
4.8 D80 state and the dynamics of the SF and the ions . . . 56
4.9 Network centred on D80 . . . 59
4.10 Conclusions . . . 62
Chapter 5 Gating: C-type inactivation 64 5.1 Introduction . . . 64
5.2 Methods . . . 66
5.2.1 pH-related inactivation. . . 67
5.2.2 Free energy calculations . . . 68
5.3 Results. . . 69
5.4 Deprotonation-reprotonation approach . . . 69
5.5 C-type inactivation not related to pH. . . 77
5.5.1 Investigation of relevant transitions of the network of residues 78 5.6 D80 side chain flipped in two subunits . . . 92
5.7 FESs for Y82A and R64A . . . 96
5.8 Conclusions . . . 100
6.1.1 Umbrella Sampling . . . 111
6.2 Issues in the calculations of the free-energies . . . 112
6.2.1 Free-energies computed on KcsA . . . 112
6.2.2 Analysis of the issues. . . 113
6.3 Ion permeation in the conductive conformation . . . 119
6.4 Mechanism of permeation . . . 120
6.4.1 No incoming ion . . . 120
6.4.2 Permeation promoted by incoming K+ ion . . . 121
6.4.3 Driving forces . . . 126
6.4.4 Confirmation on unbiased simulations . . . 129
6.5 Selectivity: a thermodynamic mechanism . . . 129
6.5.1 Energetics . . . 132
6.5.2 Mechanism of selectivity . . . 135
6.6 Inward transitions and voltage-dependent inactivation . . . 136
6.7 Discussion . . . 138
List of Figures
1.1 Structure of potassium ion channels: KcsA. . . 3
1.2 Modal behaviour of KcsA. . . 5
1.3 Scheme of current regulation in KcsA. . . 6
1.4 Structures of the region of the selectivity filter in i) wild type (WT), ii) E71A, iii) R64A, and iv) Y82A . . . 8
2.1 Simulated system. . . 23
3.1 Distributions of coordinates and velocities of K+ions in the selectivity
filter . . . 30
3.2 The power spectra of coordinate and velocity of K+ ion in the
selec-tivity filter. . . 30
3.3 Auto-correlation coefficients of coordinates and velocities of K+ ion
in the selectivity filter . . . 31
3.4 Mean values and variances of the positions of a K+ ion in the site S0
as a function of the time interval used to calculate them . . . 32
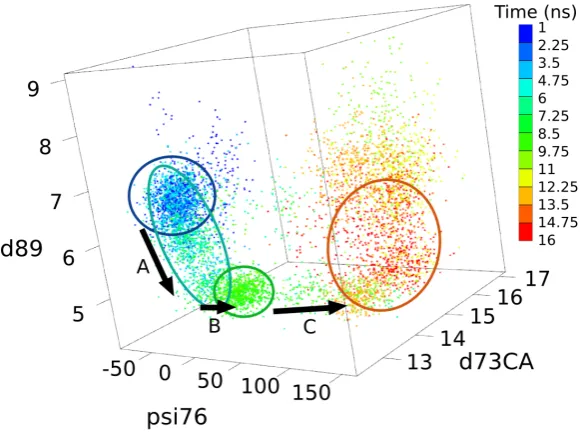
4.1 Time series (reported in ns) of the state of D80 side chain, defined as the distance from the C\alpha atom of residue 73 used as a reference
(d73CA, measured in \r A). Dotted lines indicate the value of d73CA obtained X-ray experiments (pdb code 1K4C157). . . . . 38
4.2 Superposition of relevant snapshots from the simulation of E71A. . . 40
4.3 Time series for the influence of D80 and R89 dynamics on the selec-tivity filter in E71A. . . 41
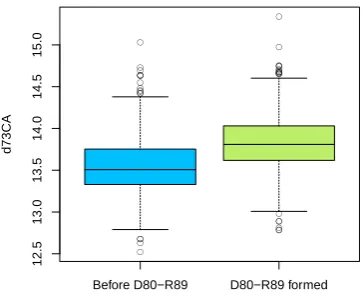
4.4 Distributions of d73CA in E71A depending on D80--R89 state.. . . . 42
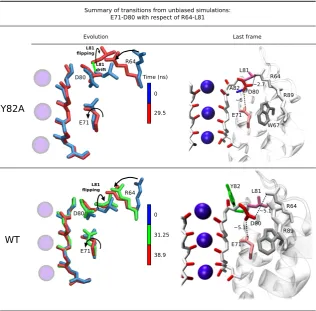
4.6 Relevant snapshots from the simulations of WT and Y82A. The con-formations are superimposed with respect of the SF (the backbone atoms of resides 74 to 78). The figures reveal the interconnection be-tween the dynamics of L81 and the possible arising of strong interac-tions between D80 and R64. These interacinterac-tions, which can eventually evolve into strong H-bonds, are able to cause the disruption of the linkages between the E71-D80-W71 triad. . . 46
4.7 Root mean square displacement (RMSD, \r A) computed for the residues in the region of the SF (residue from 60 to 92), from the X-ray struc-ture of the WT (pdb code 1K4C). . . 47
4.8 Flipping of D80 side chain observed in the simulation of Y82A. . . . 48
4.9 Estimate of the FES for the interplay between R64 and L81 in Y82A and WT.. . . 51
4.10 Radial distribution functions for Cl - ions from arginines R64 and R89 54
4.11 Estimate of the FES for the dynamics of R89 in the WT. . . 55
4.12 Estimate of the free-energy as a function of the distance d71 computed for the different conformations of residue L81 and the K+ ions in the
SF. . . 57
4.13 Dynamics of the filter and the nearby residues for R64-D80 interac-tions maximised. . . 58
4.14 Dependence of the correlations of permeating ions on the state of the residues behind the selectivity filter. . . 60
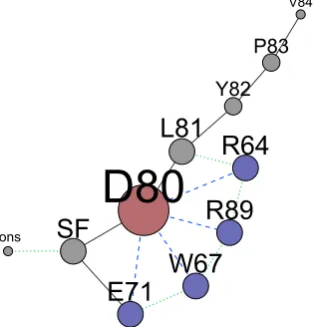
4.15 Network of residue that regulates the conductivity in KcsA. . . 61
5.1 Comparison of dynamics of R89 in KcsA, and R82 in Bacteriorhodopsin 70
5.2 Snapshots representative for the transition from Cp to Ip . . . 71
5.3 Geometry of the K+ coordination in the different conformations of
the selectivity filter . . . 72
5.4 Hydrogen bond analysis on D80 in different conformations assumed by the protein during the pH-related inactivation mechanism . . . . 73
5.5 RMSD analysis for the SF (backbone atoms of residues 74 to 78) of KcsA simulated in the case of E71 deprotonated. The X-ray structure from which the system was built (pdb code 1K4CZhou et al.157) was
used as reference. Both the simulations show comparable transitions in the structure of the SF compatible with the existence of two meta-stable states. . . 74
5.7 Comparison of the inactive structure obtained through the simulations with the X-ray structure.. . . 76
5.8 Comparison with experiments of the conformations representative of the pH-related mechanism.. . . 77
5.9 Collective variables (CVs) used to investigate the behaviour of the network of residue behind the SF. . . 79
5.10 Scheme of the different multi-dimensional sections of the overall FES computed. Representative conformations are shown for the different states. . . 80
5.11 Multi-dimensional sections of the FES as a function of the chi80 and d71 computed for L81 non-flipped conformation . . . 81
5.12 Multi-dimensional section of the FES as a function of the chi80, d71 and d67 computed for L81 flipped conformation. . . 84
5.13 Snapshots obtained from the metaD calculation of the multi-dimensional sections of the FES as a function of the CVs chi80, d71 and d64 (L81-flipped and SF occupancy 00101+0). . . 86
5.14 Superposition of a representative conformation with X-ray structures. 87
5.15 Order parameters for the statistical analyses on the simulation com-menced from D80flip-R64close. . . 88
5.16 Scatter plot, distribution and correlation of E71CA-D80CA and d71CA from the simulation commenced from D80flip-R64close.. . . 90
5.17 Scatter plots, distributions and correlations of d71CA, d64, d89, d64, d67 from the simulation commenced from D80flip-R64close. . . 91
5.18 Inactive states reached from D80flip-R64far-AB . . . 93
5.19 FESs as a function of chi80 and d71, for 10101+0 and L81 non-flipped, calculated for different multi-D80flip conformations.. . . 94
5.20 Inactive states reached from D80flip-R64close-BD, superimposed with the putative structure of the inactive state of the SF (coloured in magenta, pdb code 1K4D157). . . . . 96
5.21 FES as a function of the CVs chi80, d71 for the mutant R64A. . . . 98
5.22 a) Inactivation of Y82A obtained via MetaD calculation; b) Diabatic energy surface for Y82A. . . 99
5.23 Scheme for inactivation in KcsA. . . 103
6.1 Collective variables for analysis on permeation. . . 110
6.3 Multi-dimensional well-tempered metaD calculation performed over the CVs zK12,zK3and xyK3. No additional restrains applied. . . 114
6.4 Ideal free-energy calculation with biased methods.. . . 117
6.5 Common issues in free-energies calculations with biased methods. . . 118
6.6 Summary of the free energy calculation on the permeation mechanism for the ion channel KcsA. . . 122
6.7 Radial distribution function (RDF) from S0 for the K+ions excluded
K1, K2 and K3. . . 123
6.8 Different projections of the FES which governs K3. . . 127
6.9 Driving force of the permeation, FES for the two ions bound to the SF. 128
6.10 Summary of the results on permeation. . . 130
6.11 Time series for the two mechanisms of permeation. Trajectories of each relevant ions (the K+ ions in the cavity and the K+ ions bound
to the SF) were stored every time step (1fs) speeding up the process
by initially placing two K+ ions in the cavity. On the left the ``purely
electrostatic knock-on'' is shown: i) the two K+ ions in filter move
outwards coherently, ii) the incoming ion enter in the filter after some time. On the right the ``classic knock-on'' is shown: the incoming K+ performs the initial transition into the filter, soon followed by
the outward transition of the two K+ ions still in the filter. In the
latter case it is possible to see that the correlated multi-ions transition involved also the second K+ in the cavity. . . . 131
6.12 Different projections of the multi-dimensional FES computed with a Na+ ion in the cavity. . . 133
6.13 Free energies for the incoming ion, either K+ of Na+ projected into
the channel axis, i.e. respectively onto zK3 andzNa3. . . 134
6.14 Coordination of Na+ atom in the entrance of the SF (B
in). . . 134
6.15 Detailed trajectories of the metaD calculation that underwent inacti-vation . . . 137
Acknowledgments
I would like to thank:
\bullet My supervisors Dr. Igor Khovanov, Prof. Mike Allen and Prof Mark Rodger,
for their important guidance and support.
\bullet Diletta Cordeschi, which has made this possible.
\bullet My family, for their strong support.
\bullet All my collegues, Aaron Finney, Julia Choe, Jasmine Desmond, Domenico
Caruso, Chimie Gamot.
This thesis was typeset with LATEX2\varepsilon 1 by the author.
1LATEX 2
Declarations
This thesis has been composed by myself, and all work herein is my own work, excepted where otherwise stated.
Material reported in chapter3 has been published in Cosseddu et al.40.
Fig.1.3is c\bigcirc Zhou et al., 2001. Originally published in Nature (doi:10.1038/35102009,
licensed content of Nature Publishing Group, license number 3356501082913).
Fig. 1.2 is c\bigcirc Chakrapani et al., 2007. Originally published in Journal of
Abstract
Ion channels are transmembrane proteins which allow small ions to flow across the membrane downhill along the electrochemical gradient, with high efficiency and selectivity over the different ion species, and which play crucial roles in a wide range of vital physiological functions. Research on the channels selective for potassium ions have attracted a great deal of attention over the past decade. This is because of the availability of three dimensional microscopical structures and because they provide a paradigm for the study of the complex superposition of the permeation of the ions and structural rearrangements which is responsible for the regulation of the current in ion channels.
Chapter 1
Introduction
Cells are surrounded by membranes consisting of a phospholipid bilayer imperme-able to charged compounds. Permeability is conferred by different classes of proteins and, among them, channels enable ions to flow rapidly in the downhill direction.16,64
The latter catalyse ion permeation with extremely high efficiency, resulting in over-all high conductivities, with additional features of selective permeability and gating according to some specific stimuli, such as a membrane potential change, a neuro-transmitter, or a mechanical deformation.64Ion channels have primary responsibility
for vital physiological functions such as the regulation of osmotic pressure and cell volume, and for electrical activity and signal transduction as they are involved in a variety of processes such as nerve impulses, muscle relaxation, cognition, sensory transduction, regulation of blood pressure, and cell proliferation.10 Because of their
fundamental roles, ion channels are among the most important drug targets and have been linked to diverse diseases including cardiac disorders, neurological indications, kidney failure, the perception of pain, and blindness.10,75,124Moreover, artificial
ana-logues have also been found to have applications in engineering in the construction of biosensors, in interfacing biological surfaces with semi-conductors, and in organic-inorganic hybrid membranes synthesis for fuel cells. There is a great diversity among ion channels.64Typically they consist of different protein domains which span across
the membrane, creating a water filled pore. Most of the ion channels possess a spe-cific region that functions as a filter in the selection of the different ion species.10,64
Diffuse families of ion channels are selective for K+, Na+, Ca2+ and Cl - .64 Selec-tivity is so efficient that Na+ current is practically undetectable in K+ ion channels
except under very specific conditions.110
channels, which can differ in kinetics, mechanisms and modulation of gating. For instance, a mix of many K+ channel sub-types characterised by different gating
kinetics cooperates in each excitable membrane.64
Investigation of microscopic features and properties of ion channels is a com-plicated task. For a long time their three dimensional microscopic structures had been unknown because of the difficulties in isolation and crystallisation outside of their natural environment and because of the complexity of the experimental tech-niques required to solve protein structures.64 Thus all the knowledge was derived
from electrophysiology experiments. The first three dimensional molecular structure was determined only in 1998 by MacKinnon and co-workers,46 for the K+ion
chan-nel KcsA from the Streptomyces lividans bacteria, in a work that was awarded the Nobel prize for Chemistry in 2003. Since then, structures of other K+ ion channels
have been determined (see for instance73,74,81,84,94,95) and, more recently, a Na+ ion
channel.118
Because of their fundamental roles in a wide range of physiological processes and the availability of three dimensional microscopical structures, K+ ion
chan-nels continue to attract a great deal of attention from researchers and provide a paradigm for the study of ion channels.64,132 Theoretical methods have been widely
employed in exploring the most intimate mechanisms that govern these complex sys-tems, particularly MD simulations and free-energy calculations (the subject has been reviewed several times, i.g. see101,129,132). The limitations imposed by experimental
techniques, in which the complex dynamics occurring on molecular spatial and time scales are averaged, providing static images of a channel, can be overcome using these methods.132 Thus the simulation area, with application to ion channels, is a rapidly
growing field able to provide theoretical models and tools to better understand and interpret experimental data.129
1.1 KcsA
Potassium ion channels are found in several families such as voltage-dependent K+
channels, in which the current is regulated by the transmembrane voltage, and in-ward rectifier K+channels, characterised by a higher conductance for inward current
rather than outward current. However, they all share similarities in overall organ-isation and sequence.64,70,132 The bacterial channel KcsA, found in Streptomyces
chan-SF
Cavity
Inner Gate
Out
In
Membrane Hydrophobic Region S0
S1 S2 S3 S4
Figure 1.1: KcsA potassium ion channel. Different regions of the pore are de-noted: Selectivity filter (SF), cavity, inner gate. Five binding sites for potassium, S0. . . S4, can be recognised in the SF. The P-helix is coloured according to an electrostatic calculation performed using the Particle Mesh Ewald (PME) method
implemented in the program VMD67, in order to show its dipolar nature (red and
blue colours correspond to negative and positive charge, respectively).
nels, and in part because of its role as an archetype for ion permeation, selectivity and for the complex interplay of gating and activation that is commonly found in the K+ channel superfamily.64,128 It is a tetrameric protein in which each subunit
is formed by two transmembrane helices (TM1 and TM2) connected by a P-loop. The P-loop is made up of a short polarised helix (P-helix) and an amino acid signa-ture sequence, TXXTXGYGD, that represent a motif conserved across most of K+
channels.31,37,46,64,85
In common with most of K+ions channels, the whole quaternary structure of
KcsA is divided into three functional regions: the selectivity filter (SF), the cavity, and the inner gate (Fig. 1.1). The SF is the narrowest part of the pore, formed by the backbone carbonyl oxygens of the TXGYG sequences, part of the signature sequence, of the four subunits, i.e. residues from 75 to 79 with a valine in position 76 which results in the sequence TVGYG. The cavity is a wider water-filled region
(\sim 5\r A radius) that creates a hydrophilic environment for the ions in the hydrophobic
region of the membrane. The inner gate is accompanied by large movements in the helical transmembrane segment TM2 which creates a restriction or relieves the ion flow.62,119,138,140,147
arranged in rings, create well-defined binding sites for the K+ ions, which force the
permeation to occur in a single file fashion. Although the initial X-ray experiments (resolution 3.2 \r A) suggested the presence of four binding sites (named S1 to S4), more refined structures (resolution 2.0 \r A) revealed the presence of five sites in the SF (S0 to S4) and an additional one, relatively weak, on the extracellular side (S\mathrm{e}\mathrm{x}\mathrm{t}),
confirmed by theoretical calculations.18,157
1.1.1 Gating
Current in K+ ion channels is regulated by different types of ``gates'' which are
crucial for physiological functions.66Experimental studies demonstrated that current
is initiated by the opening of the inner gate, referred to as activation gating, and is further regulated by smaller structural rearrangements in the SF region.29,37,119,157
In KcsA, activation opening is regulated by intracellular pH, with maximal open probability at acidic pH.62,119,138,140 The proton sensors can be identified in two
glutamate residues at the C-terminus of TM2 (E118 and E120) and a histidine at the N-terminus of TM1 (H25).
Once the inner gate is opened, conformational changes in the SF are responsi-ble for slow inactivation (C-type inactivation) and modal-gating. The single-channel behaviour of KcsA is characterised by very low ``open'' probability (po). Although
inactivation can be coupled to the activation process,42 continuous recordings of
single-channel currents demonstrated a certain degree of independence. Measure-ments under steady-state conditions at maximal activation (pH 3.0) showed very long silent periods (\tau >25s) interrupted by very fast bursts of opening.29,35 Bursts are characterised by three gating modes: high-po, low-po and a high-frequency flicker
mode, all differing in their mean open times (Fig. 1.2). C-type inactivation, fre-quently found in K+ ion channels, is responsible for the long silent periods and
reveals a dependence on the voltage in KcsA, particularly on the inversion of the direction of the current. It is furthermore affected by the extracellular concentration of K+.34--37,66
The overall regulation of the current is thus believe to arise from a complex dynamics among the different states reported in the scheme1.3, which involve tran-sition of the inner gate and subsequent rearrangements of the filter region. Detailed understanding of these fine regulations occurring at the level of the SF remains elusive. In KcsA the conductive state of the SF is intrinsically unstable.28,29,35 A
structure solved in the presence of a low concentration of K+ revealed a constriction
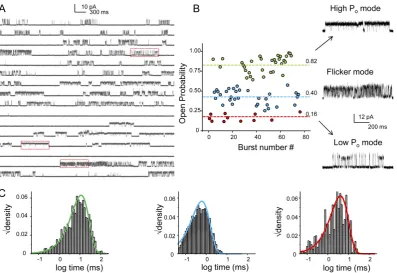
Figure 1.2: Modal behaviour of KcsA. (A) A continuous single-channel recording of KcsA under steady-state conditions at pH 3.0 (maximal activation) with mem-brane potential at +100 mV. (B) the highly variable kinetic behaviour of KcsA
arises from a combination of three distinct modes of channels activity: the low-po,
high-po, and the flicker mode (po is reported as Po in the figure). These modes
occur with random frequency. (C) The open-state lifetimes within the modes are
described by single exponentials. c\bigcirc Chakrapani et al., 2007. Originally published
open mutant channel (tKcsA-OM) showed systematic variations in the structure of the SF associated with the diameter of the intracellular gate, which suggested they provided a mechanism for the C-type inactivation. Within this mechanism, the ex-istence of an intermediate state was suggested in which the K+ pathway is slightly
narrowed by the movements of the glycine residues in position 77 (G77) before the complete collapse of the pore is finally reached. However, this mechanism remains conjectural since a dynamical pathway is still lacking, as well as a detailed descrip-tion of the molecular determinants and evidence of a dynamical equilibrium between active and inactive states once the intracellular gate is opened.35,68 At the same
time, experimental evidence supports the idea that different non-conductive states exist and different hypothesis for C-type inactivation, such as pore dilation, have been proposed as the reason for this.66
Figure 1.3: Scheme of the structural transitions from which the current regulation
is believed to arise in many K+ ion channels. Transitions between conductive and
collapsed structures of the filter (upper and lower) should correspond to C-type
inactivation and recovery from inactivation in single channel records. c\bigcirc Zhou et
al., 2001. Originally published in Nature (doi:10.1038/35102009, licensed content of Nature Publishing Group, license number 3356501082913)
means of current measurements, crystal structure determination, and radioactive flux studies, with the E71A mutant (in which this hydrogen bond cannot exit, Fig.1.4) being resistant to the collapse of the selectivity filter, even at low K+
concentra-tions.29,30,32,35,38Furthermore, dependence of inactivation on voltage was suppressed
by the neutralisation of E71.34Either the breaking or the strengthening of E71--D80
bridge was suggested as being related to C-type inactivation.30,32,34--37 The
muta-tion of E71 with histidine (E71H) generated a non-conductive channel. Molecular dynamics simulations showed the creation in this protein of an hydrogen bond be-tween D80 and H71, which caused a lowering of the backbone distance \mathrm{C}\alpha - \mathrm{C}\alpha
between positions 71 and 80 as well as the disruption of the conductive state. Using this finding as the starting point, Cordero-Morales et al.36 compared inactivation
probabilities of different mutants in position 71, and the backbone distance\mathrm{C}\alpha - \mathrm{C}\alpha
between positions 71 and 80 was found to be directly linked to the inactivation pro-cess. The authors then proposed the strengthening of E71--D80 bridge as a possible cause of the inactivation. The residue E71 and D80 are two acidic residues, and their carboxyl groups are distant\sim 2.6\r A in the putative conductive structure of KcsA.157 The existence of a carboxyl-carboxylate linkage has been widely studied.19,22,24 It is
believed that the two residues share a proton, with a preference for E71.24 A
mech-anism for the lowering of the distance between D80 C\alpha and E71 C\alpha in the wild type
(WT) is still unknown.
Several mutants proved the influence on inactivation process of other residues located in the region behind the SF. Among these, residues R64, Y82 and W67 demonstrated the most dramatic effects:35,37,105 macroscopic currents from rapid
pH jumps showed a sharp reduction of inactivation for R64A and an enhancement of the rate and extent of inactivation for Y82A (Fig. 1.4), while inactivation was suppressed for W67Y. Furthermore, a cooperation between the two neighbouring arginines R64 and R89 was proved to be influencing the inactivation process.105
These results suggest inactivation in K+ channels a result of cooperation among
different residues. In this direction Cordero-Morales et al.37 proposed that C-type
inactivation in KcsA is governed by a multipoint hydrogen-bond network formed by the triad E71-D80-W67. However, fundamental questions remain regarding the molecular determinants on the mechanism, which originate the C-type inactivation, and on the structural definition of the inactive state of the channel.
1.1.2 Permeation
WT
E71A
R64A
Y82A
R64
R89 E71
D80 L81 Y82
W67
R64
R89 A71
D80 L81 Y82
W67
A64
R89 E71
D80 L81 Y82
W67
R64
R89 E71
D80 L81 A82
W67
Figure 1.4: Structures of the region of the selectivity filter in the different proteins
studied in this work: i) wild type (WT, pdb code 1K4C157), ii) E71A, iii) R64A,
the channel axis are able to repel anions while attracting cations and catalyse their dehydration.46,60,64Different lines of evidence suggest that ions and water molecules
in the SF are arranged in a single file, in order to have two or three K+ ions in
the selectivity filter.17,18,44,46,72,107,107,154,156 High resolution X-ray experiments at
high[K+]suggested the four sites S1 to S4 on average are equally occupied. This is consistent with a high permeation rate for K+ ions.154,156
Current experimental techniques are not able to distinguish between the fine details of permeation and selectivity. In consequence, a huge number of theoretical models have been developed for the purpose of trying to catch the complex behaviour of the microscopic current.9,64,101,129 Issues in modelling ion channels originate from
the intrinsic complexity of the systems. These have often been described too simplis-tically for capturing the relationship between structure and function. For example, traditional models consider ions as point charges, water as a continuous dielectric, and protein as a dielectric with rigid walls, although ion size, hydration, and inter-actions with protein are also known to play crucial roles. Thus atomistic models, such as Molecular Dynamics (MD), have been widely used in recent years because of their ability to provide detailed descriptions of the processes involved, often in combination with free energy methods, mainly the so-called Umbrella Sampling (the topic has been reviewed in detail in9,64,101,129,132).
Permeation is believed to occur according to the hypothesis of a ``knock-on'' conduction mechanism, firstly proposed by Hodgkin and Keynes65, in which
an incoming ion ``knocks-on'' the ions already in the SF.18,39,72,107 Based on MD
simulations, Berneche and Roux18 proposed that concerted motions of ions within
the pore are purely diffusive, with barriers contained within 2 and 3 kcal/mol. In any event, the process is not completely clear owing to the inherent complexities associated with inactivation and the conformational flexibility of the pore which make calculations very difficult, as recently reported in a paper of one of the authors of the previously-cited work (see Li, Andersen, and Roux92). Moreover, the occurrence
and the role of vacancies within this mechanism, proposed by Hodgkin and Keynes65
in the same work in which ``knock-on'' was described, is still under debate.54,71,72
1.1.3 Selectivity
Selectivity in potassium ion channels has been the focus for decades of ion-channel research but remains an open question. The ability to select K+ over smaller ions,
especially Na+, is crucial for physiological function. A number of different
hypothe-ses have been proposed (see Andersen7 and reference within) that can be grouped
determined by the entrance rates of the different ion species in the SF; and ii) thermodynamically driven, derived from Mullins108, which is based on the ion-pore
interactions being able to better compensate for the energetic cost of dehydration for K+ than for Na+. The classic textbook explanation is the so-called ``snug fit''
hypothesis and belongs to the latter class: selectivity occurs before the SF because the small Na+ ions are not coordinated as well as the K+ ions within the pore.64
When the microscopic structures of the channels became available these hy-potheses were tested against the dynamical properties of the protein in numerous studies.7,110,130The geometry of the filter is consistent with the ``snug fit'' hypothesis,
since the eight oxygen ligands that constitute the sites are optimally placed to inter-act with a K+ (radius1.33 \r A) more than with the smaller Na+ (radius0.95 \r A).8,43
Some authors proposed alternative mechanisms based on a more flexible interpreta-tion of the filter. The site S2, located at the centre of the pore, was proposed as being responsible for a thermodynamically driven selectivity.18,48,130 Other studies
proposed that the binding of Na+ inside the filter to be not thermodynamically
un-favourable and the existence of different binding sites, called B sites, for Na+, has
been suggested.78,110,135,141 This led to kinetically based hypotheses for selectivity
which occurs before the SF.78,110,141
A coupling between selectivity and gating was proved by experimental studies. Intracellular Na+was found to decrease the open probability of the channel, causing a
slow ``gating effect'' mostly noticeable at high voltages and affecting the K+ current
with a fast block.110,111,141,157 The two effects are believed to occur according to
different mechanisms that have yet to be fully understood.110
Despite the long-lasting research and the available experimental data, the debate is still continuing and a definitive answer for selectivity and its associated processes is not available.
1.2 Aim of the work
Macroscopic current in potassium ion channels arises from a complicated interde-pendence between ions-protein interactions and fine structural rearrangements of the protein which is responsible for complex behaviours of the single-channel cur-rent.28,29Selectivity appears to be coupled with the same mechanisms as those which
underlay current regulation.66,110The understanding of the physiological behaviours
of K+ channels requires the investigation of the atomic resolution dynamics.
in studying ion channels. Molecular dynamics simulations are an excellent tool for this purpose since they are able to deliver a detailed description of the microscopic scales. A wide research on empirical force fields for biological systems79,98and great
developments of the computational resources have permitted a wide application of this method which has been used in many relevant works on ion channels over the last few years.9,64,101,129,132
The success of molecular dynamics simulations lies in the possibility of de-termining free energies, fundamental information to define directions, rates, and the driving forces of biological processes. The advantage with respect to different methods derives from the dynamical nature of molecular dynamics, which allows the explicit consideration of the entropic contribution to free energy, which is es-sential in biological systems. Methods commonly used to compute free energy from molecular dynamics simulations on biological systems take advantage of modified Hamiltonians, which are biased on selected subsets of degrees of freedom. These order parameters, usually referred as collective variables (CVs), are chosen to pro-vide an adequate description of the investigated process. There is no general, simple approach for this selection, which primarily depends on chemical intuition and on the experience of the researchers.86The Boltzmann distribution and free-energy are
then recovered, as a function of the CVs, from the exact knowledge of the bias po-tential added to the original Hamiltonian. The high complexity of the these systems makes free-energy calculations a challenging task. The dimensional reduction de-rived from the projection of the free-energy onto the CVs can be extremely difficult, reflecting the fact that proteins are highly correlated systems having a wide range of time scales involved in their dynamics. This is the case for ion channels. In a recent paper from the B. Roux Group, which has worked for long time in ion channel research, the authors stated:
``However, while MD simulations of K+ channels of ever-increasing
com-plexity are possible, issues of permeation and selectivity are partly ob-scured by the inherent complexities associated with inactivation and con-formational flexibility of the pore.''92
inactivation has been proposed based on conformational changes of the network of residues located behind the selectivity filter of the channel. Finally, these results allowed a more transparent investigations of permeation and selectivity than that provided in previous works, revealing driving forces and mechanisms, by means of the suppression of the conformational equilibria associated with inactivation, which are widely known to obscure similar analysis. From this work one paper was pub-lished,40 while three papers are in preparation.
In Chapter3, in which part of the results published in Cosseddu et al.40 are
Chapter 2
Methods
2.1 Molecular Dynamics
Molecular Dynamics represents the most detailed approach to study complex biomolecular systems. With the availability of empirical force fields able to de-scribe proteins and lipids, molecular dynamics have been used extensively to create realistic atomic models of complex biological systems, including many types of ion channel.129
Molecular dynamics (MD) is the term used to describe the solution of the classical equations of motion (Newton's equations) for a set of molecules2, and it
provides a direct route from the microscopic details of a system to macroscopic properties of experimental interest. It is based on the possibility, within the Born-Oppheneimer approximation, to express the Hamiltonian of the system as a function of the nuclear variables, the motion of the electrons having been averaged out. Given the sets of coordinates\bfitq i and momenta\bfitp i of each moleculei:
\bfitq = (\bfitq 1,\bfitq 2,\bfitq 3, . . . ,\bfitq N) (2.1a) \bfitp = (\bfitp 1,\bfitp 2,\bfitp 3, . . . ,\bfitp N) (2.1b)
the Hamiltonian can be written as a sum of kinetic, \scrK , and potential, \scrV , energy
terms
\scrH (\bfitq ,\bfitp ) =\scrK (\bfitp ) +\scrV (\bfitq ). (2.2)
Usually\scrK take the form
\scrK =
N
\sum
i=1
\sum
\alpha
p2i\alpha
2mi (2.3)
its momentum. The term\scrV is the potential function of the system and contains the
force acting on thei\mathrm{t}\mathrm{h} atom
\bfitf i = - \nabla i\scrV (2.4)
where\nabla i is the gradient operator on the coordinates of thei\mathrm{t}\mathrm{h} atom. For Cartesian
coordinates, Eqs. (2.2) to (2.4) become56
\.
\bfitr i=\bfitp i/mi (2.5a)
\.
\bfitp i= - \nabla i\scrV (2.5b)
where mi and \bfitr i, are the mass and position of the ith atom respectively and the
dot denotes the time derivative. Eqs (2.5) describe a state in the phase space \BbbR 6,
corresponding to 6N equations for a system of N atoms. The trajectories of the
system in the phase space are generated integrating numerically Eq. (2.5), since an analytical solution is not achievable due to the continuous changes in the forces as the particles move.
In common biological simulations Eq.(2.5) is computed for millions of in-tegration steps on many thousands of atoms. Although this might appear as an excessive effort, given the highly correlated nature of the investigated system this is most of the time necessary. For instance, in the case of ion channels, experimen-tal evidence has shown that the filter is directly affected by mutations in remote positions.41 Decreasing the size of the simulated system to bare essentials could in
many cases lead to loss of significance, because many important microscopic factors would be likely altered or even cut off.129 Computations are made more efficient
representing the potential energy \scrV in Eq. (2.5b) using quite simple functions,
in-cluding relatively simple mathematical terms to describe the physical interactions and empirical parameters fitted to accurately reproduce experimental and quantum mechanical energetic data.98 The combination of the functional forms and the
as-sociated parameter set is called a Force Field (FF). The fitting is not trivial and a proper balance between solvent-solvent, solvent-solute, and solute-solute interactions is very important to have the right partitioning of molecules or parts of molecules in different environments. It means making compromises among best fitted parameters in different conditions. Furthermore FF most commonly used in biological simula-tions does not account for the phenomenon of electronic polarization, with the aim of simulate bigger systems for longer times.158 This lack is usually compensated scaling
data.99,158 It is important to note that the potential function incorporates the
great-est assumptions of molecular dynamics,2 and it is fundamental to the success of the
method.
In a real multi-particle system, the term\scrV should be:2
\scrV i=
\sum
i
v1(\bfitr i) +
\sum
i
\sum
j>i
v2(\bfitr i,\bfitr j) +
\sum i \sum j>i \sum k>j>i
v3(\bfitr i,\bfitr j,\bfitr k) +. . . (2.6)
wherev1(\bfitr i) represents the effect of an external field and vn (n= 2,3, . . .) are the
potential terms between pairs, triplets, etc. The pair potential is the most important, and in the practical implementation of molecular dynamics pairwise approximation is used defining an effective pair potential in which the upper terms are, in principle, included as ensemble averages. Then Eq.(2.6) is rewritten in the form:
\scrV i \approx
\sum
i
v1(\bfitr i) +
\sum
i
\sum
j>i
v2\mathrm{e}ff(r) (2.7)
where r = rij = | \bfitr i - \bfitr j| . The presence of any external field is usually neglected,
although electric fields have been considered in modeling ion channels. However their implementation is not always straightforward and the effect of the finite sizes of the system is still under debate.127 For molecular systems, intramolecular potential
terms are added to model the geometries that are generally referred as ``bonded interactions''.
Several different force fields and set of parameters have been developed over the past years. The most known and used for biological systems are CHARMM, AMBER, GROMOS and OPLS. The calculation of the present work were performed employing all-atom CHARMM force field.79,99,100 The intramolecular potential
in-cludes terms for bond stretching, angle bending, Urey-Bradley 1,3 interaction, tor-sional rotation, and out-of-plane (improper) motion and has the form
V\mathrm{b}\mathrm{o}\mathrm{n}\mathrm{d}\mathrm{e}\mathrm{d}(r) =
\sum
bonds
Kb(b - b0)2+
\sum
angles
K\theta (\theta - \theta 0)2+
\sum
U rey - Bradley
Ku(u - u0)2+
\sum
dihedrals
K\phi [1 +cos(n\phi - \phi 0)]+
\sum
impropers
K\psi (\psi - \psi 0)2
(2.8)
whereKb, K\theta , Ku, K\phi and K\psi are the bond, bond angle, Urey- Bradley, dihedral
angle, and improper dihedral angle force constants, respectively; b, \theta , u, \phi and \psi
and improper dihedral angle, respectively, with the subscript zero representing the equilibrium values for the individual terms. The Urey-Bradley term is a harmonic term in the distance between atoms that are bonded to a common third atom of some of the angle terms important for the in-plane deformations as well as separating symmetric and asymmetric bond stretching modes.100
Pairwise potential, usually referred as ``non-bonded'' because it is computed between atoms that are not covalently bonded, assumes the form
V(r) =\sum
i,j
4\epsilon ij
\Biggl[ \biggl(
\sigma ij
rij
\biggr) 12 -
\biggl(
\sigma ij
rij
\biggr) 6\Biggr]
+\sum
i,j
qiqj
\epsilon Drij (2.9)
where i, j are non-bonded pairs and qi, qj are their charges. Non-bonded,
non-electrostatic Van der Waals forces are represented by a Lennard-Jones 12-6, in which the first term represents repulsions due to the Pauli principle and the second attrac-tions due to small instantaneous dipoles generated by the electronic moattrac-tions. It is characterised by a minimum of depth \epsilon , where the two terms are balanced, and
the curve crosses the x-axis when the distance is \sigma . The final term of Eq. (2.9)
represents the coulumbic interactions. Consistent with CHARMM parametrisation, non-bonded interactions have been computed also for the atoms within the same molecules, excluding the bonded atoms and all pairs of atoms that are bonded to a common third atom. In this work grid-based correction CMAP was used, which improves distributions of the dihedral angles of the protein backbone.25
Boundary conditions are crucial to overcome the problem of surface effects that arises in the small simulated systems. Periodic boundary conditions were used in this work, and they are also the most commonly used in molecular dynamics. The system is virtually replicated in the three dimensions to create an infinite lattice of identical cells, and each atom interacts, according to the force field, with all other atom in this infinite periodic lattice, those in the box and their replica, included his own copy.53 There is, in principle, an infinite number of terms. To avoid this, the
minimum image convention is used: each atom lies in the centre of a region of the same size and shape as the basic simulation box, and it can directly interact only the atoms inside this region. On top of this, cutoffs on Van der Waals forces are employed to reduce the amount of computation.
Solution of the Hamiltonian equations The Hamiltonian equations are solved by a step-by-step procedure. The most used methods of integration are the Verlet-style algorithms.53They are simple, allow to use large time step and give a very good
Verlet
\bfitr (t+\delta t) =\bfitr (t) +\bfv (t)\delta t+1 2\bfita (t)\delta t
2 (2.10a)
\bfv (t+\delta t) =\bfv (t) +1
2[\bfita (t) +\bfita (t+\delta t)]\delta t. (2.10b) with \bfitr , \bfv , \bfita the sets of Cartesian coordinates, velocities and accelerations. The
algorithm implemented to advance the configuration of the system over a time-step
\delta tis the following:
\bfv (t+1
2\delta t) =\bfv (t) + 1
2\bfita (t)\delta t (2.11a)
\bfitr (t+\delta t) =\bfitr (t) +\bfv (t+1
2\delta t)\delta t (2.11b)
\bfita (t+\delta t) = - \nabla \scrV (\bfitr (t+\delta t))
m (2.11c)
\bfv (t+\delta t) =\bfv (t+1 2\delta t) +
1
2\bfita (t+\delta t)\delta t. (2.11d)
2.2 Free energies Methods
2.2.1 Free energies and MD
MD simulations are based on performing a sampling on a statistical ensemble such as microcanonical (NVE), canonical (NVT), or isothermal-isobaric (NpT). Free en-ergies are equilibrium properties and they can be retrieved by applying statistical-mechanics equations. Free energies related to a process of interest are conveniently defined with respect to a small subset of n degrees of freedom, generally referred
as collective variables, CVs. They can be easily defined as functions of the Carte-sian coordinates of the N atoms of the system S(\bfitr ) = (S1(\bfitr ), S2(\bfitr ), . . . , Sn(\bfitr )), \bfitr = (xj, yj, zj) with 0 < j < N. This dimensional reduction is crucial to allow
any understanding of events that involve a large number of atoms. CVs are usually selected to be representative of a given process, and typical examples are distances, angles, coordination numbers, etc. Let's define the potential energy\scrV (\bfitr ),\beta = 1/kBT
where kB and T are respectively Boltzmann's constant and the temperature, and
\delta s =\delta (S(\bfitr ) - \bfits ) is the bin in the the histogram of the CVs for the ndimensional
vector of values(s1, . . . , sn). Following Roux126, at equilibrium the probability
dis-tribution function (pdf ) of the CVs is, according to the Boltzmann disdis-tribution,
\scrP (S) =\langle \delta s\rangle =
\int
d\bfitr e - \beta \scrH (\bfitr )\delta
s
\int
where\int
d\bfitr e - \beta \scrH (\bfitr )is the partition function of the system. This probability is clearly
equal to one on the space of the CVs,
\int
ds\scrP (s) = 1. (2.13)
From statistical mechanics, the free energy,G, can be written as function ofS, within
an immaterial constantC86
G(S) = - kBT \mathrm{l}\mathrm{n} (\scrP (S)) +C. (2.14)
From the definition of MD and within the assumption of ergodicity, the pdf in Eq. (2.12) is retrieved from the histogram of the CVs13
N(S, t) =
\int t
0
dt\prime \delta \bigl(
S(\bfitr , t\prime ) - \bfits \bigr)
(2.15)
in the limit of a complete sampling
\scrP (S) = \mathrm{l}\mathrm{i}\mathrm{m}
t\rightarrow \infty
N(S, t)
\int
ds N(s, t). (2.16)
In big systems, especially in the biological ones, it is very difficult to ob-tain a good convergence of Eq. (2.16), due to limits of computational resources. As mentioned in previous sections, MD requires significant computational efforts, which become unrealistic when dealing with very complex free energy landscapes, characterised by large barriers.86 To overcome these limitations, several methods to
perform non-Boltzmann sampling have been developed.
2.2.2 Umbrella sampling
Umbrella sampling is probably the most known of among the non-Boltzmann sam-pling methods. It belongs to a category of method where the MD is performed on modified Hamiltonians where an extra potential energy term\scrW (S) is added to bias the calculation
\scrH \ast (\bfitr ,\bfitp ) =\scrK (\bfitp ) +\scrV i(\bfitr ) +\scrW (S(\bfitr )). (2.17)
Thus this class of methods are generally referred as biased simulations.
most common choice is to use harmonic bias potentials, that, for the case of a single CV, takes the form of
\scrW i(S) = 1
2K(S(\bfitr ) - si)
2 (2.18)
where si are the centres of the different n windows.126 The different pieces of the
FES obtained from the different calculations are finally combined to obtained the FES over the whole range of interest ofS(\bfitr ).
Following Eq. (2.12), the biased distribution for the single window is
\scrP \scrW i(S) =
\int
d\bfitr e - \beta \scrV (\bfitr )e - \beta \scrW i(S)\delta
s
\int
d\bfitr e - \beta \scrV (\bfitr )e - \beta \scrW i(S)
= e
- \beta \scrW i(S)\scrP (S) \int
d\bfitr e - \beta \scrW i(S).
(2.19)
From Eq. (2.14), the free-energy can be written126
G(S) = - kBT \mathrm{l}\mathrm{n} (\scrP \scrW (S)) - \scrW (S) +F (2.20) whereF = \int
d\bfitr e - \beta \scrW i(S)+C is an unknown constant. The absolute value of this
constant is not required for practical purposes, but it is adjusted at the moment of the reconstruction of the FES for the whole range of interest.
In general the unbiasing procedure granted by Eq. (2.20) is made difficult by many statistical errors, mainly in the overlapping region between two windows.126
Different methods have been proposed to solve the equation
\scrP (S) =
n
\sum
i=1
\scrC i(S)\scrP i(S) (2.21)
were \scrC i(S) is the appropriate weight of the unbiased distributions \scrP i(S) computed
for thei-th window. Weighted histogram analysis method (WHAM), first proposed
by Kumar et al.82, is one of the most in use and it was employed in this work via
the implementation by.Grossfield58 The complete description of the method is out
of the scope of this work (see Roux126 and references therein for details).
2.2.3 Metadynamics
Metadynamics (metaD) is a computational method that can be used either to re-construct free energy surfaces (FES) or to force the system to escape from energy minima.13,86--88,137 It is based on a bias history-dependent potential created as a
as a self-learning adaptive umbrella sampling because previous extensive knowledge of the investigated process is not strictly required, adapting the bias potential to the underlying free-energy. Several implementations of the metaD algorithm have been successfully used in the past. In the present paper, we used the so-called well-tempered metaD for the productive runs which allow a better convergence to the true free energies, and the both well-tempered and standard implementations for the preliminary test calculations.
The biasing potential for metaD, with respect of the previously defined set of CVsS= (S1(\bfitr ), S2(\bfitr ), . . . , Sn(\bfitr )), is given by
\scrV \mathrm{B}(S) =
\sum
t\prime =\tau
\mathrm{G},2\tau \mathrm{G},...
w
n
\prod
i=1
e
\left(
- (Si(\bfitr i) - Si(\bfitr i, t \prime ))2
2\sigma 2
\right)
(2.22)
wherewis the Gaussian height,\tau \mathrm{G}is the time interval between the deposition of the
Gaussians, 2\sigma the Gaussian width along the each CV.87 For well-tempered metaD
the heightwis history-dependent as well
w=w0e
\scrV \mathrm{B}(S, t)
kB\Delta T (2.23)
wherew0 is the initial Gaussian height and \Delta T a parameter with the dimension of
a temperature.13 In this case the biasing potential generates a flat distribution, the
FES can be easily retrieved from the biased potential for standard implementation of metaD
G(S) = - \scrV \mathrm{B}(S) (2.24)
or via a scaling factor in well-tempered metaD
G(S) = - T + \Delta T
\Delta T \scrV \mathrm{B}(S). (2.25)
In well-tempered metaD the scaling factor in Eq. (2.23) theoretically guarantees the convergence to the real free energy. The functionG(S) is often referred as potential of mean force, PMF, and we will use the term as synonymous of FES.
2.2.4 MetaD parameters
Free-energy surfaces computed via biased methods derives from the projections of the full distribution function for the system onto the reduced set ofnCVs,S, via
with appropriate weights. However a particular care is required to obtain meaningful distributions, that, in the practice, can be very challenging. As in any biased method, the choice of CVs is crucial for a good implementation of metaD and it would ideally be the smaller possible set of CVs which are able to deliver the best description of the process under investigation. There are also practical difficulties in the calculation, because an optimal sampling of the CVs is obtained for the bias potential's slow growths, in the limit of w/\tau \mathrm{G} \rightarrow 0.87,88 In the practical implementation of the
method this limit cannot be reached and, as a result, there is a risk of overfilling some minima by generating hysteresis. This issue are alleviated by the use of history-dependent heights of the Gaussians as implemented in well-tempered metaD and can be solved explicitly considering within the set of CVs, and thereby bias, the degrees of freedom that most contribute in generating similar effects.86,88
The success of the free energy reconstruction in well-tempered metaD relies on the parameters i) \Delta T and ii) \omega = w0/\tau \mathrm{G}, the initial deposition rate.13 A fine
choice of\Delta T allows both a quicker convergence and a confinement within a relevant
region of the CVs space. It is worth noting that although important from a practical perspective, the computed FES will eventually converge to the real one irrespective of the particular choice of\Delta T.13 Initial deposition rate\omega =w0/\tau \mathrm{G}affects relaxation
over the orthogonal degrees of freedom.13 The choice of w0 was not trivial in our
case and, as will be discussed in details in Chap. 6, low values (0.005 Kcal/mol) produced the best outcome resulting in a smoother filling of the biasing potential. The deposition times (\tau \mathrm{G}) was selected 400 fs for the one dimensional calculations
and 200 fs for multidimensional, but these different choices did not appear to affect the final results.
2.3 Simulation set up
The simulations presented in this work were performed using NAMD 2.8 and NAMD 2.9120 in the NpT ensemble with pressure 1.01 bar (Langevin piston implemented
via Nose-Hoover method120), temperature 310 K (Langevin thermostat120) and
electrostatic forces were computed using the smooth particle-mesh Ewald method (SPME).49 Metadyanamics calculations were performed using the built-in ``colvar''
module.50 A multiple-timestep algorithm was used59,145 and different integration
steps according to the scope of the simulations:
\bullet 1 fs for unbiased simulations, bonded interactions computed every time step,
\bullet 2 fs for biased simulations, bonded and non-bonded non-electrostatic forces
computed every time step and electrostatic forces computed every 3 time step;
Using longer integration steps (2 fs) is a common choice for biased simulations, since it allows longer sampling18,20,36,54,78,92,131,131 The CHARMM27 force field (FF) was
used for the protein, with a modification in the Lennard-Jones term to represent the interaction between K+ and the carbonyl oxygens of the protein, CHARMM36 for
the lipids and TIP3P for water.79,99,112
2.3.1 Embedding protein in the membrane
The system was prepared from the X-ray structure of KcsA solved at 2 \r A res-olution.157 The protein conformation is widely considered as a closed conductive
state, i.e. the inner gate is closed, while the SF is in a conductive conformation. The single monomer reported in the original file obtained from the protein data bank (pdb code 1K4C) was replicated according to the transformation matrix pro-vided by the authors to create the tetramer and embedded in a membrane patch of 1-palmitoyl-2-oleoylphosphatidylcholin (POPC) using the VMD 1.8.6 membrane plug-in, modified in order to work with CHARMM36 (Fig. 2.1). Two K+ ions
were placed in the SF and one K+ in the cavity. The system was solvated
in-serting the protein into a pre-equilibrated water box with VMD solvate plug-in. To avoid the creation of unphysical gaps close to the protein surface, this step had been preceded by a preliminary salvation using the Solvate program by Grub-m\"uller (www.mpibpc.mpg.de/home/grubmueller/downloads/solvate), which cre-ates an irregularly-shaped solvent volume around the protein according to steric cri-teria. Many water molecules inside the cavity were not resolved by the X-ray experi-ments, and have been inserted using the DOWSER program.152The missing
param-eters for K+ necessary for DOWSER have been taken from the GROMOS87 FF for
consistency.115 MD free energy sampling, and quantum mechanical/molecular
me-chanical (QM/MM) calculations suggest that, in the conductive state, the E71/D80 pair are linked by an hydrogen bond (H-bond) where one residue is ionised, and the proton exchanges with a preference for E71.19,24 Consistent with conventional MD
force fields, this has been mimicked in this work by assigning the proton to E71 in every protein where E71-D80 bridge is present (WT, R64A, Y82A). R52, R64, R89 were modelled as protonated, and E51 as deprotonated, as appropriate for a pH range 4--8.29,35,157The potassium concentration in the aqueous phase was 0.2 M,
equal to bulk concentration used in many experiments.29,34--36,46,157
Figure 2.1: Simulated protein, prepared from the X-ray structure of KcsA solved
at 2 \r A resolution (pdb code 1K4C, 6284 atoms),157 embedded in a membrane
patch of 1-palmitoyl-2-oleoylphosphatidylcholin (POPC, 222 molecules and 29748
atoms), solvated by 17740 water molecules (53220 atoms), with 75 Cl - ions and 63
K+ ions. The final size of the system was\approx 95\times 95\times 100\r A and the total number
of atoms was 89390. The different sizes of the atoms in the figure are chosen only for visualisation purposes and do not have any physical meaning, while the colours are chosen as follow: i) a different colour is used for each protein domain; ii) lipid
tails are in green; iii) lipid heads in red; iv) K+ions in purple; v) Cl - ions in grey;
vi) water molecules are in red (oxygen atoms) and white (hydrogen atoms).
MD simulation in which the protein, water, ions and lipids headgroups were frozen; this ensured melting of the lipid tails. (ii) A further 2 ns MD simulation in which the protein (only) was restrained with harmonic tethers. (iii) A 1 ns MD simulation in which all atoms were unrestrained.
2.4 General analysis
2.4.1 Order parameters or Collective variables
(D80) plays a key role. Consequently several analyses have been focused on the rearrangements of D80 with respect of its neighbouring residues. Few sets of order parameters which will be used throughout the text are defined below.
The first set corresponds to distances between D80 side chain, defined by C\gamma
atom (the carbon of the carboxyl group), and an atom used to describe a second residue's side chain. The distances are simply labelled by ``d'', appending the position of the second residue, i.e. d71 is the distance between D80 and E71 side chains. The following residues have been considered as second residues: (i) E71 (``d71''), its side chain defined by the H-bond donor oxygen belonging to the carboxyl group; (ii) arginines R64 (``d64'') and (iii) R89 (``d89''), their side chains defined by the carbon atoms of the guanidino group (C\zeta ); and (iv) W67 (``d67''), its side chain defined by
the H-bond donor N\epsilon 1.
A second set defines distances between D80 side chain and the backbone C\alpha
atom of a second residue and they are labelled by appending ``CA''. In this case two residues have been considered as second residues, the residue in position 71, glutamic acid for WT, Y82A, R64A and alanine for E71A (``d71CA'') ; ii) the alanine in position 73 (``d73CA''). The distance between D80 and E71 C\alpha atoms is named
``E71CA-D80CA''.
A third set corresponds to distances from the SF of the side chains of relevant residues. Again the side chains are defined by representative atoms, and the SF by the center of mass (COM) of the C, N, C\alpha atoms of the residues in position 74 to
78 of each subunit. These distances are labelled by ``C'' followed by the number of the considered residue, i.e. C64 and C89 are, respectively, the distance from the SF COM of the C\zeta atoms of the arginines in position 64 and 89.
A forth set defines dihedral angles of different residues. Their names are formed by appending the position of the residue in the sequence to the name of the Greek letter that defines the dihedral within the residue itself, ignoring incremental numbers if exists. For instance \chi 1 dihedral angle of residue L81 is labelled chi81,
psiof residue V76 is psi76.
Labels for the ions bound to the SF and in the cavity are formed by the symbol of the element and an increasing number starting from the outermost in the SF, i.e. two K+ ions in the SF and one in the cavity are labelled respectively K1,
2.4.2 Projection of the computed FES onto lower dimensional sur-faces
In this work, the computed FES have been projected into lower dimensional surfaces in several cases. The projections onto a subset of the CVs, A\subset S, were computed
from the unbiased distribution, integrating over the j CVs that does not belong to A,S - A:
G(A) =
\int
Sk\in S - A
\mathrm{d}Ske
- G(Si)
kbT (2.26)
where the terms G(Si) were obtained via Eq. (2.25) for Si \in S. Eq. (2.26) was
implemented using R language.122
2.4.3 Statistical analysis
The statistical analysis were performed using R language and vmd 1.9.67,122 Several
packages for R were used in addition to the core functions: bio3d, ggplot2, car, fields.1,52,55,57,148 Many functions and packages have been written both for R and
Chapter 3
Dynamics of the ions and
free-energy calculations
KscA is a potassium ion channel from Streptomyces lividans bacteria, which has an amino acid sequence closely similar to that of vertebrate and invertebrate voltage-dependent potassium channels46. The detailed molecular structure of KcsA has
been known since 199846. Since that time it has been actively studied through the
use of molecular dynamics (MD) simulations for verifying and testing a variety of hypotheses related to the conductivity and selectivity of the channel. The extremely high dimensions of the corresponding model (see Sec.2.1) represents one of the most difficult aspects in the analysis.27,144
A MD model is a Hamiltonian, non-linear, high-dimensional, dynamical sys-tem which typically shows multi-scale behaviour in both space and time. A direct way to reduce the dimension is to assume ergodicity and mixing in the systems, that is to consider Brownian Dynamics model. These assumptions allow each atom to be considered as a particle moving in some potential under the action of a stochastic source, resulting in a low-dimensional dissipative stochastic non-linear system. Thus, a simple way to think of the permeation of ions through the channel is by focusing on the properties of a selected part of the system: the permeating ions. In this way the ions can be described by a generalised Langevin Equation (GLE) of the form80:
mi\bfv \.i(t) = -
\partial G(\bfr i)
\partial \bfr i
- \int t
0
\bfM (t - \tau )\bfv i(\tau )d\tau +\bfR (t), (3.1)
where\bfv i is the ion's velocity (\bfv i=\bfp i/mi);G(\bfr i) is the so-called potential of mean
via the second fluctuation-dissipation theorem:
\bfM (t) = 1
kBT
\langle \bfR (0)\bfR (t)\rangle . (3.2)
The picture is typically further simplified by making the assumption that ionic motion corresponds to overdamped Markovian diffusion17,126, resulting in the
overdamped Langevin equation123
\.
\bfr i= -
1
mi\gamma (\bfr i)
\partial G(\bfr i)
\partial \bfr i
+
\sqrt{}
2kBT
mi\gamma (\bfr i)
\bfitxi (t), (3.3)
where\gamma (\bfr i)specifies the damping and\bfitxi (t) = (\xi x(t), \xi y(t), \xi z(t))is a vector of
Gaus-sian white noises. The parameter \gamma can be calculated from the diffusion coefficient D, if known, using the relation D = kBT /\gamma . Diffusion coefficients can sometimes
be estimated experimentally, otherwise from coordinate and velocity time-series (see Mamonov et al.103 for details).
Within this framework the identification of G(\bfr i) is a key task, since it is
determinant in the definition of the process. However, this identification is gener-ally very complicated. It is possible to retrieveG(\bfr i) in Eq. (3.3) directly from the
MD trajectories (see Sec.2.2and126). This is extremely expensive in computational
resources and in many cases unachievable. Therefore, common techniques for calcu-lating free-energies are based on the introduction of a known additional deterministic term in the Hamiltonian\scrH (Eq. (2.2)) for a subset of degrees of freedom of the system
S, generally referred to as ``order parameters'' or ``collective variables'' (CVs), which
are defined as functions of \bfr i. This additional force enables the retrieval of the
theoretically true Boltzmann distribution forS(\bfr i)from a non-Boltzmann sampling
thus reducing the computational efforts.126 The most frequently-applied technique
is the so-called Umbrella Sampling (US) method (Sec.2.2.2), which has been widely used to investigate ion channel properties.18,20,54,78,121,126,131 However the
assump-tion that the diffusion process can be fully described by an overdamped equaassump-tion (3.3) instead of a GLE (3.1) must be validated. This can be achieved by means of time-series analysis of the trajectories obtained from MD simulations. Additionally this analysis would provide more general information on dynamical and statistical properties of the system, and in particular of the ions in channels.
analysing the statistical and dynamic properties of the system. Moreover, statistical errors derived from the MD approach are investigated. The results presented here are published in Cosseddu, Khovanov, Allen, Rodger, Luchinsky, and McClintock40.
3.1 Methods
A set of MD simulations was performed. The dynamics of the ions were analysed, in particular in the the three sites S2, S1 and S0. Two configurations were selected for MD simulations. One of these was C1 with two K+ ions in the cavity, a water
molecule in S4, a K+ in S3, a water molecule in S2 and an K+ in S1. The other
configuration, referred to as C2, corresponded to a K+ in S4, a water molecule in
S3, a K+ in S2, a water molecule in S1, and a K+ in S0.
The coordinates\bfr = (x, y, z)calculated relative to the centre of mass (COM) of the selectivity filter (referred to as CVs, units of \r A ), and corresponding velocities
\bfv = (vx, vy, vz) (in units \r A/ps) were stored for each integration step of 1 fs for
different atoms. These atoms included: K+ ions and water molecules inside the
selectivity filter, K+ ions in the cavity and in the bulk, as well as the oxygen atoms
of the binding sites. A typical realisation consisted of106 time steps (1 ns). During the simulations the lipids of the membrane were not constrained and the simulated piece of membrane slowly moved together with the channel protein. The centring on the CVs was applied to compensate for this slow motion, and the COM of the selectivity filter was defined as the backbone atoms of residues between 74 to 79 of the four subunits. It should be noted that slow time-scales of longer than about105 ps were automatically removed from consideration.
3.2 Analysis of equilibrium dynamics
Atomic motions are assumed to be realisations of a stochastic process. The latter are characterised by the probability density functions (distributions) of positions and velocities\scrP (\bfr ) and \scrP (\bfv ), as well as by the power spectrumP(f) and/or the auto-correlation coefficient \rho (\tau ) of the coordinates' or velocities' projections onto one of the Cartesian axesx,y or z, for the correlation time \tau .15 The resultant time-scales