University of Warwick institutional repository:http://go.warwick.ac.uk/wrap
A Thesis Submitted for the Degree of PhD at the University of Warwick
http://go.warwick.ac.uk/wrap/77511
This thesis is made available online and is protected by original copyright. Please scroll down to view the document itself.
METFORMIN IN
GESTATIONAL DIABETES MELLITUS
By
DR MAY OO KHIN
A thesis submitted to
The Faculty of Medicine
of the University of Warwick
for the degree of
DOCTOR OF PHILOSOPHY
Translational and Systems Medicine
Metabolic and Vascular Health
Warwick Medical School
University of Warwick
United Kingdom
CONTENTS
Table of contents i
List of figures vi
List of tables ix
List of abbreviations xii
Dedication xvii
Acknowledgements xviii
Declaration xix
Summary xx
Chapter 1: Introduction
1.1 Gestational Diabetes Mellitus (GDM) 2
1.1.1 Epidemiology 2
1.2.1.1 Risk factors 2
1.2.1.2 GDM and Ethnicity 3
1.2.1.3 Prevalence of GDM 4
1.1.2 Consequences of GDM 6
1.1.3 Pathogenesis of GDM 10
1.1.4 Current Management of GDM 12
1.2 Metformin 14
1.2.1 Metformin in Pregnancy 14
1.2.2 Recognized risk of metformin 18
1.2.3 Mechanism of metformin action 18
1.2.3.1 Molecular mechanisms of action of metformin 19 1.2.4 Metformin and reduced Vitamin B12 levels 23
1.3 Micronutrients in Pregnancy 26
1.3.1 Vitamin B12 26
1.3.1.1 Digestion, Absorption and Transport of Vitamin B12 27
1.3.2 Folic acid 29
1.3.4 Transgenerational impact of vitamin B12 deficiency 35 1.3.5 Impact of Low Vitamin B12 High Folates conditions 36 1.3.6 Vitamin B12 deficiency and Insulin Resistance 37
in clinical studies
1.3.7 Vitamin B12 deficiency and Lipid metabolism 38
1.4 Lipid Metabolism 41
1.4.1 Transport of Lipids in the body 41
1.4.2 Role of liver in lipid metabolism 44
1.4.2.1 Liposynthesis, de novo lipogenesis and VLDL assembly 44 and secretion
1.4.2.2 Lipid Transport 49
1.4.2.3 Lipid oxidation 49
1.4.2.4 Hepatic glucose output 50
1.4.2.5 Insulin signaling 51
1.5 Thesis Aims 53
Chapter 2: Evaluation of Metformin in GDM: Systematic Review and Meta-analysis
3.1 Introduction 56
3.2 Methodology 57
3.2.1 Criteria for considering studies for the review 58 3.2.2 Search methods and identification of studies 62
3.2.3 Data extraction and analysis 65
3.2.4 Data synthesis 67
3.3 Results 68
3.3.1 Metformin vs Insulin 71
3.3.2 Metformin vs Glibenclamide 111
3.3.3 Metformin vs Diet 120
3.3.4 Metformin success vs Metformin failure 126
3.4 Discussion 133
3.2 Study population 145
3.3 Data collection 147
3.4 Statistical analysis 147
3.5 Data presentation 148
3.6 Definition of clinical terms used 148
Chapter 4: Predictors of metformin failure in GDM
4.1 Introduction 155
4.2 Methods 157
4.2.1 Study population and data collection 157
4.2.2 Statistical analysis 158
5.2.2.1 Questions being addressed 158
4.3 Results 161
4.3.1 Characteristics of GDM women included 161 4.3.2 Metformin monotherapy vs Metformin failure 162 4.3.2.1 Maternal baseline characteristics of GDM women with 162
metformin monotherapy and metformin failure
4.3.2.2 Pregnancy outcomes of GDM women with metformin 164 monotherapy and metformin failure
4.3.2.3 Predictors of metformin failure in GDM women 166 4.3.2.4 Pregnancy outcomes of GDM women with metformin 169
failure and insulin alone therapy
4.4 Discussion 171
Chapter 5: Maternal Vitamin B12, Folate and Homocysteine as Determinants of Glycemia and Birthweight in GDM
5.1 Introduction 179
5.2 Methods 182
5.2.1 Study population and data collection 182
5.2.2 Sample size calculation 184
5.2.3 Statistical analysis 184
5.3 Results 186 5.3.1 Demographic characteristics of GDM mothers and babies 187 5.3.2 Relation between serum folate, vitamin B12, their ratio and 189
glucose levels
5.3.3 Relation between serum folate, vitamin B12, their ratio and 193 birth weight
5.4 Discussion 198
Chapter 6: Role of vitamin B12 deficiency on Lipid Metabolism and Metformin action in Liver
6.1 Introduction 205
6.2 Methods 208
6.2.1 Materials 208
6.2.2 HepG2 purchase, culture and freezing 208
6.2.3 Experimental steps 209
6.2.3.1 Experimental treatment of HepG2 cells with 209 different concentration of vitamin B12
6.2.3.2 Protein and RNA extraction 211
6.2.3.3 Protein Quantification 211
6.2.3.4 Western blotting 212
6.2.3.5 RNA extraction, isolation and quantification 217 6.2.3.6 Quantitative Real-Time Polymerase Chain Reaction 219
(qRT-PCR)
6.2.3.7 Statistical analysis 219
6.3 Results 220
6.3.1 Lipogenic genes were down-regulated by vitamin B12 220 supplementation in hepatocyte cell line culture in long-term
low vitamin B12 (0nM) media
6.3.2 Vitamin B12 supplementation increased insulin signaling 224 in hepatocyte cell line
6.3.3 There was no change in the phosphorylation of AMPK and 227 ACC with vitamin B12 supplemenation but the protein levels
6.3.4 Phosphorylation of AMPK and ACC enzymes induced by 231 metformin was increased in vitamin B12 supplemented
culture compared to low vitamin B12 culture (0nM)
6.3.5 Down-regulation of lipogenic enzymes by vitamin B12 239 supplementation was blocked with anti-methylating agent,
5-azacytidine (AZT)
6.4 Discussion 242
Chapter 7: Thesis summary and Conclusions
7.1 Overview 252
7.2 Systematic review of metformin in GDM 253
7.3 Predictors of metformin failure in GDM 255
7.4 Role of vitamin B12 and folates in GDM 257
7.5 Vitamin B12 deficiency on Lipid metabolism and Metformin in Liver 259
7.6 Overall conclusions 261
8.0 Lists of abstracts and presentations 263
9.0 Appendices
9.1 Systematic Review 265
9.1.1 Search Strategy 265
9.1.2 Data Proforma Sheet 271
9.1.3 Risk of Bias tools 284
9.1.4 Characteristics of conference proceedings and ongoing trials 292
9.1.5 Confounders proforma tables 298
9.2 Clinical Studies
9.2.1. Data Proforma Sheet 300
9.3 Laboratory Study
9.3.1. Solutions and Buffers 303
List of Figures
Chapter 1
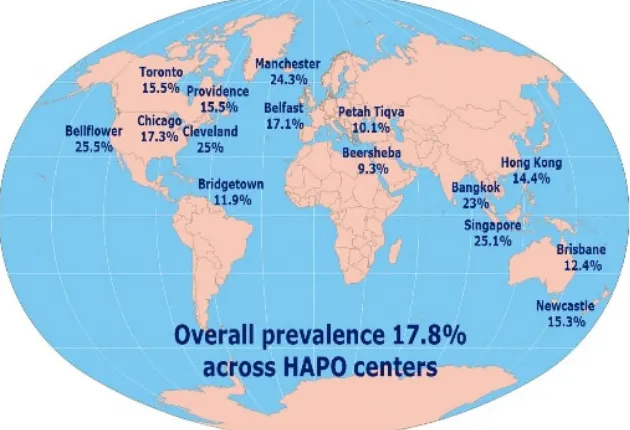
Figure 1.1. Prevalences of GDM by IADPSG criteria in 5 15 different countries
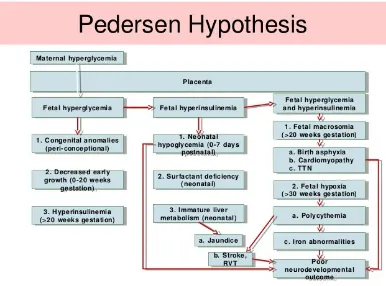
Figure 1.2. Pedersen Hypothesis on consequences of hyperglycaemia 6 during pregnancy
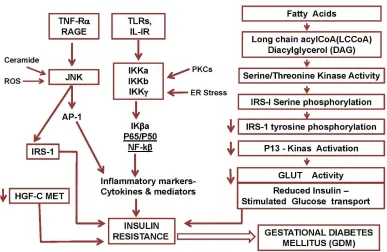
Figure 1.3. Inflammatory cytokines and insulin resistance in GDM 10
Figure 1.4. Mechanism of metformin action 19
Figure 1.5. Overview of vitamin B12 digestion, absorption and transport 28 Figure 1.6. Model of vitamin B12 deficiency on cellular insulin resistance 32 Figure 1.7. Overview of Lipid Transport in the body 43 Figure 1.8. An illustrative model of hepatic glycolytic and lipid pathways 45 Figure 1.9. An illustration of how SREBPs are released from 47
endoplasmic reticulum
Figure 1.10. An overview of PhD thesis 54
Chapter 2
Figure 2.1. PRISMA flow chart of study selection 64
Comparison 1: Metformin vs Insulin
Comparison 2: Metformin vs Glibenclamide
Figure 2.10. Forest plots of Important Neonatal Outcomes 118 Figure 2.11. Forest plots of Important Maternal Outcomes 119
Comparison 3: Metformin vs Diet alone
Figure 2.12. Forest plots of Neonatal Outcomes 125
Comparison 4: Metformin monotherapy vs Metformin Failure
Figure 2.13. Forest plots of Pregnancy Outcomes 132
Chapter 3
Chapter 4
Figure 4.1. An overview of selection of GDM women included 161 Figure 4.2. Receiver Operator Curve of potential predictors of 167
metformin failure
Chapter 5
Figure 5.1. An overview of selection of GDM women included 186 Figure 5.2. Scatterplot of Relationship between Folates and 191
Fasting Glucose at mid-pregnancy
Figure 5.3. Scatterplot of Relationship between Folates and 191 Fasting Glucose at Post-Partum
Figure 5.4. Scatterplots of homocysteine, vitamin B12 and folates vs 194 centiles and birth weight
Figure 5.5. Differences in mean total homocysteine levels between 197 Appropriate for Gestational Age (AGA) and
Chapter 6
Figure 6.1. Effects of long-term Vitamin B12 supplementation on 221 mRNA expression of lipogenic genes and their
regulatory transcription factors in hepatocytes
Figure 6.2. Effects of long-term Vitamin B12 supplementation 225 on protein expression levels of pAkt (Ser473) and
GSK3α/β(Ser21/9) in hepatocytes
Figure 6.3. Effects of long-term Vitamin B12 supplementation 228 on protein expression levels of pAMPK(Thr172) and
pACCα(Ser79) in hepatocytes
Figure 6.4. Effects of metformin on protein expression levels of 233 pAMPK(Thr172) and pACCα(Ser79) as well as
gene expression levels of lipogenic enzymes and their regulatory transcription factors
List of Tables
Chapter 1
Table 1.1. Risk Factors of GDM 3
Table 1.2. Daily requirement of folic acid in different age groups 29 Table 1.3. Classification of Lipoprotein in Human Plasma 42
Chapter 2
Table 2.1. Initial search terms used 62
Table 2.2. Criteria for diagnosis of GDM 69
Table 2.3. Criteria for starting medical intervention 70
Comparison 1: Metformin vs Insulin
Table 2.4. Quality assessment of included randomized studies 71 Table 2.5. Quality assessment of included non-randomized studies 73 Table 2.6. Description of randomized studies 78 Table 2.7. Description of non-randomized studies 81 Table 2.8. Important maternal outcomes of GDM stratified by OGTT 92 Table 2.9 Important neonatal outcomes of GDM stratified by OGTT 104
Comparison 2: Metformin vs Glibenclamide
Table 2.10. Quality assessment of included studies 111 Table 2.11. Characteristics of included studies 114
Comparison 3: Metformin vs Diet alone
Comparison 4: Metformin Success vs Metformin Failure
Table 2.14. Quality assessment of included studies 126 Table 2.15. Description of included studies 129 Table 2.16. Metformin Failure rates among different ethnic groups 130
Chapter 3
Table 3.1. Characteristics of 299 GDM women 150
Chapter 4
Table 4.1. Maternal baseline characteristics of GDM with 163 metformin monotherapy vs metformin failure
Table 4.2. Pregnancy outcomes between 165
metformin monotherapy and metformin failure
Table 4.3. Area Under Curve of maternal characters of metformin failure 168 Table 4.4. Characteristics of Predictive values of metformin failure 168 Table 4.5. Criteria for predicting metformin failure after dietary failure 168 Table 4.6. Baseline characteristics of GDM women between 170
metformin failure and insulin alone groups
Table 4.7. Pregnancy outcomes of GDM women between 170 metformin failure and insulin alone groups
Chapter 5
Table 5.1. Characteristics of GDM women 188
Table 5.2. Pearson’s correlation-plasma glucose, homocysteine, BMI 190 and birth weight correlates with serum micronutrient levels 192 Table 5.3. Multiple regression of fasting glucose at diagnostic and
Chapter 6
List of Abbreviations
1C one-carbon
ACC acetyl CoA carboxylase ACS Acetyl CoA synthetase Ado-Hcy s-adenosylhomocysteine Ado-Met s-adenosylmethionine AMP adenosine monophosphate AMPK adenosine monophosphate kinase
apo apolipoprotein
ATP adenosine triphosphate AZT/5-AZT 5-azacytidine
B12 vitamin B12
BMI Body Mass Index
BSA Bovine Serum Albumin
BWt Birth weight
cAMP cyclic adenosine monophosphate
Cbl Cobalamin
cDNA cyclic Deoxyribonucleic Acid
CE Cholesterol Esters
ChoRE Carbohydrate Response Elements
ChREBP Carbohydate Responsive Binding Protein
CI Confidence Interval
CPT I Carnitine Palmitoyl Transferase I CRP C-reactive Protein
CSR Caesarean Section Rates
Ct cycle threshold
dTMP deoxythymidine monophosphate dUMP deoxyuridine monophosphate EDTA ethylene-diamine-tetraacetic acid EPA eicosapentanoic acid
ER endoplasmic reticulum
FAS Fatty acid Synthase
FBS Foetal Bovine Serum
FFA Free Fatty Acids
FP2ase Fructose-1,6-bisphosphatase FPG Fasting Plasma Glucose
G6P Glucose-6-phosphate
G6Pase Glucose-6-phosphatase
GA Gestational Age
GDM Gestational Diabetes Mellitus GEH George Eliot Hospital
GI Gastrointestinal
GK Glucokinase
GLP-1 Glucagon like peptide-1 GLUT Glucose Transporter
GPAT Glycerophophate Acyltransferase GROW Gestational Related Optimal Weight GSK Glycogen Synthase Kinase
HAPO Hyperglycaemia and Adverse Pregnancy Outcomes HbA1c Glycated Haemoglobin
HDL High Density Lipoprotein
HepG2 Human Hepatocellular carcinoma cell line HGP Hepatic Glucose Output
HMG-CoA 3-Hydroxy-3-methylglutaryl-CoA
HMGCR 3-Hydroxy-3-methylglutaryl-CoA Reductase HOMA Homeostasis Model Assessment
hPL human Placental Lactogen I2 Statistical Heterogeneity IADPSG
International Association of Diabetes and Pregnancy Study Groups
IDF International Diabetes Federation IDL Intermediate Density Lipoprotein IRS Insulin Receptor Substrate
IU International Unit
IUGR Intrauterine Growth Retardation KCAC Krebs citric acid cycle
LA Long acting
LBW Low Birthweight
LDL Low Density Lipoprotein
LDLR LDL recepter
LGA Large for gestational age L-PK Liver-Phospho Kinase
LPL Lipoprotein Lipase
MATE Multidrug and Toxic Compound Extrusion MEM Modified Eagle's Medium
MMA Methylmalanoic acid MMCoA Methylmalonyl CoA
MMCoAM Methylmalonyl CoA Mutase
MOD Mode of Delivery
mRNA massenger ribonucleic acid
MS Methionine Synthase
MTHF Methyl Tetra Hydro Folate MTP Mitochondrial Transfer Protein NAFLD Non Alcoholic Fatty Liver Disease NEFA Non Esterified Fatty acids
NPH Neutral Protamine Hagedron NPV Negative Predictive Value NRCT Non-randomized controlled trials OCT Organic Cation Transporter OGCT oral glucose challenge test OGTT oral glucose tolerance test OHA oral hypoglycaemic agents
OR odds ratio
PBS Phosphate Buffer Saline
PBS-T PBS-Tween
PCOS Polycystic ovary syndrome
PE pre-eclampsia
PEPCK phosphoenol pyruvate carboxykinase PGC PPAR gamma coactivator
PI Ponderal Index
PIH Pregnancy-induced hypertension PKA Protein Kinase Synthase
PMAT Plasma Monoamine Transporter
PP postprandial
PPAR-γ peroxisome proliferated activator receptors PPV positive predictive value
PVDF polyvinylidine difluoride
RA Rapid Acting
RBC red blood cells
RCT randomized controlled trials
RNA ribonucleic acid
ROB risk of bias tools
ROC Receiver Operator Curve
RT-PCR Reverse Transcriptase-Polymerase Chain Reaction
S1P Site-1-protease
SA Short acting
SAM-e s-adenosylmethionine
SCAP SREBP cleavage-activating protein SCBU Special Baby Unit
SCD Steroyl CoA decarboxylase
SD Standard Deviation
SDS Sodium Dodecyl Sulphate
SDS-PAGE SDS-polyacrolamide gel electrophoresis SEM Standard Error of mean
SGA Small for gestational age
SGLT Sodium-Glucose linked transporter
SIGN Scottish Intercollegiate Guideline Networks SRE Sterol regulatory elements
SREBF/SREBP Sterol regulartory element binding factor/protein STK11/LKB1 Serine Threonine Kinase 11
TC Total cholesterol
TCA Tricarboxylic cycle
TG Triglyceride
tHcy total homocysteine
THF Tetrahydrofolate
TNF-α Tumour Necrotic Factor-α
DEDICATION
ACKNOWLEDGEMENT
DECLARATION
Summary
Gestational diabetes mellitus (GDM) can affect up to 1 in 5 of pregnancies and is associated with adverse pregnancy outcomes including pre-eclampsia, neonatal hypoglycaemia, large for gestational age, increased adiposity and birth trauma. Good glycaemic control is the key to reduce these outcomes. Diet and lifestyle modification followed by insulin as necessary is the conventional type of management. Metformin is increasingly used in pregancy but with limited evidence, its role in GDM has not been well-established.
A systematic review including both randomized and non-randomized controlled studies have been conducted to evaluate the contemporary evidence of metformin in GDM. It is suggested that metformin in GDM could be a useful alternative to insulin and is regarded as the best oral anti-hyperglycaemic agent in GDM management currently. However, almost half of metformin-treated GDM patients required supplementary insulin to achieve target glucose levels (metformin failure). Women with higher metabolic risk factors are likely to develop metformin failure.
A clinical cohort of metformin-treated GDM is used to develop the predictive model to identify GDM women who are at risk of metformin failure. It has been found that women identified by new IADPSG and NICE 2015 fasting criteria are highly likely to develop metformin failure. It has also been established a number of algorithm based on various baseline characters of GDM women which will help primary healthcare physicians choose the best medication for GDM management.
offspring’s insulin resistance is found to be higher among women with high folate low B12 state. Hence, in order to fully appreciate the role of vitamin B12 deficiency in metformin failure, it is first necessary to understand the effects of folate in low vitamin B12 condition on pregnancy outcomes in GDM. It has also been found that in normal vitamin B12 GDM women, serum folate levels are negatively associated with plasma glucose levels but not low B12 state. This underlines the fact that in order for folate to have its role, it is important to have normal vitamin B12 levels.
1.1 Gestational Diabetes Mellitus (GDM)
In the late 1950s, the term “Gestational Diabetes Mellitus” was first developed by O’ Sullivan and his colleagues as “glucose intolerance of any degree which is first recognized during pregnancy” by using 100 gram oral glucose tolerance test (OGTT) (Kitzmilleret al, 2010). Although the definition does not change over time, different diagnostic cut-off values have been adapted in many countries using their local or national data. It should also be noted that because of lack of specificity in definition, the population might be mixed with undiagnosed type 2 diabetes (Albertiet al 1998; Metzger et al 2007). Basically, GDM is partly caused by placental hormonal disturbance resulting in impaired insulin sensitivity and deranged pancreatic beta cell function (Yogevet al2008).
1.1.1 Epidemiology 1.1.1.1 Risk factors
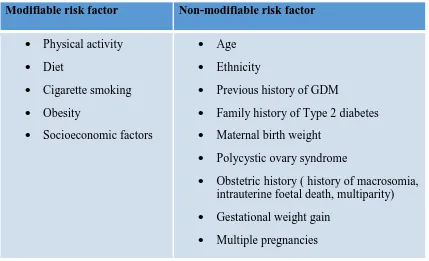
It is understood that women with certain characteristics are at risk of impaired glucose tolerance during pregnancy. These characters include advanced maternal age, higher BMI, previous history of GDM, previous history of macrosomic baby, family history of type 2 diabetes and being a high-risk ethnic descent (Zhang 2010; NICE 2015; Galtier 2010). Like in type 2 diabetes, obesity plays a key role, modification of which could benefit the most on the overall prevalence. It is also well-recognized that pre-pregnancy obesity is invariably and directly related to high risk of GDM(Chu et al
Table 1.1 Risk factors of GDM (Galtier 2010)
Modifiable risk factor Non-modifiable risk factor
Physical activity Diet
Cigarette smoking Obesity
Socioeconomic factors
Age Ethnicity
Previous history of GDM
Family history of Type 2 diabetes Maternal birth weight
Polycystic ovary syndrome
Obstetric history ( history of macrosomia, intrauterine foetal death, multiparity) Gestational weight gain
Multiple pregnancies
1.1.1.2 GDM and Ethnicity
be the same (Ferrara 2007) while others are slightly higher than the non-Hispanic White (Savitz 2008; Dornhourst et al1992). In addition, being a migrant or ancestry of migrants is another factor associated with high risk of GDM (Savitzet al2008). 1.1.1.3 Prevalence of GDM
According to IADPSG criteria, GDM is diagnosed if fasting glucose ≥ 5.1 mmol/L or
1 hour post prandial glucose ≥ 10.0 mmol/L or 2 hour post prandial glucose ≥8.5
mmol/L by using 75 gram OGTT test at 24-28 weeks gestation. If this criteria is adopted, the prevalence of GDM will be tripled (Gopalakrishnan et al 2015). The prevalences of GDM in 15 different countries by IADPSG criteria was described in Figure 1.1(Sacks et al 2012). Recently, the National Institute for Health and Care Excellence (NICE) has changed their GDM criteria which are fasting glucose ≥ 5.6
mmol/L or 2hour post prandial glucose ≥ 7.8 mmol/L by using 75 gram OGTT
[image:28.595.147.462.471.686.2]test(NICE NG-63 2015). The prevalence of GDM detected by this criteria is similar to that by IADPSG criteria (Meeket al2015). Overall, it should be noted that there will be burgeoning number of GDM in very near future.
1.1.2 Consequences of GDM
[image:29.595.119.505.390.676.2]It is understood that maternal hyperglycaemia, whether mild or severe, may impose a serious threat to both mothers and their babies. Moreover, a recent multicentre observational study has proved that there is continuous linear relationship between maternal hyperglycaemia and adverse pregnancy outcomes which is even below the diagnostic or target glucose levels used by different diabetes in pregnancy organizations (HAPO group 2008). Nevertheless, there is a great deal of evidence that the higher the maternal blood sugar level, the higher the risks of complication due to GDM (HAPO group 2008; Rowanet al2010).
One of the major issues with GDM is the glycaemic impact on size of babies (HAPO group 2008). Macrosomia predisposes both mothers and newborns to other serious adverse perinatal outcomes. The term neonatal macrosomia usually refers to birth weight more than 4000g. Alternatively, it is defined as birth weight ≥ 90 percentiles
for gestational age, also termed large for gestational age (LGA) (NICE NG-63 2015). By passing across the placenta, high blood sugar levels in mothers stimulate the fatal pancreatic beta cells to secrete more insulin. As insulin is an anabolic hormone, this will subsequently increase neonatal growth resulting in neonatal macrosomia and other associated risks (Pederson hypothesis) (Figure 1.2) (Singh et al 2008). This hyperglycaemic stimulation of foetal pancreatic insulin secretion can be compounded by gut-derived glucagon like peptide-1 (GLP-1), explained by Lois Jovanovic (Jovanovic 2007). These studies highlighted that when maternal hyperglycaemia was more than fatal renal threshold (<110 mg/dl), the overloaded glucose would be excreted into the amniotic fluid and >20 weeks gestation, the time when he could swallow, the glucose rich amniotic fluid would then enter the fatal gut and subsequently, would increase the gut-stimulated incretin secretion. He also mentioned that fatal β cell could be stimulated for hours despite being maternal hyperglycaemia
NG-attributable to hyperglycaemia together with hyperlipidaemia (Dabelea 2010). Recently, it was found that maternal weight gain can have impact on both LGA and SGA in gestational diabetes (Barneset al2013).
Another major issue of GDM is neonatal hypoglycaemia which is attributable to the postnatal persistence of glucose-provoked foetal hyperinsulinaemia (Langer 2008). It is clinically defined as foetal glucose level < 2mmol/l or need for glucose injection (NICE NG-63 2015). Maternal glucose level at birth is the most influential factor of this outcome. The risk of neonatal hypoglycaemia among babies born to GDM is 10.38(95%CI 6.15 to 16.56) (Langer 2008). The lack of timely appropriate management of neonatal hypoglycaemia can lead to brain damage. However, data on risk of gestational diabetes on cognitive skills of offspring have not yet been well-documented (Veenaet al2010).
poor glycaemic measures (ketone bodies) in maternal serum in late pregnancy or history of spontaneous hypoglycaemia in neonatal period. Additionally, gestational diabetes associated adverse lipid profile could also impair the intelligence scales. Secondly, it is evident that babies born to GDM mothers have significant higher metabolic risk markers and higher chance of development of metabolic syndrome than those born to normal glucose tolerance, particularly those with large for gestational age (Boney 2005) and there is a clear link between exposure to increased insulin in intrauterine life to impaired insulin sensitivity in their adult life(Tam 2010).
1.1.3 Pathogenesis of GDM
Gestational diabetes is universally accepted as a state of insulin insensitivity where there is impaired β-cell function to overcome abnormally high insulin resistance
[image:33.595.113.500.489.741.2](Singhet al 2008). In fact, pregnancy itself is an insulin resistant state, resulting from diabetogenic placental factors. During pregnancy, impaired glucose tolerance can normally be compensated by enhanced beta-cell function. Hence, normally, it is not very common for pregnant mothers to develop GDM (Yogevet al2008) Even though GDM has been widely believed as having moderate degree of similar pathophysiology as type 2 diabetes mellitus, in almost a-tenth of GDM, islet cell autoantibodies are found to be implicated (Retnakaran 2010). A brief description on inflammatory cytokines and signalling molecules implicated in GDM is described in Figure 1.3.
Insulin resistance in GDM due to disturbance of placental factors could be at either insulin secretary or insulin performance stage: receptor level, post-receptor level or both (YOgev 2008). To our knowledge, the placental factors implicated in insulin resistance involve hormones – cortisol, human placental lactogen (hPL), human placental growth hormone and oestrogen & progesterone, inflammatory proteins – C-reactive protein (CRP), Tumour necrotic factor-alpha (TNF-α) and adipokines –
adiponectin, leptin (Retnakaran 2010; McCurdyet al2010; Omu 2014). Of these, high CRP and low adiponectin have been well-established as independent and significant risk factors of incident GDM (Retnakaran 2010) while placental hormones like cortisol and hPL are attributable to impaired pancreatic insulin secretion, inflammatory cytokines such as TNF-α interfere with post-receptor mechanisms, particularly at IRS
level (Yogevet al2008). As a result, the translocation of glucose transporter (GLUT 2) in liver or GLUT 4 in muscle and adipose tissues) to the cell surface is impaired with ultimate impact of hyperglycaemia (Yogev et al1008; Retnakaran 2010; Omu 2014; Carrieet al2010).
incidence of preeclampsia (Knopp et al 2010). Taking all things into consideration, insulin resistance during pregnancy could be partly attributable to impact of high levels of free fatty acid on insulin sensitizing tissues.
1.1.4 Current management of GDM
The aim of management of gestational diabetes is to maintain blood glucose within safe limits for mother and fetus. The limitation is that there does not seem to be a clear threshold of glycemic level and risk of adverse pregnancy outcomes (HAPO group 2008). The risk seems to be linear without any clear cut-off point (HAPO group 2008). There is growing evidence that treating mild maternal hyperglycaemia (FPG <5.3 mmol/L) which is much lower than major international diagnostic blood glucose recommendation is associated with reduction in the incidence of adverse pregnancy outcomes (Landonet al2009; Crowtheret al2006). On the other hand, it is stated that the risk of small-for-gestational-age infants is likely to be increased at much lower maternal mean capillary glucose level, specifically < 4.8 mmol/L (Metzgeret al2007). The currently agreed safe glucose levels vary between FPG of 3.8 to 6.1 mmol/L and postprandial level (either 1hr/2hr/3hr) of up to 9 mmol/L.
pregnancy outcomes as well as maternal satisfaction of using the drug (Alwan et al
2009; Rowan et al 2008). Use of insulin is associated with increase in incidence of maternal hypoglycaemia. It is also possible that the use of insulin in mothers can increase the risk of neonatal hypoglycaemia (Alwan et al 2009). Moreover, the high cost of insulin makes it impractical for implementation in resource poor healthcare system.
The application of IADPSG consensus criteria has been shown to benefit women at mild glycaemic level with reduction in adverse perinatal outcomes (Lapolla et al
2011). However, there is no randomized controlled trial (RCT) intervention evidence for treating women with GDM based on IADPSG criteria. It could be predicted that most countries will bring down their diagnostic criteria to lower glycaemic limit of GDM in near future. For these newly identified GDM who could presumably have lower baseline glucose levels than the current guidelines, insulin with hypoglycaemic risk would no longer be a good choice to address the challenge.
1.2 Metformin
Metformin is an ideal, first-line oral anti-hyperglycaemic agent widely used in Type 2 diabetes mellitus since 1957. Beyond its blood glucose lowering effects, it has other potential clinical roles in the prevention of progression to type 2 diabetes from pre-diabetes (impaired fasting glucose and impaired glucose tolerance)(Lillyet al 2009), improving fertility rates in women with polycystic ovary syndrome (PCOS), treating patients with liver steatosis and recent advances in prevention of carcinoma (Scarpello
et al2008).
1.2.1 Metformin in Pregnancy
Metformin is increasingly used during pregnancy recently in women with PCOS and those with GDM. However, the role of metformin during pregnancy is still not much significant owing to the concern that metformin does cross placenta and the drug level in the foetal compartment is as high as that in mother(Charleset al2006). Even though the controversy continues, metformin has been frequently used in the pharmacological management of polycystic ovary syndrome. The increased conception rate in these relatively infertile women with metformin could underline the beneficial role of metformin in pregnancy. Although systematic review of randomized studies done by Lord et al have reported that metformin could reduce the risks of insulin resistance and have benefit on blood pressure and serum lipid levels in pregnancy (Lord et al
2003), one multicentre randomized trial did not find any association(Vanky et al
hand, Jean-Luc Ardilouze mentioned that congenital anomalies might not be an issue with the use of metformin in GDM saying that GDM is usually diagnosed in second trimester when embryogenesis and organogenesis of fetus have been completed (Ardilouzeet al2010). A meta-analysis of metformin in first trimester supported this hypothesis that metformin is not associated with major congenital anomalies with even better protection of some risks (Gilbert et al2006). Recently, Tertti and his college reported that despite the comparable concentration of metformin in placental blood to maternal blood, there was no adverse pregnancy outcomes (Tertti et al 2014). Moreover, while NICE, SIGN, Canadian and Global Federation guidelines have included metformin as glucose lowering agents in GDM (NICE NG-63 2015; SIGN 2010; CDACPGE committee 2003; ADA 2004; IDF 2014), others yet to do so(Seshlah
et al2009). In Canadian guidelines, glibenclamide has been favoured over metformin, stating that metformin has higher failure rate, i.e., the proportion of GDM who have been achieved glycemic control with metformin alone therapy is less than that with glibenclamide alone therapy (CDACPGE committee 2003). Although metformin is included in a few guidelines of GDM management, the specific dosage recommendation has not yet been determined. In current GDM treatment, metformin is given initially as 500 mg or 250 mg together with meal once or twice daily, increasing the dose until optimal glycemic profiles have been achieved or maximum dose of 2500/2000mg/day, whichever comes first. This dosage guideline is taken from non-insulin dependent diabetes management (BNF 2015).
maternal consent (NICE NG-63 2015). So far, the evidences of metformin on pregnancy outcomes are still limited and as a promising drug with placental transfer, it is worthwhile to monitor metformin efficacy and safety on pregnancy outcomes, both in short and long run.
On the other hand, it has been reported that there is increased risk of prematurity (<37 weeks) with metformin therapy with the odds of 1.60 (95% confidence interval(CI):1.02-2.52) (Rowanet al2008). The cause of this is not known. It could be possibly related to 1) gastrointestinal side-effects of metformin which mimic labour pain leading to delivery or 2) longer duration of suboptimal glycaemic control during escalation of metformin, thereby, promoting pre-eclampsia or similar adverse pregnancy outcomes necessitating immediate labour or 3) alteration of calcium metabolism in the gut, resulting in disturbance in uterine contractility (Bauman et al
2000). The finding reported by one small study, where metformin was ceased in metformin failure mothers and changed to insulin treatment rather than continuation with top-up insulin therapy until delivery, was that there was no difference in gestational age at delivery(Corbould et al 2013). This finding was controversial as this study included only 25 metformin users and did not report glycemic control after treatment. Nevertheless, if GDM were controlled more stringently and carefully after the diagnosis, the overall outcomes should be improved because all of poor outcomes in GDM are mostly due to poor glycemic control (HAPO group 2008).
metformin-treated type 2 diabetes needed additional glucose lowering alternatives within 5 years after successful glycemic control with metformin (Brown et al 2010). They also described that patients who develop diabetes at younger age, longer duration of diabetes or higher HbA1c could predict the higher risk of secondary metformin failure. It is stated that the failure rate could be as low as 12.2% if metformin is started within 3 months of diagnosis of diabetes. The data on the indicators of metformin failure in GDM are limited. Some studies have found that metformin-treated women with GDM who needed insulin have higher BMI and are possibly more insulin resistant (higher fasting & postprandial glucose and fructosamine at diagnosis) (Ijas et al2011; Tertti
et al 2013; Spaulonci et al 2013). One small study reported that GDM with fasting glucose at OGTT ≤5.2 mmol/l can achieve optimal glycaemic levels with metformin
alone [71]. Moreover, it could be assumed that being European ethnicity have lower risk of metformin failure than Hispanic or South Asians (Rowanet al2008; Gohet al
2011; Moore et al2010). Given the slower onset of action, if metformin is initiated early in pregnancy, there may be lesser failure rate. Thus, if the treatment strategy of metformin is developed based on the maternal characters at the time of diagnosis, it can ensure consistent proper glycaemic control by addition of appropriate insulin to those with high chance of treatment failure. The significance of GDM women with high failure rate remains an area to be explored. It is also stated that the cost analysis of metformin in GDM has shown that metformin is not as costly as insulin, the additional cost associated with metformin failure is likely to be much higher (Laiet al
1.2.2 Recognized risks of metformin
The adverse effects of metformin in type 2 diabetes are well-recorded. In current clinical practice, metformin is notorious for gastrointestinal side-effects - anorexia, nausea, vomiting, abdominal discomfort and diarrhoea, which usually occurs at the start of the treatment, but most patients can tolerate with dose reduction [80]. The discontinuation rate is also not common with only 5% of patients giving up treatment (Baileyet al. 2007a). It is stated that lactic acidosis, the most serious adverse effect of biguanide group, is rarely seen with metformin. For safety, metformin is not recommended to those with severe systemic hypoxia like uncompensated cardiac & respiratory failure, recent myocardial infarction, renal and hepatic dysfunction (Bailey
et al2007b).
1.2.3 Mechanism of action of metformin
The mechanisms of blood glucose lowering action of metformin differ by organ types. It is reported that metformin reduces hepatic glucose output, insulin sensitizing effects in muscle and adipose tissue and preservation of pancreatic beta cell function(Bailey
et al 2007c). Recently, there is also evidence that metformin stimulates GLP-1
benefits on body weight control which could be observed as early as 6 weeks(Wulffele
[image:42.595.112.504.277.549.2]et al2004). In addition, it is also effective in reducing cardiovascular risks reported by in UK prospective diabetes group study (UKPDS)(UKPDS group 1998).
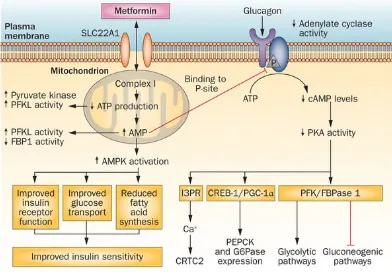
Figure 1.4 Mechanism of metformin action (Figure taken from Pernicovaet al. Nature Reviews Endocrinology 2014; 10,143-156)
1.2.3.1 Molecular mechanisms of action of metformin
triphosphate(ATP))(Owenet al2000; Pernicovaet al2014). The resultant increase in AMP: ATP ratio activates the energy sensor AMPK (adenosine monophosphate-activated protein kinase) enzyme which is a master energy regulator of the cell. Tumour suppressor serine/threonine kinase 11(STK11/LKB1) is suggested to be the upstream of AMPK by transmission of signal from mitochondrial inhibition(Pernicova
membrane by its organic cation transporters (OCTs) which thereby determine the availability of metformin at the site of action (Rena et al 2013). There are various members of OCTs in the body; for active absorption across enterocyte membrane (plasma membrane monoamine transporter [PMAT] and OCT3) and into hepatocyte (OCT1) as well as for active secretion into bile (multidrug and toxic compound extrusion-1 [MATE1]) and into renal tubules (OCT2 and MATE2) (Renaet al2013). The lack of OCT1 in animal model showed significant reduction in metformin efficacy and hence, it highlights the liver as primary site of metformin action (Renaet al2013). In Liver, metformin exerts its anti-hyperglycaemic effects by decreasing hepatic glucose output (HGP) at fasting (Zhou et al 2001). It is stated that this effect occurs through AMPK-dependent and AMPK-independent mechanisms (Renal et al 2013). Metformin-induced LKB1-AMPK axis inhibits gluconeogenesis by decreased transcription/expression of gluconeogenesis genes such as phosphoenolpyruvate carboxykinase (PEPCK) and glucose-6-phosphatase (G6P) (Zhouet al 2001). At the same time, among metformin given to LKB1 and AMPK knockout mice, HGP inhibition was found to be related to depletion of hepatic energy charge (ATP), and suppression of gluconeogenesis which occurs through transcription-independent mechanism(Rena et al 2013). The mechanism is suggested by Miller et al that metformin can diminish the effects of its counter-regulatory hormone, glucagon, on adenylate cyclase, thereby, depletion of cyclic AMP (cAMP) and concomitant activation of cAMP-dependent protein kinase (Protein kinase A/PKA) (Miller et al
2013).
1.2.4 Metformin and reduced vitamin B12 levels
It has been extensively studied that long-term metformin use in type2 diabetes is associated with significant reduction in vitamin B12level (Ting et al2006; Liuet al 2006; Sorichet al2008; Carpentieret al1975; de Jageret al2010) although there are some observational studies which have found no association (Radfar et al 2011; Hermannet al2001). In 1971, Tomkin and his co-workers demonstrated that 30% of type 2 diabetes patients on metformin for more than 2 years were at risk of reduction in vitamin B12 levels, and stopping of metformin could return the B12 level to normal within 1 month (Tomkinet al1971). The metformin-induced lowering of vitamin B12 levels could be due to alteration in calcium level in the gut, gut bacterial flora or abnormal fat absorption (Baumanet al2000).
The prevalence of metformin induced vitamin B12 reduction varies from 14-30% (Hermann et al 2001). In fact, vitamin B12 deficiency (<150pmol/l) is significantly associated with duration (> 3years) (Ting et al 2006) and current dose of metformin use (Tinget al 2006; Sorichet al2008). One randomized trial over 52 months with metformin performed by Jager et al reported that metformin-related vitamin B12 reduction is progressive over time (de Jageret al2010). Tinget alhave also reported that an increase in 1gram/day dose of metformin significantly rises the risk of vitamin B12 deficiency by more than 2 times and that of vitamin B12 insufficiency (150-220 pmol/l) by almost 4 times (Tinget al2006). Sorichet alhave reported “a significant negative correlation” between current metformin dose and vitamin B12 level (r= -0.27, p=0.02)(Sorichet al2008). Furthermore, the randomized controlled trial of Jageret al
insufficiency being 13.8 per 4.3 years (95% CI 43.5 to 8.3) and 8.9 per 4.3 years (95% CI 21.7 to 5.6)respectively(de Jageret al2010).
The use of metformin for less than 6 months has been found in two randomized studies. Sahin et alstudied the effect of metformin on Vitamin B12 level in type 2 diabetes over 6 weeks period where 850 mg bd per day of metformin was offered to newly diagnosed type 2 diabetes patients (Sahin et al 2007). Although the study showed clinically significant change in Vitamin B12 level (mean difference 20.2 (5.3 to -45.7) pmol/l, it failed to prove statistical significance (p=0.119)(Sahin et al 2007). Another randomized study of high dose metformin (mean dose 2163 mg/day) over 16 weeks done by Wulffele et al demonstrated significant reduction in Vitamin B12 level[mean change -14(-4.2 to -24 pmol/l) (p<0.0001)](Wulffeleet al2003). Although studies have almost invariably reported metformin-induced fall in vitamin B12 level, clinical reports of vitamin B12 deficient neurological and haematological disorders are rare.
diabetes population who are not exposed to metformin is as high as almost 50% and half of these patients could be corrected with oral vitamin B12 over 3 months (Jawaet al2010).
1.3 Micronutrients in Pregnancy
1.3.1 Vitamin B12
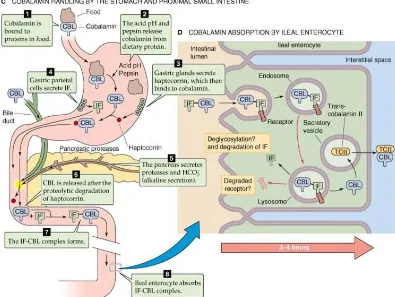
1.3.1.1 Digestion, Absorption and Transport of Vitamin B12
cobalamin metabolism due to defect in mitochondrial cobalamin binding protein(Ball 2004b).
1.3.2 Folic acid
In the late 1930s, folic acid was discovered as vitamin necessary to reduce anaemia during pregnancy. It is not synthesized in the body. Folates are available in the diet as 2 forms: dietary folates – from green leafy vegetables, eggs and legumes and fortified folates. Deficiency can result from poor nutritional intakes or malabsorption or high metabolic demands in conditions like pregnancy or anti-folate chemotherapy (e.g. methotrexate) (Ball 2004a).
Table 1.2. Daily requirement of folates in different age groups (adapted from Bailey
et al1999)
Group Recommended Daily
Allowance (µg/day) Children and adolescents
1-3 4-8 9-13 14-18 Adults ≥19
Pregnant women All ages
Lactating women All ages
150 200 300 400 400 600 500
can result in megaloblastic anaemia, neural tube defects and low birth weight infants (Depeintet al2006).
1.3.2.1 Digestion, absorption and transport of folates
Folates in the diet are usually bound to polyglutamate proteins which need to be converted by proteases to monoglutamate forms before absorption in the proximal jejunum (Depeintet al2006). Then, monoglutamates are transported to liver by H+ co-transporter in the liver and folate receptor in other cells and mitochondria (Ball 2004a). Once in cytosol and mitochondria, they are elongated so that they can retain inside the cell.
1.3.3 Understanding cellular functions of Vitamin B12 and Folates
General overview of interaction of vitamin B12 and folates as a methylation reaction was given in Figure 1.5.
In the cytosol,
(5-tetrahydrofolate) is remethylated back to form 5,10-methyltetrahydrofolate (5,10-MTHF) by the transfer of methyl group from deoxyuridine monophosphate (dUMP) and finally 5,10-MTHF is converted by 5,10-MTHFR to 5-MTHF, a readily available methyl donar for methionine formation. Meanwhile, the demethylated dUMP also is also transformed to deoxythymidine monophosphate (dTMP) which is important for nucleic acid formation and DNA repair (Sardesai et al 2011; Saravanan et al 2010; Nielsenet al2012). Alternatively, either of functional vitamin deficiency can reduce methylation potential inside the cell and can impair one-carbon transfer, leading to hyperhomocysteinaemia, poor cardiovascular risk factor and “DNA hypomethylation and altered gene expression”, contributing to “foetal programming”(Yajnik et al
Figure 1.6 Model of vitamin B12 deficiency on cellular insulin resistance (taken from Saravanan P, Yajnik CS. 2010 in The British Journal of Diabetes and Vascular Disease)
In the mitochondria,
Vitamin B12 as adenosylcobalamin
stated that vitamin B12 is important for coenzyme Q biosynthesis, which is important for mitochondrial respiratory function (Ball 2004b). Therefore, it would be of worth presumption that mitochondria function might be impeded in vitamin B12 deficiency. In addition to its involvement in insulin resistance, vitamin B12 is also important for optimal neuronal function in the sense that the aggregated MMCoA substitutes the role of malonyl CoA in fatty acid synthesis which is essential for generation of nervous tissue, resulting in impaired adaptability of neuronal function (Saravananet al2010). Moreover, the accumulated MMCoA, which is converting backwards to propionyl CoA (3-carbon CoA) may favour formation of odd-chain fatty acids, which also interferes with cell membrane integrity if being incorporate into membrane phospholipid synthesis (Sardesai 2011) By these means, B12 is indispensible for stabilization of myelin sheath membrane. There is also evidence that the aggregated MMCoA substitutes MMA in fatty acid in neuronal membrane and interferes with neuronal integrity and adaptability (Ball 2004b).
It has already mentioned that in B12 deficiency, homocysteine can be accumulated. High homocysteine level during pregnancy could probably be an explanation for insulin resistance in GDM (Guvenet al 2006; Seghieriet al 2003). Homocysteine is “a thiol (SH)-containing amino acid”, one of which pathways includes conversion to essential amino acid, methionine, by going through methylation reaction with the acceptance of methyl group from folate with the help of coenzyme vitamin B12(Hague
pregnancy loss and abruptio placenta. Similar to its association with GDM, high homocysteine level is also found to be related to insulin resistance in polycystic ovary syndrome (Schachteret al2003) and insulin resistance syndrome (Meigset al2001). Any disturbance in metabolism of homocysteine including B-group vitamins and folate deficiency as well as enzyme defect could result in high homocysteine level. 1.3.4 Transgenerational impact of vitamin B12 deficiency
The possible mechanisms how maternal B12 level relates to the long-term risk of B12-related metabolic diseases in offspring have been reviewed by Yajniket al(Yajniket al2008) (Figure 1.6). They have explained that this may occur through either “foetal programming” or shared dietary pattern between mothers and offspring. If maternal vitamin B12 is not enough to supply methyl group for cellular differentiation of the embryo, it may interfere with protein synthesis, resulting in lower lean body mass. At the same time, disturbance in fatty acid synthesis may lead to unfavourable lipid distribution in offspring of B12 deficient mothers. Moreover, there is also evidence that newborn’s B12 and homocysteine level defined by cord blood at birth is strongly predicted by maternal vitamin B12 level at labour (Guerra-Shinoharaet al2002). After birth, the newborns tend to share the same dietary pattern with their mothers and subsequently, they may have low B12 levels. Their low B12 levels will determine their body composition of adipose tissue. Therefore, like their moms, newborns of B12 deficient mothers are at risk of being fat.
found to have significant association with central fat deposition and impaired glucose tolerance of offspring at 6 years of age (Yajnik et al 2007). The highest insulin resistance in the 6-year-olds was found in those with maternal lowest B12 but highest folate tertiles (Yajniket al2008). This group has also reported that low maternal B12 could have risks on offspring’s’ memory and attention span (Bhate et al2008). It is evident that maternal B12 levels may influence not only foetal body composition but also neuronal function.
1.3.5 Impact of Low Vitamin B12 High Folates conditions
During pregnancy, there is high demand of B12 and folate for methylation reaction and DNA synthesis. Reduction in neural tube defects by folic acid supplementation has led to fortification of food in US since 1997. A decade later, it was found that high folate levels particularly in the state of vitamin B12 deficiency are associated with increased homocysteine and methylmalonic acid levels and increased incidence of anaemia and neurological impairment in the elderly (Selhub et al 2007; Ralph et al
2005; MacFarlaneet al2011). High folates are not normally recommended to pregnant women during pregnancy. However, in some cases like diabetic pregnancy which is highly associated with neural tube defects and in some countries where dietary folate deficiency are common, high folates of 5mg are given to pregnant women. So, in pregnancy folate deficiency is rarely seen. In fact, both folic acid and vitamin B12 are responsible for optimal development of neural tube (Kirke et al 1993). High homocysteine level could be implicated in B12 deficient mothers, even in adequate folate supply (Yajniket al2008).
folate states on pregnancy outcomes. The interaction of folate level in B12 deficient pregnant women is found to have positive relationship with Homeostasis Model Assessment (HOMA) insulin resistance whereas the significant reverse relation is observed in non-deficient mothers (Krishnaveni et al 2009). Similarly, it has been reported that high folates low vitamin B12 states during pregnancy can increase the risk of infants with small-for-gestational-age (SGA) and low birth weight (LBW) (Dwarkanath et al 2013; Gadgil et al 2014). Moreover, this imbalance can also increase the incidence of gestational diabetes mellitus in mothers (Krishnaveniet al
2009). This might be due to the detrimental effect of B12 deficiency implicated high homocysteine level although the study failed to report homocysteine level. This association has been found to be obesity-related. However, this cross-sectional study was not able to establish the causal role of B12 deficiency in GDM. Recently, Krishnaveni and her group have found higher insulin resistance in the adolescent offspring born from mothers with higher folate concentrations, but not vitamin B12(Krishnaveni et al 2014). Thus, it should be noted that although folates are essential in pregnancy, high folate intakes can have detrimental effects on pregnancy outcomes, especially in the presence of vitamin B12 deficiency. The question of whether high folate or low vitamin B12 or combination can have these adverse outcomes are still controvertial.
1.3.6 Vitamin B12 deficiency and insulin resistance in clinical studies
proportion of adiposity, determined by skin fold thickness and waist circumference, is found to be significantly higher than the White (Nightingaleet al 2011). This excess fat composition nature of South Asians could be explained by B12 insufficiency (Yajniket al2008). Owing to the lack of B12-abundant food such as meat and milk in their regular meal, the South Asians are found to have lower B12 level than the Europeans (Chamberset al2000).
Similarly, a comparison study of insulin sensitivity among different ethnic groups has reported that insulin resistance is higher in South Asians and Asians in comparison to their Caucasian counterparts(Retnakaran et al 2006). In this study, it has also been found that being South Asian is modestly associated with pre-pregnancy body mass index (BMI) in contrast to strong relationship between other Asian population and their pre-pregnancy BMI, suggesting that ethnicity is an independent risk factor modulating insulin resistance among this population(Retnakaran et al 2006). In consistency with this finding, level of insulin-sensitizing protein, adiponectin, was found to be decreased in South Asian population(Retnakaran et al2004). Similarly, Moore et al observed greater proportion of metformin-treated GDM necessitating additional insulin in Hispanic ethnic group (Mooreet al2010; Mooreet al2007). At the same time, another study has reported that Hispanics have lower B12 than neighbour matched non-Hispanic White despite being non-vegetarians (Kwan et al
2002). Therefore, it could be concluded that relation between ethnicity and insulin resistance might probably be, at least in part, mediated through vitamin B12 deficiency.
It is suggested that the pathway could occur through AMPK signalling pathway, which could be another interesting area to explore the mechanism behind how vitamin B12 deficiency contributes to dyslipidaemia.
1.4 Lipid metabolism
1.4.1. Transport of Lipids in the body
Table 1.3. Classification of Lipoprotein in Human Plasma (Baltimore MD Manual of Lipid Disorders: Reducing for Coronary Heart Disease 1999; 2-10.)
There are three major lipid transport pathways within the body, namely the exogenous pathway, the endogenous pathway and the pathway of reverse cholesterol transport (Kingsbury et al2003) (Figure 1.8). The exogenous pathway includes dietary lipids which are packaged into chylomicrons by coating with apoB48, produced from intestinal cells, and are carried in the lymphatic circulation to the utilization sites. The endogenous pathway contains lipoproteins produced within the liver. Liver produces triglycerides and cholesterols from plasma non-esterified fatty acid (NEFA) pools and from Acetyl CoA (de novo lipogenesis). Some of them are stored in the liver cytosolic lipid pools whereas some are then packaged with apoB100 to dissolve in the circulation and are carried to the peripheral tissues. The reverse cholesterol transport helps removing cholesterol deposits at the periphery by taking them back in the form of HDL to the liver for clearance. Thus, any defect of the pathways including enzymes like lipoprotein lipase (LPL) – responsible for taking up of triglycerides by peripheral tissue or abnormal apolipoprotein production can result in blood dyslipidaemia(Adeli
et al2001).
Lipoprotein Major Lipid
component
Main
Apolipoproteins
Lipid Transport Pathway
Chylomicron TG ApoB-48 Exogenous – from intestine to liver
VLDL TG ApoB-100 Endogenous – from liver to
peripheral tissues
IDL/LDL CE ApoB-100 Endogenous – from liver to peripheral tissues
1.4.2. Role of liver in blood lipid regulation
The liver plays a central role in lipid metabolism. The balance between insulin sensitivity and fatty acid availability in the cytosol maintains the intrahepatic lipid composition and, when the influx of lipids are more than the efflux, lipid accumulation in liver (steatosis) develops(Tessariet al2009). The sources of lipids in the liver come from adipose tissue lipolysis contributing to plasma NEFA pools, dietary lipids and de novo lipogenic particles. Their efflux mechanism includes oxidation and VLDL secretion.
1.4.2.1.Liposynthesis,de novolipogenesis and VLDL assembly and secretion
Liver takes up triglycerides in the circulation via hydrolysis by hepatic lipase (HL) and LPL enzymes whereas LDL cholesterol remnants are endocytosed by specific LDL receptor (LDLR) on the surface (Nguyenet al2008). Free fatty acids (FFA) (activated as fatty acyl CoA) from NEFA pools are esterified with glycerol (activated as alpha-glycerophosphate [α-GP]) by alpha-glycerophosphate acyltransferase (GPAT). GPAT gene
Figure 1.8. An illustrative model of hepatic glycolytic and lipid pathways. All the enzymes in the figure are induced at transcriptional levels by a high-carbohydrate diet through ChREBP and SREBP transcription factors (the known transcription factors and their regulated genes are described at the bottom). (Figure taken from Foufelle F
De novo lipogenesis
Apart from GK which is only under insulin control, all other genes involved in glycolytic and lipogenic pathways can be induced by both insulin and glucose (Raddatzet al 2011). As mentioned above, insulin enhancesde novo lipogenesis by activation of glucokinase and SREBPs. Of these, ACC and HMGCR are rate-limiting enzymes in triglyceride and cholesterol synthesis respectively (Nguyenet al2008). Figure 1.9. An illustration of how SREBPs are released from endoplasmic
De novo lipogenesis is initiated with acetyl CoA formation from pyruvate by L-PK(Foufelleet al 2002). Then, under the insulin control, acetyl CoA is carboxylated to malonyl CoA which further undergoes triglyceride synthesis while it is converted to Hydroxy-3-Methylglutaryl-CoA (HMG-CoA) by Hydroxy-3-Methylglutaryl-CoA Synthase (HMGCR), both of which are in independent of FFA (Figure 1.9). ACC is bidirectional enzyme which regulates FFA partitioning between oxidation and lipogenesis at the availability of malonyl CoA. Under the insulin control, malonyl CoA accumulation favours FFA towards esterification and triglyceride production while inhibiting fatty acid beta-oxidation (β-oxidation) by blocking the activity of
mitochondrial fatty acyl transporter, carnitine palmitoyltransferase-1 (CPT-1)(Kersten
et al 2001). By contrast, glucagon enhances β-oxidation and ketogenesis by
stimulating CPT-1 activity. On the other hand, the overflow of FFA to liver, e.g. diabetic ketoacidosis, can saturate both pathways denoted by combined hyperlipidaemia and hyperkitonemia. After esterification, the newly synthesized FFA molecule are elongated by FAS and the resultant palmitoyl-CoA is desaturated by SCD to palmitoleyl CoA, both of which are under insulin control(Nguyen et al2008). At the same time, HMG-CoA in cholesterol biosynthetic pathway is further reduced by HMGCR, forming mevalonate. Mevalonate is then eventually converted to cholesterol by the action of farnesyl diphosphate synthase and squalene synthase. All the enzymes described above in cholesterol biosynthesis are under SREBP2 control. Interestingly, the SERBPs stimulation by insulin can be observed in states of marked insulin resistance and thereby favouring de novo lipogenesis(Foufelleet al2002; Adielset al
2008). The other transcription factors involved in de novo lipogenesis includes peroxisome proliferator-activated receptors-gamma (PPAR-γ) stimulated by
high-carbohydrate diet and thyroid hormone. Interestingly, it has been reported that only a small part of total triglyceride synthesis in liver is affected by de novo lipogenesis in humans (Postic et al 2008). However, whether this pathway is profoundly affected in the state of insulin resistance is still an area required for further exploration.
1.4.2.2.Lipid transport
The newly synthesized lipids are then exported out of liver by binding to ApoB100 (Adeli et al2001). Increased FFA and TG levels and mitochondrial transfer protein (MTP) stimulate ApoB biosynthesis whereas insulin inhibit it. MTP initiates lipidation of nascent apoB molecule and further enhances the assembly of apo-B containing lipoproteins by catalysing the transfer of lipids from triglyceride rich droplets in smooth endoplasmic reticulum to nascent Apo-B particle.
1.4.2.3. Lipid oxidation
The oxidation of non-esterified acyl-CoA occurs in mitochondria, peroxisomes and microsomes in liver (Nguyen et al 2008). Oxidation of very long chain fatty acids occur in peroxisome and microsomes whereas mitochondria is responsible for oxidation of short, intermediate and long fatty acids. The lipid oxidation is regulated in the liver by the balance between fatty acid supply (from lipolysis of adipocytes) and the rate of lipid oxidation and esterification by microsomes.
intermediate of de novo lipogenesis, catalyzed by acetyl coA carboxylase (ACC) under the control of insulin (Posticet al 2008). When there is intracellular negative energy balance and low malonyl CoA levels, fatty acyl CoA from plasma non-esterified fatty acid pools are carried into mitochondria with the help of the transporter, CPT II, for beta-oxidation. Once in mitochondria, they are converted to malonyl CoA and then to succinyl CoA, an essential intermediate of krebs citric acid (KCA) energy cycle. Finally, succinyl CoA enters into the KCA cycle and energy is released. CPT-1 can also be regulated by methylmalonyl CoA(MM CoA) which is the product of odd chain fatty acid oxidation and requires vitamin B12 for conversion to succinyl CoA(Nguyen
et al 2008). Thus, in case of vitamin B12 deficiency, MM CoA is accumulated and
inhibits CPT-1 and impairs fatty acid oxidation.
Peroxisomal and microsomal fatty acid oxidation is much similar to mitochondrial oxidation(Nguyen et al 2008).However, they produces less ATP-energy than mitochondria because they do not have electron transport chain. Microsomes have cytochrome P450 CYP4A ω-oxidation system which allows them to hydrolyse very
long chain fatty acids into much shorter fatty acids which are preferred substrate for peroxisomal oxidation. Then, the products of peroxisomal oxidation enter into mitochondria for further oxidation. When there is fatty acid overload, these three systems work co-ordinately to regulate fatty acid metabolism inside the liver.
1.4.2.4.Hepatic glucose output
The enzymes controlled gluconeogenesis are phosphoenolpyruvate carboxykinase (PEPCK), fructose-1,6-biphosphatase(FP2ase) and glucose-6-phosphatase(G6Pase) which are inhibited by insulin and stimulated by glucagon or glucocorticoids.
1.4.2.5.Insulin signalling
Insulin signalling is initiated by binding of insulin to its cell surface receptor (Kimet al 2010). The insulin receptor complex then activates tyrosine kinase activity which phosphorylates subsequent downstream molecule, insulin receptor substrates (IRSs), such as IRS-1 and IRS-2. The stimulated IRSs lead to the docking of phosphoinositol-3 kinase (PI-phosphoinositol-3K) (p85-p110) which further phosphorylates Akt. The phosphorylated Akt subsequently phosphorylates and inhibits the activity of glycogen synthase kinase (GSK) which blocks glycogen synthase for glycogen synthesis.
As we have described above, normal liver function is very important for lipid metabolism as it plays central role in the regulation of blood lipid levels. At the same time, vitamin B12 deficiency has possibility of contribution to insulin resistance and blood dyslipidaemia. There are very limited number of studies looking at mechanism behind vitamin B12 deficiency and abnormal lipid metabolism. It would be of great value if the possible cellular mechanism of vitamin B12 deficiency is fully established in the development of vitamin B12 supplementation strategy.
1.5 Thesis Aims and methods
The thesis aims to explore factors influencing the efficacy of metformin in the treatment of GDM and the role of micronutrients, particularly vitamin B12, in treatment failure. It comprised of a systematic review, clinical and cell culture studies to evaluate role of metformin in GDM, factors influencing its efficacy and mechanisms by which vitamin B12 deficiency interferes with metformin study.
Systematic review
To evaluate efficacy and safety of metformin in the treatment of GDM Clinical studies
To identify maternal characters of metformin failure in GDM
To investigate the association between vitamin B12, folate & homocysteine with the pregnancy outcomes in GDM
Laboratory study
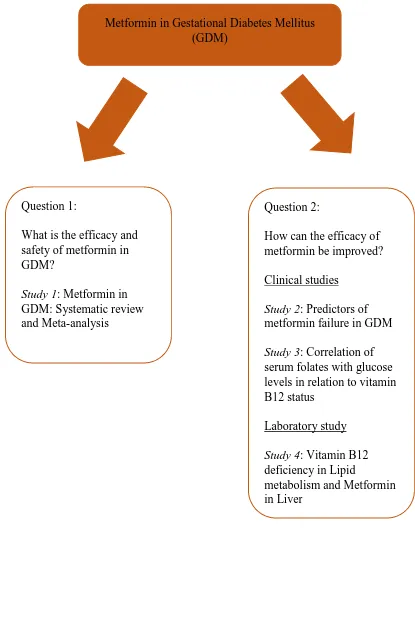
Figure 1.10. An overview of PhD thesis
Metformin in Gestational Diabetes Mellitus (GDM)
Question 1:
What is the efficacy and safety of metformin in GDM?
Study 1: Metformin in GDM: Systematic review and Meta-analysis
Question 2:
How can the efficacy of metformin be improved? Clinical studies
Study 2: Predictors of metformin failure in GDM
Study 3: Correlation of serum folates with glucose levels in relation to vitamin B12 status
Laboratory study
Study 4: Vitamin B12 deficiency in Lipid
CHAPTER 2
EVALUATION OF METFORMIN IN GESTATIONAL DIABETES: SYSTEMATIC REVIEW AND META-ANALYSIS
2.1 Introduction
GDM is the commonest medical disorder in pregnancy and the prevalence would be tripled if the new IADPSG guidelines are introduced and can be up to 25%(Duranet al2014; Cundyet al2014). Moreover, the prevalence of GDM women has also been increased by 64% in the past 2 decades, most possibly due to increasing maternal obesity and aging mothers at first pregnancy (Duranet al2014). Thus, it could be well-expected that the percentages of GDM will be booming up in next couple of years. Currently, clinical emphasis is on the achievement and maintenance of maternal glycemic control, which acts as a modifiable principal predictor of adverse outcomes to mother and fetus (Rowanet al2010). Importantly, hyperglycemia during pregnancy is strongly associated with neonatal hypoglycemia and impaired foetal lung maturity leading to respiratory distress and polycythemia after birth (Langeret al2008). GDM also has a negative impact on the risk of metabolic diseases and impaired cognitive function in later life(Langer et al 2008; Clausen et al 2008; Pirkola et al 2010). Management of GDM starts with lifestyle modification followed by medical intervention. Almost half of GDM women need medication which include insulin and oral hypoglycaemic agents because of poor glycaemic control (Terttieet al2008; Goh
et al 2011). The role of oral hypoglycaemic agents in GDM is increasing nowadays. Metformin and glibenclamide are now approved to be offered to GDM women in some guidelines,but their efficacy and safety are not well-understood yet. Considering the strong association between GDM and obesity, metformin is a promising drug for GDM because it can benefit on lowering maternal weight gain than insulin.
al2015, Kitwiteeet al2015; Suet al2014; Guiet al2013; Lautatziset al2013; Amin
et al 2015). The most recent one included 8 randomized controlled trials (RCTs) in their outcome estimate synthesis(Kitwitee et al 2015). Although metformin may benefit on GDM than either insulin or glibenclamide, the effects are still varied and there are large heterogeneity among studies. This might be due to differences in diagnosis of GDM (e.g.75g or 100g OGTT) or variations in intervention strategies. Moreover, it is reported that metformin use in GDM is associated with higher incidence of prematurity (Rowanet al2008). Inclusion of non-randomized controlled trials (NRCT) will increase the sample size and will also enable subgroup analysis and sensitivity analysis to generate more specific and precise outcome estimate with wider inferential value. Furthermore, as these NRCTs have much more clinically pragmatic design (i.e. inclusion of physician’s judgement on treatment therapy), this might also help research methodology to be developed in future studies.