ISSN: 1816-949X © Medwell Journals, 2014
Corresponding Author: Suryani Syahrir, Department of Civil Engineering, Hasanuddin University, Jalan Perintis Kemerdekaan KM-10, Indonesia
Effectiveness of Malimpung Quartz Sand as Single Medium on Water Filtration
Suryani Syahrir, Mary Selintung, Saleh Pallu and Arsyad Thaha Department of Civil Engineering, Hasanuddin University,
Jalan Perintis Kemerdekaan KM-10, Indonesia
Abstract: Filtration is a separating process between solids and fluid, either liquid or gas, using a porous medium or other permeable materials. Filtration is used to remove the suspended solids and colloids as much as possible. In filtration process, water seeps and passes through the filter medium. The suspended solids will be accumulated on the surface of filter and collected throughout the depth of the medium. Quartz sand is an excellent medium for water filtration. In this research, Malimpung quartz sand was used as the single filter medium. The sand comes from Malimpung, Pinrang, South Sulawesi Province, Indonesia. The purposes of this research are to analyze the effectiveness of Malimpung quartz sand at the flow rate and turbidity level using a single medium filter. The experiment method consists of two stages. Firstly, testing of the sand whether meets the filter medium standard or not. It was performed at the Soil Mechanics Laboratory of Hasanuddin University. Secondly, testing of the sand in a filtration apparatus. We used two unlike types of diameter: uniform and non-uniform grain diameter. Moreover, we used three different thickness of filter medium: 50, 60 and 70 cm. The results showed that the Malimpung quartz sand meets the standard of filter medium with value of U as 1.7c and G as 2.66 (g cms G). The effectiveness of the sand can be seen from the large output discharge and low
3
water turbidity level.
Key words: Quartz sand, filtration, effectiveness, grain diameter, soil
INTRODUCTION colloids (Environmental Protection Agency, 1995). In Water is the most basic need for creatures. The water
should meets the minimum standard either in quality or quantity. The water should be available in qualified health conditions which can be viewed from the aspects of physics, chemistry and biology (Kusnaedi, 2010).
Based on some recent researches, significant decrease of iron and manganese can be obtained by filtration using single, dual or three filter mediums. Furthermore, the influence of the sand grain diameter and thickness to reduce the iron content in the water also has given good results. This research focuses on analyzing the effectiveness of the Malimpung quartz sand as a single medium filter.
Filtration is a separating process between solids and fluid, either liquid or gas, using a porous medium or other permeable materials. Filtration is used to remove the suspended solids and colloids as much as possible. In filtration process, water seeps and passes through the filter medium. The suspended solids will be accumulated on the surface of filter and collected throughout the depth of the medium. Filters also have the ability to separate all sizes particulates including algaes, viruses and soil
a granular medium filtration, the mechanisms are as follows:
C Mechanical filtering (mechanical straining)
C Sedimentation
C Absorption or electrokinetic force
C Coagulation in the filter bed
C Biological activities
Filtration is performed to separate liquid mixtures and delicate suspended solids as much as possible using porous medium or material (Environmental Protection Agency, 1995). Filtration can be used as the initial or primary treatment. In a raw water treatment where the coagulation process is not necessary to be performed, the fresh water can be filtered with any kind of filter, including coarse sand. Rough filter materials can store sludges in high capacity due to its ability to withstand the penetration of suspended particles in a sufficient depth. The filtration characteristic is stated in water flow. Each filtration is selected based on technical and economic considerations.
q= × ×J K i
J=Q/(A t)× sediment. Therefore, the materials can be separated from
the liquid by filtration. If the treated water has a uniform size of solids, the appropriate filter is a single medium. Conversely, the proper filter is a dual or three medium (Kusnaedi, 1995, 2010).
The important part in filtration is the filter medium. It can be composed of natural silica sand, anthracite or garnet sand. Generally, these mediums has various on size, shape and chemical composition.
Quartz sand is also known as white or silica sand resulted from weathering of rocks containing minerals such as quartz and feldspar. The weathering results are washed and carried away by water or wind and deposited on the edges of rivers, lakes or seas. Quartz sand is mineral composed of Silica Crystals (SiO ) and contains a2 compound of impurities during the deposition process. Quartz sand has combined composition of SiO , Fe O ,2 2 3 Al O , TiO , CaO, MgO and K O with translucent white or2 3 2 2 other colors depending on the compound of impurities. It has a hardness of 7 Mohs scale, specific weight of 2.65, melting point of 17~150°C hexagonal crystal form and specific heat of 0.185 (Kusnaedi, 2010).
The filter medium is selected using sieve analysis. The results of a sieve filter medium are described as the accumulation distribution curve to find the effective size and uniformity of desired medium (expressed as uniformity coefficient). To determine the feasibility of sand as a filter medium in water filtration, uniformity coefficient (U = 1.2~1.8) and specific weight of the sandc (G = 2.65~2.67) could be used.s
The transfer of water through the soil in a saturated condition: Darcy’s Law is used to calculate the permeability and the transfer of water through the soil in a saturated condition. In fact, Darcy’s Law also involves hydraulic transferability and gradient as parameters. Darcy’s Law depicts the flow of water in saturated conditions quantitatively (Kusnaedi, 1995).
Darcy’s Law: Darcy’s Law is formulated as:
(1) Where:
J = Velocity of water flow K = Hydraulic transferability I = Hydraulic gradient
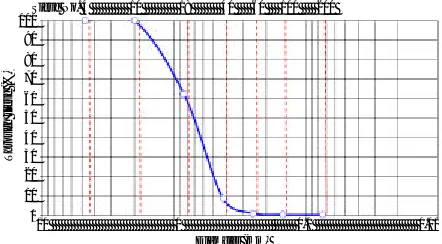
[image:2.612.322.530.102.227.2]Darcy’s Law shows that J, the speed of water flow is proportional to i, the hydraulic gradient. The value of K, hydraulic transferability is a constant which confirms the
Fig. 1: Discharge efficiency of non-uniform grain diameter proportional relationship between the flow velocity and hydraulic gradient. In determining the hydraulic transferabilities, the variables such as speed of water flow and hydraulic gradient were usually varied. In Darcy’s Law, the saturated hydraulic transferability is a constant that indicates the linear relationship between J and i as shown in Fig. 1. The slope of line J/i shows the relationship between the speed of water flow and hydraulic gradient.
Water flow velocity (J): Water flow velocity is formulated as follows:
(2) Where:
J = Water flow velocity
Q = Water displacement through the cross-sectional (A) t = Time
MATERIALS AND METHODS
was opened. Variations of filter medium thickness were 50, Artificial water testing: The test results of 50 NTU 60 and 70 cm. The water level above the filter medium
must be kept at 40 cm. Therefore, the filtration unit was designed to overflow at the level by making holes in the apparatus.
At the beginning, the fibers were inserted into the filtration apparatus. Water was flown to clean the fibers from dirt and grime. Then, the filter medium with a uniform diameter of grain were inserted into the appliance at 50 cm of level. Furthermore, 50 NTU artificial water was flown into the filtration apparatus until the water reaches 40 cm of level above the filter medium.
For Q , intake discharge water were collected beforein passed the filter medium of quartz sand with time variation of 3, 6, 9, 12 and 15 sec. Subsequently for Q , outputout discharge, water were collected after passed the filter medium of quartz sand with the same variations of time. These procedures were repeated for 60 and 70 cm of thickness.
For non-uniform diameter experiment, the thickness of quartz sand was 50 cm. Its compositions from the bottom to the top of filtration apparatus were 10 cm for 0.425 mm, 20 cm for 0.84 mm and 20 cm for 2 mm of diameter. The composition for 60 and 70 cm of thickness were identicle, except the highest layer became 30 and 40 cm, respectively. Furthermore, these methods were done in the same manner for the uniform diameter experiment.
RESULTS AND DISCUSSION
Characteristics testing of malimpung quartz sand: The result of the sieve and density tests of Malimpung quartz sand can be seen in Table 1 and Fig. 2. Furthermore, the specific weight of Malimpung quartz sand are presented in Table 2.
In Table 1 and Fig. 2, we can see that the value of Uc was 1.7. In Table 2, G , the average specific gravity ofs coarse sand sample was 2.66 (g cmG3). These values meet the requirements of AWWAS (American Water Works Association Standard). Therefore, Malimpung quartz sand can be used as filter medium in a water filtration.
artificial water filter medium with a uniform diameter (0.84 mm of grain diameter) can be seen in Table 3.
[image:3.612.317.538.218.340.2]Figure 3 shows that the discharge efficiency at 50 cm of thickness was quite large, i.e., 50 cm (92.72%). This can be happened due to the thickness of the first stream, the flow rate of water filled the cavity between the filter medium was still high. The filtration mechanism was not performed perfectly. In another hand, discharge efficiency
[image:3.612.316.540.388.487.2]Fig. 2: Sieve curve of Malimpung quartz sand
Table 1: The result of a sieve and density test of Malimpung quartz sand Percentage
Filter Diameter Suspended Cumulative
---No. (mm) weight (G) weight (G) Restrained Get away
4 4.750 0 0 0.00 100.00
10 2.000 0 0 00.00 100.00
18 0.840 188 188 37.60 62.40
40 0.425 268 456 91.20 8.80
60 0.250 38 494 98.80 1.20
100 0.150 4 498 99.60 12.40
200 0.075 0 498 99.60 12.40
Pan 0.000 2 500 100.00 0.00
Table 2: The specific weight of Malimpung quartz sand Experiment No.
---Parameters I II
Rough samples
Pycnometer weight (W , g)1 45 46
Pycnometer + water weight (W , g)2 142 144
Weight of pycnometer + water + soil (W , g)3 173.3 175.1
Dry soil weight (W , g)s 50 50
Temperature (°C) 27 27
Correction factor (a) 0.9983 0.9983
Specific gravity (G )s 2.669 2.641
[image:3.612.72.542.642.725.2]Average Specific Gravity (G )s 2.66
Table 3: Discharge efficiency of uniform grain diameter
Filter thickness of 50 cm Filter thickness of 60 cm Filter thickness of 70 cm
--- --- ---Time Qin50 Qout50 Discharge Qin60 Q out60 Discharge Q in70 Q out70 Discharge (sec) (mL secG1) (mL secG1) efficiency (%) (mL secG1) (mL secG1) efficiency (%) (mL secG1) (mL secG1) efficiency (%)
3 415.56 292.89 70.48 415.56 273.11 65.72 415.56 275.00 66.18
6 356.50 263.78 73.99 356.50 258.11 72.40 356.50 263.33 73.87
9 335.48 244.19 72.79 335.48 232.41 69.28 335.48 235.19 70.10
12 289.72 247.50 85.43 289.72 232.81 80.35 289.72 230.61 79.60
15 261.29 242.27 92.72 261.29 234.33 89.68 261.29 233.11 89.22
100 90 80 70 60 50 40 30 20 10 0
Through sieve (%)
Sieve No. 4 10 18 40 60 100 200
Diameter (mm)
Table 4: Discharge efficiency of non-uniform grain diameter
Filter thickness of 50 cm Filter thickness of 60 cm Filter thickness of 70 cm
--- --- ---Time Qin50 Qout50 Discharge Qin60 Q out60 Discharge Q in70 Q out70 Discharge (sec) (mL secG1) (mL secG1) efficiency (%) (mL secG1) (mL secG1) efficiency (%) (mL secG1) (mL secG1) efficiency (%)
3 415.56 278.00 66.90 415.56 264.89 63.74 415.56 257.11 61.87
6 356.50 246.11 69.04 356.50 256.94 72.07 356.50 256.67 72.00
9 335.48 225.93 67.34 335.48 231.48 69.00 335.48 227.78 67.90
12 289.72 231.94 80.06 289.72 224.58 77.52 289.72 232.72 80.33
15 261.29 211.78 81.05 261.29 223.33 85.47 261.29 232.44 88.96
Fig. 3: Discharge efficiency of uniform grain diameter at 60 and 70 cm of thickness have same tendency of values for all variations of time (89.68 and 89.22%). This was due to the mechanism of granular medium filtration (mechanical straining, sedimentation, adsorption, biological activity) were already on going.
The discharge efficiency values at 60 and 70 cm of thickness were almost the same with 50 cm of thickness. This was probably because of sediments was dredged as 1~2 cm on the upper surface of the filter medium on each additional filter medium thickness. Therefore, the flow rate can be maintained at 50 cm of thickness. The discharge efficiency to grain diameter is not uniform for all variations of thickness can be seen in Table 4.
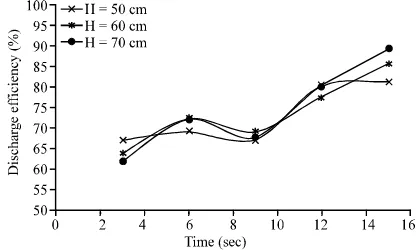
Figure 1 shows the fluctuation with same tendency in all thickness. The largest discharge efficiency was found at 70 cm of filter medium thickness (88.96%). However, the discharge efficiency at 50 and 60 cm of thickness has a little difference (81.05 and 85.47%). This was caused by the composition of filter medium layers that span from the bottom to up (fine grain to coarse grain diameter) were not impaired in the base and middle layer. The addition of filter medium thickness was given on the top layer only, i.e., the filter medium with 2 mm of diameter. The fairly large grain diameter resulted in a high flow velocity and a
high porosity. Table 5 shows the turbidity levels of Almost the same result was obtained in non-uniform uniform and non-uniform diameter for all variations of grain diameter with 70 cm of filter thickness where a fairly
thickness. large grain diameter as 2 mm placed on the top layer. In
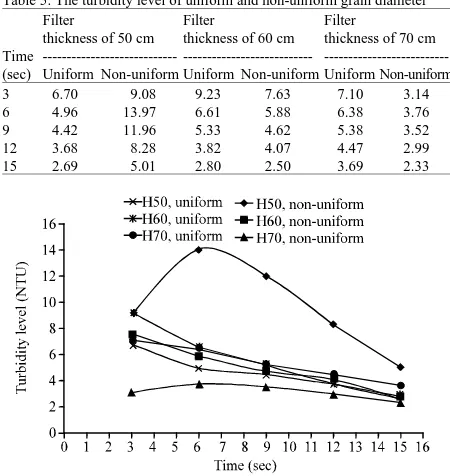
[image:4.612.75.300.110.332.2]Figure 4 shows the turbidity levels for uniform grain the such condition, a large flow rate and duration of see diameter. It tends to gradually decline as the increment of page of water passed through the filter medium were
Table 5: The turbidity level of uniform and non-uniform grain diameter
Filter Filter Filter
thickness of 50 cm thickness of 60 cm thickness of 70 cm Time -- - ---(sec) Uniform Non-uniform Uniform Non-uniform Uniform Non-uniform
3 6.70 9.08 9.23 7.63 7.10 3.14
6 4.96 13.97 6.61 5.88 6.38 3.76
9 4.42 11.96 5.33 4.62 5.38 3.52
12 3.68 8.28 3.82 4.07 4.47 2.99
15 2.69 5.01 2.80 2.50 3.69 2.33
Fig. 4: Comparison on turbidity levels of uniform and non-uniform grain diameter
impregnation time through the cavity of the filter medium. The lowest turbidity level (2.69 NTU) was found at 50 cm of thickness at 15 sec of drainage time. The turbidity level for non-uniform grain diameter was increased in 6 sec at 50 cm of thickness. Nevertheless, a regularly decrease was found at end time. The lowest turbidity level (2.33 NTU) was ccurred at 70 cm of thickness at 15 sec of the drainage time.
[image:4.612.314.539.206.444.2]resulted in. Furthermore, a low turbidity level and REFERENCES proportional to the magnitude of discharge efficiency
were obtained. Environmental Protection Agency, 1995. Water treatment
ACKNOWLEDGMENTS Kusnaedi, 1995. Mengolah Air Gambut dan Air Kotor Thanks to researchers for helps and suggestions in ISBN-13: 9789794892862, Pages: 44.
performing this research and writing this study. This Kusnaedi, 2010. Mengolah Air Kotor untuk Air research was funded by the Directorate of Higher Minum. PT Niaga Swadaya, Jakarta, ISBN-13:
Education of Indonesia Government. 9789790024403.