warwick.ac.uk/lib-publications
Manuscript version: Author’s Accepted Manuscript
The version presented in WRAP is the author’s accepted manuscript and may differ from the
published version or Version of Record.
Persistent WRAP URL:
http://wrap.warwick.ac.uk/108979
How to cite:
Please refer to published version for the most recent bibliographic citation information.
If a published version is known of, the repository item page linked to above, will contain
details on accessing it.
Copyright and reuse:
The Warwick Research Archive Portal (WRAP) makes this work by researchers of the
University of Warwick available open access under the following conditions.
Copyright © and all moral rights to the version of the paper presented here belong to the
individual author(s) and/or other copyright owners. To the extent reasonable and
practicable the material made available in WRAP has been checked for eligibility before
being made available.
Copies of full items can be used for personal research or study, educational, or not-for-profit
purposes without prior permission or charge. Provided that the authors, title and full
bibliographic details are credited, a hyperlink and/or URL is given for the original metadata
page and the content is not changed in any way.
Publisher’s statement:
Please refer to the repository item page, publisher’s statement section, for further
information.
Connecting Social Media to E-Commerce:
Cold-Start Product Recommendation using
Microblogging Information
Wayne Xin Zhao, Sui Li, Yulan He, Ji-Rong Wen, Edward Y. Chang and Xiaoming Li
Abstract—In recent years, the boundaries between e-commerce and social networking have become increasingly blurred. Many e-commerce websites support the mechanism of social login where users can sign on the websites using their social network identities such as their Facebook or Twitter accounts. Users can also post their newly purchased products on microblogs with links to the e-commerce product web pages. In this paper we propose a novel solution forcross-site cold-start product recommendation which aims to recommend products from e-commerce websites to users at social networking sites in “cold-start” situations, a problem which has rarely been explored before. A major challenge is how to leverage knowledge extracted from social networking sites for cross-site cold-start product recommendation.
We propose to use the linked users across social networking sites and e-commerce websites (users who have social networking accounts and have made purchases on e-commerce websites) as a bridge to map users’ social networking features to another feature representation for product recommendation. In specific, we propose learning both users’ and products’ feature representations (called user embeddings and product embeddings, respectively) from data collected from e-commerce websites using recurrent neural networks and then apply a modified gradient boosting trees method to transform users’ social networking features into user embeddings. We then develop a feature-based matrix factorization approach which can leverage the learnt user embeddings for cold-start product recommendation. Experimental results on a large dataset constructed from the largest Chinese microblogging service SINAWEIBOand the largest Chinese B2C e-commerce website JINGDONGhave shown the effectiveness of our proposed framework.
Index Terms—e-commerce, product recommender, product demographic, microblogs, recurrent neural networks
F
1
I
NTRODUCTIONIn recent years, the boundaries between e-commerce and social networking have become increasingly blurred. E-commerce websites such as eBay features many of the characteristics of social networks, includ-ing real-time status updates and interactions between its buyers and sellers. Some e-commerce websites also support the mechanism of social login, which allows new users to sign in with their existing login information from social networking services such as Facebook, Twitter or Google+. Both Facebook and Twitter have introduced a new feature last year that allow users to buy products directly from their web-sites by clicking a “buy” button to purchase items in adverts or other posts. In China, the e-commerce company ALIBABA has made a strategic investment in SINAWEIBO1 where ALIBABA product adverts can
be directly delivered to SINAWEIBO users. With the new trend of conducting e-commerce activities on social networking sites, it is important to leverage knowledge extracted from social networking sites for the development of product recommender systems.
In this paper, we study an interesting problem of recommending products from e-commerce websites to
1.
http://www.reuters.com/article/2013/04/29/net-us-sinaweibo-alibaba-stake-idUSBRE93S0DA20130429
users at social networking sites who do not have his-torical purchase records, i.e., in “cold-start” situations. We called itcross-site cold-start product recommendation. Although online product recommendation has been extensively studied before [1], [2], [3], most studies only focus on constructing solutions within certain e-commerce websites and mainly utilise users’ historical transaction records. To the best of our knowledge,
cross-site cold-start product recommendation has been rarely studied before.
into user embeddings. We then develop a feature-based matrix factorization approach which can lever-age the learnt user embeddings for cold-start product recommendation.
We built our dataset from the largest Chinese mi-croblogging service SINAWEIBO2and the largest
Chi-nese B2C e-commerce website JINGDONG3, containing
a total of 20,638 linked users. The experimental results on the dataset have shown the feasibility and the effectiveness of our proposed framework.
Our major contributions are summarised below:
• We formulate a novel problem of recommending products from an e-commerce website to social networking users in “cold-start” situations. To the best of our knowledge, it has been rarely studied before.
• We propose to apply the recurrent neural net-works for learning correlated feature represen-tations for both users and products from data collected from an e-commerce website.
• We propose a modified gradient boosting trees method to transform users’ microblogging at-tributes to latent feature representation which can be easily incorporated for product recommenda-tion.
• We propose and instantiate a feature-based ma-trix factorization approach by incorporating user and product features for cold-start product rec-ommendation.
2
P
ROBLEMF
ORMULATIONGiven an e-commerce website, let U denote a set of its users, P a set of products and R a |U | × |P|
purchase record matrix, each entry ru,p of which is a binary value indicating whether u has purchased product p. Each user u ∈ U is associated with a set of purchased products with the purchase timestamps. Furthermore, a small subset of users in U can be linked to their microblogging accounts (or other social network accounts), denoted as UL. As such, each user u ∈ UL is also associated with their respective microblogging attribute information. LetAdenote the set of microblogging features, and each microblogging user has a|A|-dimensional microblogging feature vec-torau, in which each entryau,i is the attribute value for thei-th microblogging attribute feature.
With the notations introduced above, we define our recommendation problem as follows. We consider a cross-site cold-start scenario: a microblogging user u0∈ U/ is new to the e-commerce website, who has no historical purchase records. It is easy to seeu0 ∈ U/ L, too, since we have UL ⊂ U. We aim to generate a personalised ranking of recommended products for u0 based on her microblogging attributesau0.
2.http://weibo.com
3.http://www.jd.com
Due to the heterogeneous nature between these two different data signals, information extracted from microblogging services cannot usually be used di-rectly for product recommendation on e-commerce websites. Therefore, one major challenge is how to transform users’ microblogging attribute information
au0 into another feature representationvu0, which can
be used more effectively for product recommendation. Here, we call au0 the original or microblogging feature
representationandvu0 the (heterogeneous) transformed
feature representation, respectively.
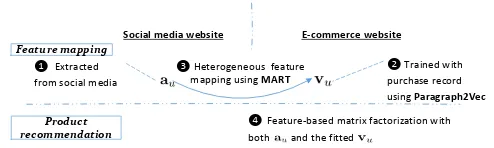
Next, we will study how to extract microblogging features and transform them into a distributed fea-ture representation before presenting a feafea-ture-based matrix factorization approach, which incorporates the learned distributed feature representations for prod-uct recommendation. The entire workflow of our so-lution is shown in Figure 1 which consists of four major steps splitting intofeature mapping and product recommendation, which will be discussed in Section 3 and 4 respectively.
Social media website E-commerce website
❶ Extracted from social media
❷ Trained with purchase record using Paragraph2Vec Feature mapping
Product recommendation
❹Feature-based matrix factorization with both and the fitted
[image:3.567.289.536.326.400.2]❸ Heterogeneous feature mapping using MART
Fig. 1. The workflow diagram for our presented solu-tion.
3
E
XTRACTING ANDR
EPRESENTINGM
I-CROBLOGGING
A
TTRIBUTESOur solution to microblogging feature learning con-sists of three steps:
• Prepare a list of potentially useful microblogging attributes and construct the microblogging fea-ture vectorau for each linked user u∈ UL; • Generate distributed feature representations
{vu}u∈U using the information from all the users
U on the e-commerce website through deep learning;
• Learn the mapping function,f(au)→vu, which transforms the microblogging attribute informa-tionau to the distributed feature representations
vu in the second step. It utilises the feature rep-resentation pairs {au,vu} of all the linked users
u∈ UL as training data.
3.1 Microblogging Feature Selection
Demographic Attributes
A demographic profile (often shortened as “a demo-graphic”) of a user such as sex, age and education can be used by e-commerce companies to provide better personalised services. We extract users’ demographic attributes from their public profiles on SINAWEIBO. Demographic attributes have been shown to be very important in marketing, especially in product adop-tion for consumers [4]. Following our previous study [5], we identify six major demographic attributes: gender, age, marital status, education, career and interests.To quantitatively measure these attributes, we have further discretized them into different bins following our previously proposed method described in [5].
Text Attributes
Recent studies have revealed that microblogs contain rich commercial intents of users [5], [9]. Also, users’ microblogs often reflect their opinions and interests towards certain topics. As such, we expect a potential correlation between text attributes and users’ pur-chase preferences.
We perform Chinese word segmentation and stop-word removal before extracting two types of text attributes below.
Topic distributions. Seroussi et al. ([6]) proposed to extract topics from user-generated text using the Latent Dirichlet Allocation (LDA) model for recom-mendation tasks. Follow the same idea, we first ag-gregate all the microblogs by a user into a document, and then run the standard LDA to obtain the topic distributions for each user. The benefits of topics distributions over keywords are two fold. First, the number of topics is usually set to50∼200in practice, which largely reduces the number of dimensions to work with. Second, topic models generate condense and meaningful semantic units, which are easier to interpret and understand than keywords.
Word embeddings. Standard topic models assume individual words are exchangeable, which is essen-tially the same as thebag-of-words model assumption. Word representations or embeddings learned using neural language models help addressing the prob-lem of traditional bag-of-word approaches which fail to capture words’ contextual semantics [7], [8]. In word embeddings, each dimension represents a latent feature of the word and semantically similar words are close in the latent space. We employ the Skip-gram model implemented by the tool word2vec4 to
learn distributed representations of words. Finally, we average the word vectors of all the tokens in a user’s published document as the user’s embedding vector.
Network Attributes
In the online social media space, it is often observed that users connected with each other (e.g., through
4.https://code.google.com/p/word2vec
following links) are likely to share similar interests. As such, we can parse out latent user groups by the users’ following patterns assuming that users in the same group share similar purchase preferences. Latent group preference. Since it is infeasible to consider all users on WEIBO and only keeping the top users with the most followers would potentially miss interesting information, we propose to use topic models to learn latent groups of followings as in [10]. We treat a following user as a token and aggregate all the followings of a user as an individual document. In this way, we can extract latent user groups sharing similar interests (called “following topics”), and we represent each user as a preference distribution over these latent groups.
Temporal Attributes
Temporal activity patterns are also considered since they reflect the living habits and lifestyles of the microblogging users to some extent. As such, there might exist correlations between temporal activities patterns and users’ purchase preferences.
Temporal activity distributions. We consider two types of temporal activity distributions, namely daily activity distributions and weekly activity distribution-s. The daily activity distribution of a user is charac-terised by a distribution of 24 ratios, and thei-th ratio indicates the average proportion of tweets published within the i-th hour of a day by the user; similarly
weekly activity distribution of a user is characterised by a distribution of seven ratios, and the i-th ratio indicates the average proportion of tweets published within thei-th day of a week by the user.
We summarize all types of features in Table 1.
TABLE 1
Categorisation of the microblogging features. The number of feature dimensions are shown in
parentheses.
Categories Features
Demographic Gender (2), Age (6), Marital status (10),
Attributes Education (7), Career (9), Interests (6)
Text Topic distributions (50),
Attributes Word embeddings (50)
Network Attributes Latent group preference (50)
Temporal Daily activity distribution (24),
Attributes Weekly activity distribution (7)
3.2 Distributed Representation Learning With Re-current Neutral Networks
Inspired by the recently proposed methods in learning word embeddings using recurrent neutral networks [7], [8], we propose to learn user embeddings or distributed representation of uservuin a similar way.
Learning Product Embeddings
Before presenting how to learn user embeddings, we first discuss how to learn product embeddings. The neural network methods, word2vec, proposed in [7], [8] for word embedding learning can be used to model various types of sequential data. The core idea can be summarised as follows. Given a set of symbol sequences, a fixed-length vector representation for each symbol can be learned in a latent space by exploiting the context information among symbols, in which “similar” symbols will be mapped to nearby positions. If we treat each product ID as a word token, and convert the historical purchase records of a user into a timestamped sequence, we can then use the same methods to learn product embeddings. Unlike matrix factorization, the order of historical purchases from a user can be naturally captured.
We consider two simple recurrent neutral archi-tectures proposed in [12] to train product embed-dings, namely, the Continuous Bag-Of-Words model (CBOW) and the Skip-gram model. The major differ-ence between these two architectures lies in the direc-tion of predicdirec-tion: CBOW predicts the current product using the surrounding context, i.e., P r(pt|context), while Skip-gram predicts the context with the current product, i.e., P r(context|pt). In our experiments, the context is defined as a window of size 4 surround-ing a target product pt which contains two products purchased before and two after pt. More formally, each product pt is modeled as a unique latent em-bedding vectorvpt, and the associated context vector is obtained to average the vectors of the context information as vcontext. For CBOW, the conditional prediction probability is characterized by a softmax function as follows
P r(pt|context) =
exp(v>pt·vcontext)
P
pexp(v>p ·vcontext)
.
To optimize for computing exponential sum proba-bilities,hierarchical softmaxand negative sampling tech-niques are commonly used to speed up the training process. At each training iteration, we sample a target product together with their context window, and then update the parameters with Stochastic Gradient De-scent (SGD) using the gradients derived by backpro-pogation. Learning for Skip-gram is done in a similar way, which is omitted here.
Learning User Embeddings
Given product embeddings, if we can learn user embeddings in a similar way, then we can explore the correlated representations of a user and products for
product recommendation. We borrow the idea from the recently proposed Paragraph Vector (para2vec)
method [8], which learns feature representations from variable-length pieces of texts, including sentences, paragraphs, and documents. We implement a sim-plified version of para2vec at the sentence level as follows. The purchase history of a user can be con-sidered as a “sentence” consisting of a sequence of product IDs as word tokens. A user ID is placed at the beginning of each sentence, and both user IDs and product IDs are treated as word tokens in a vo-cabulary in the learning process. During training, for each sentence, the sliding context window will always include the first word (i.e., user ID) in the sentence. In this way, a user ID is essentially always associated with a set of her purchase records (a context window of 4 products at a time). We can then use the same learning procedure inword2vectorfor the estimation ofP r(context|pt)andP r(pt|context). We present an il-lustrative example of these two architectures in Fig. 2. After learning, we separate user embeddings from product embeddings and use vu and vp to denote the learnt K-dimensional embedding for useru and productprespectively.
The rationales of applyingpara2vecto model pur-chase data can be explained below. First, the user embedding representation for each user ID reflects the users’ personalized purchase preference; Second, the surrounding context, i.e., product purchases, is used to capture the shared purchase patterns among users. Compared to the traditional matrix factorization [14], the (window-based) sequential context is additionally modeled in addition to user preference, which is expected to potentially yield better recommendation results.
INPUT Projection OUTPUT
Pt-2
Pt-1
Pt+1
Pt+2
Pt
INPUT Projection OUTPUT
Pt-2
Pt-1
Pt+1
Pt+2
Pt
(b) Skip-Gram (a) CBOW
u u
Fig. 2. Two architectures to learn both product and user embeddings. Hereudenote a user ID. The major difference between para2vec and word2vec lies in the incorporation of user ID as additional context.
3.3 Heterogenous Representation Mapping using Gradient Boosting Regression Trees
[image:5.567.305.517.492.602.2]a distributed representation vu from an e-commerce website respectively. In the cross-site cold-start prod-uct recommendation problem we considered in this paper (i.e., make a product recommendation to a user uwho has never purchased any products from an e-commerce website), we can only obtain the microblog-ging feature vectoraufor useru. The key idea is to use a small number of linked users across sites as a bridge to learn a function which maps the original feature representationauto the distributed representationvu. Specifically, we can construct a training set consisting of feature vector pairs, {au,vu}u∈UL and cast the feature mapping problem as a supervised regression task: the input is a microblogging feature vector au and the output is a distributed feature vectorvu.
Assume thatvucontainsKdimensions, we need to learn a set ofK functions{f(i)}K
i=1, and thei-th
func-tion f(i) takes the original feature vector of a user u as the input and returns the correspondingi-th trans-formed feature value vu,i, i.e., vu,i = f(i)(a(u)). We extend the Multiple Additive Regression Tree (MART) [15] method to learn feature mapping functions since it is powerful to capture higher-order transformation relationship between input and output.
A brief Introduction of MART
Gradient boosting algorithms aim to produce an en-semble of weak models that together form a strong model in a stage-wise process. Typically, a weak mod-el is aJ-terminal node Classification And Regression Tree (CART) [16] and the resulting gradient boosting algorithm is called Multiple Additive Regression Tree (MART) [15]. An input feature vector x ∈ Rd is mapped to a scoreF(x)∈R.
The final model is built in a stage-wise process by performing gradient descent in the function space. At themth boosting,
Fm(x) =Fm−1(x) +ηρmhm(x;a), (1)
where each hm(·) is a function parameterised by
am, ρm ∈ R is the weight associated with the mth function, and 0 < η ≤ 1 is the learning rate. The learning procedure of gradient boosting consists of two alternative steps in the m-th iteration: first fit a new component function hm by using the steepest-descent method, and then minimize the loss function to derive the ensemble weightρmfor the learnt learn-er. At each iteration, we use the regularized squared error function to learn a new CART component: we first derive a set of disjoint regions{Rj}which covers the space of all the joint values of the input feature vector, and then set the region fitting coefficient forRj to the average of “pseudo responses” of the instances falling inRj.
Completeness-Based Feature Sampling
An issue about the gradient boosting algorithm is that it tends to overfit the training data. It has been
previously shown that the incorporation of random-ized feature sampling improves the tree based ensem-ble methods in Random Forest [17]. Inspired by the idea, we propose to use an attribute-level importance sampling method where each attribute is assigned with an importance score and at each node split in building the MART trees, we only sample a fraction of attributes (empirically set to 2
3) based on each
attribute’s importance score instead of enumerating all the attributes. Once an attribute is sampled, its corresponding attribute value features will be selected subsequently. The importance score of each attribute is set to the proportion of the attribute values that can be extracted from the users’ public profiles on SINAWEIBO. Another benefit of completeness-based sampling is that attributes with a larger proportion of missing values will be more likely to be pushed to the leaf nodes, which alleviates the missing value problem in regression trees.
Fitting Refinement
Here we propose two methods to refine the fitted values. First, the fitting quality relies on the number of available linked users since insufficient training data would hurt the performance of the regression method. Recall that we can learn the user embeddings for all the users on an e-commerce website. We create a super user embedding vectorv(sup)by averaging all
available user embeddings. When the training data is limited, we require that the fitted vector should not deviate fromv(sup) too much.
Second, we fit each dimension separately with an individual MART model. Based on our data analysis, we found that the values of some dimensions from the same user might be correlated. We compute pairwise Pearson Correlation Coefficient (PCC) for every two dimensions using all the learnt user embeddings from the e-commerce website, and construct the correlation matrix WK×K, where each entry wi,j indicates the correlation degree between two dimensions. We con-vert all negative values to zero.
We then propose to take into account both methods to refine the initially fitted valuevu(0)in the following way
min X
k
(vu,k−v(0)u,k)2+µ1 X
k
(vu,k−vu,k(sup))2
+µ2 X
k,k0,k6=k0
wk,k0(vu,k−vu,k0)2, (2)
where µ1 and µ2 are the tuning parameters. The
parameterµ1 is used to “smooth” the data when the
number of training instances is small or a user has very little microblogging information. While in other cases,µ1can be simply set to a small value, e.g.,0.05.
For µ2, we have found a value of 0.05 usually gives
vu,k←
vu,k(0)+µ1v (sup)
u,k +µ2Pk0,k06=kwk,k0vu,k0
1 +µ1+µ2Pk0,k06=kwk,k0
. (3)
Summary
We have built a single learner for each dimension in the transformed feature representation vu using a modified gradient boosting trees model. The reason why we choose MART is that its components are regression trees, and trees are shown to be effective to generate high-order and interpretable knowledge using simple plain features [16], [18], [19]. Note other tree-based ensemble methods can apply here, such as Random Forest (RF)[17]. In our experiments, we have found MART is sightly better than RF, and therefore we adopt MART as the fitting model.
We have experimented with embedding vectors with or without normalization. Our preliminary re-sults showed that normalizing the vector to length one slightly hurts the performance. Thus, the original un-normalized embedding vectors are used in the subsequent steps.
4
A
PPLYINGT
HET
RANSFORMEDF
EA-TURES TO
C
OLD-S
TARTP
RODUCTR
ECOM-MENDATION
Once the MART learners are built for feature map-ping, the original microblogging feature vectorsauare mapped onto the user embeddingvu. In this section, we study how to incorporate{au,vu}into the feature-based matrix factorization technique. In specific, we develop our recommendation method based on the recently proposed SVDFeature [20]. Our idea can also be applied to other feature-based recommendation algorithms, such as Factorization Machines [21].
4.1 The General SVDFeature Framework for Prod-uct Recommendation
SVDFeature [20] is built based on the traditional matrix factorization approach, and it considers fac-torization in three aspects, namely global features (also called as dyadic features), user features and item features. It can be formulated for the task of product recommendation as follows
ˆ
ru,p(α(u),β(p),γ(u,p)) (4)
= µ+X
j
b(jG)γj(u,p)+X j
b(jU)α(ju)+X j
b(jP)β(jp)
+ X
j
α(ju)xj> X
j
β(jp)yj,
where α(u) ∈RNα, β(p) ∈
RNβ and γ(u,p) ∈
RNγ are the input vectors consisting of the features of user u, the features of product p and the global features for the pair(u, p)with the lengths ofNα,Nβ andNγ
respectively. Here,b(jG), bj(U) and b(jP) are the global, user and product bias parameters respectively. The latent vectorsxj andyj capture thej-th user feature and thej-th product feature respectively. Let{xj}and
{yj} denote the set of all user features and product features respectively. Note that{xj}are shared by all the users,{yj}are shared by all the products, and the global features and bias values do not have any corre-sponding latent vectors. In summary, a user-product pair corresponds to a feature vector concatenated by global features, user features and product features. The response value to be fitted indicates whether the user has purchased the product or not.
Feature Coding with the Side Information
We discuss how to incorporate the user and product information into the SVDFeature framework.
Coding users and products: For users, we reserve the first|U |dimensions in the user input vector. Each useruis coded as a vector of |U |-dimensional vector consists of a “1” in the uth dimension and “0” in other dimensions; Similarly, we can reserve the first
|P| dimensions in the product input vector to code the products. Formally, we have
α(ju)= (
1, j=u;
0, j6=u. β
(p)
j =
(
1, j=p; 0, j6=p.
Coding microblogging attributes: Given a user u, we use the dimensions from(|U |+ 1)-th to(|U |+|A|) -th to code her microblogging attribute vectorau. For
i = 1 to |A|, we have α(|U |u)+i = au,i. Here we follow [22] to directly incorporate microblogging attributes. In practice, a subset of featuresA0 can be identified with expertise knowledge instead of using the full set of features inA.
Coding user embeddings: Given a user u, we use the dimensions from(|U |+|A|+1)-th to(|U |+|A|+K) -th to code her distributed feature vector (user embed-ding)vu. For k= 1 toK, we haveα
(u)
|U |+k=vu,k.
Coding product embeddings: Given a product p, we use the dimensions from(|P|+ 1)-th to(|P|+K) -th to code -the product embeddingvp. Fork= 1toK, we haveβ|P|(p)+k=vp,k.
Coding the global user-product feature: Since we have both user embeddings and product embeddings, we can incorporate a global feature to denote a simi-larity degree between a user and a product. The idea is that a user is more likely to buy a product which is closer in the unified latent feature space, therefore the corresponding entry should receive a larger global bias value. We define a global feature as follows
γ1(u,p)=sim(vu,vp),
With these coded features, for a user-product pair
(u, p), we have the following factorization formula
ˆ
ru,p(α(u),β(p),γ(u,p)) (5)
= µ+b(1G)γ (u,p)
1 +
X
j
b(jU)α (u)
j +
X
j
b(jP)β (p)
j +
xu+
|A|
X
i=1
au,ixi+ K X
k=1
vu,kxk >
yp+ K X
k=1
vp,kyk
.
We use Θ to denote the parameters to learn,
µ, b1(G),{bj(U),xj},{b (P) j ,yj} 5.
Parameter Learning
We employ the pairwise ranking model for parameter learning. Given a user u, we generate the positive-negative pairs of products (p, p0) in which u has purchased p (called positive) but not p0 (called nega-tive). The pairwise ranking model assumes that the fitted value for the purchased product is larger than the one that has not been purchased by a user, i.e., P r(ˆru,p > rˆu,p0). Furthermore, we use the sigmoid
function as the loss function
P r(ˆru,p>ˆru,p0) = 1
1 +e−(ˆru,p−rˆu,p0).
Note that for pairwise ranking, we do not need to learn the user bias parameters{b(jU)}. With the above partial-order rank probability function, the overall regularized ranking loss function can be written as follows
L = −X
u∈U
X
(p,p0)∈Du
log 1
1 +e−(ˆru,p−ˆru,p0) + X
j
λ1kxjk22
+X
j
λ2kyjk22+λ3kb(1G)k 2
2+λ4
X
j
kb(jP)k2 2,
whereDudenotes the positive-negative pairs for user
u, andλs are the coefficients for ridge regularization. By minizing the loss functionL, we use the stochastic gradient descent method (SGD) to learn the mod-el parameters. Given a training instance consisting of a user u and a positive-negative pair (p, p0), the derivatives at this instance for updating the model parameters are presented as follows
5.In order to simplify our notations, we usexito denotex|U |+i,xkto
denotex|U |+|A|+kandykto denotey|P|+k.
∂L ∂xu
= −eup>p0
∆yp,p0+
K X
k0=1
yk0∆vp,p0,k0
+ 2λ1xu,
∂L ∂xi
= −au,ieup>p0
∆yp,p0+
K X
k0=1
yk0∆vp,p0,k0
+ 2λ1xi,
∂L ∂xk
= −vu,keup>p0
∆yp,p0+
K X
k0=1
yk0∆vp,p0,k0
+ 2λ1xk,
∂L ∂yp
= −eup>p0¯xu+ 2λ2yp, ∂L
∂yp0
= eup>p0¯xu+ 2λ2yp0, ∂L
∂yk
= −eup>p0 vp,kx¯u−vp0,k¯x u+ 2λ
2yk, ∂L
∂b(1G)
= −eup>p0 γ1(u,p)−γ(1u,p0)
+ 2λ3b(1G),
∂L ∂b(jP)
= −eup>p0 βj(p)−β(p 0)
j + 2λ
4b(jP),
where ∆yp,p0 = yp−yp0, ∆vp,p0,k0 = vp,k0 −vp0,k0,
eup>p0 = 1−P r(ˆru,p>rˆu,p0), ¯xu=xu+P|A|i=1au,ixi+
PK
k=1vu,kxk and ¯yp=yp+P K
k=1vp,kyk.
Applications in Cold-Start Product Recommendation
With the learnt models, we can recommend products from e-commerce websites to users in online social networking websites. In this scenario, the only in-formation available is the microblogging features of users, i.e.,au. Using MART, we can derive the fitted user embeddings, i.e., vˆu = f(au). We consider the following variants to rank candidate products with our proposed methods:
• Only with the fitted user embeddings
ˆ
ru,p=bias+ K
X
k=1 ˆ
vu,kxk >
yp+ K X
k=1
vp,kyk
, (6)
• With both the fitted user embeddings and mi-croblogging feature vectors
ˆ
ru,p=bias+ |A|
X
i=1
au,ixi+ K X
k=1 ˆ
vu,kxk >
yp+ K X
k=1
vp,kyk
,
(7) wherebias=b(G)·simcos(ˆvu,vp) +b
(P)
p . Note that all the above ranking formulae do not use the user latent vectorxu. In another words, we do not require users made any purchases before recommending products to them. Thus, our proposed recommendation frame-work can be applied for cold-start recommendation.
5
E
XPERIMENTSWe present experimental setup first before discussing our results.
5.1 Experimental Setup
Our task requires data from both an e-commerce website and an online social networking site.
transaction records from 12 million users on 0.2 mil-lion products. Each transaction record consists of a user ID, a product ID and the purchase timestamp. We first group transaction records by user IDs and then obtain a list of purchased products for each user. Microblogging data.We used our previous data [5] collected from the largest Chinese microblogging site SINA WEIBO, in which we have retrieved a total of 1.7 billion tweets from 5 million active users within a half-year time span from January 2013 to June 2013.
User linkage. We have found that WEIBO users sometimes shared their purchase record on their mi-croblogs via a system-generated short URL, which links to the corresponding product entry on JING-DONG. By following the URL link, we can obtain the JINGDONG account of the WEIBO user6. We identi-fied 23,917 linked users out of 5 million active users by scanning tweets in this way. We first filter out 3,279 users with too little information on their WEIBO public profiles. Next, we further divide users into two groups. The first group contains users with more than five product purchases, denote as Ddense. The second group contains the remaining users, denoted as Dsparse. The statistics of these linked users are summarized in Table 2. For privacy consideration, all the WEIBO IDs and JINGDONG IDs of all linked users are replaced by anonymized unique IDs, and all their textual information and purchase information is encoded with numeric symbols.
TABLE 2
Statistics of our linked user datasets.
Datasets #users #products #productsAverage Average#tweets
Ddense 15,853 98,900 52.0 41.0
Dsparse 4,785 6,699 2.6 35.7
5.2 Evaluation on User Embeddings Fitting
Given a linked useru∈ UL, we have the microblog-ging feature vectorau extracted from WEIBO and the user embedding vu learnt based on her JINGDONG purchase record. We use a regression-based approach to fit vu with au for heterogeneous feature mapping, and the fitted vector is denoted as vˆu. To examine the effectiveness of the regression performance, the Mean Absolute Error (MAE ) is used as the evaluation metric
M AE= 1
|T |
X
u∈T
PK
k=1|vu,k−vˆu,k| K
, (8)
where |T | is the number of test users. We consider three different comparison methods: (1) CART [16]; (2) MARTold, which is the original implementation
6.Note that when a user shares a purchase record on her microblog, she
will be notified automatically by SINAWEIBOthat her JINGDONGaccount
would be exposed to the public.
as in [15]; (3) MARTsample, which is our modified implementation with feature sampling; (4) MARTboth, which is our modified implementation with feature sampling and fitting refinement.
For user embedding fitting, we useDdensefor eval-uation, since the users in Ddense have a considerable number of purchases for learning the ground truth us-er embeddings using our modifiedpara2vecmethod, which are more reliable for evaluation. The dataset
Ddense is split by users into training set and test set with three different ##traintest ratios, namely 1:1, 1:4 and 1:9. We use a similar evaluation method as N-fold cross validation. Given the ##traintest ratio of1 :N, each fold will be treated as the training data exactly once and the restN −1 folds are treated as the test data, the process will be repeated N times and the final results are averaged over N such runs. The number of boosting iterations for all MART variants and the values of µ1 and µ2 for MARTboth are optimized by
N-fold cross validation.
In Table 3, we can see that when the training data is relatively large (ratio 1:1), all the MART variants give similar results and they perform consistently better than the simple CART. Interestingly, when the size of training data becomes smaller, MARTsample and MARTboth outperforms MARTold. In specific, the performance gain achieved by MARTboth over the other two MART variants is more significant with smaller set of training data. These results show that our modifications of feature sampling and fitting re-finement are very effective.
TABLE 3
Performance comparisons of MAE results for fitting user embeddings onDdense. Smaller is better.
#train
#test CART MARTold MARTsample MARTboth
1/1 0.557 0.515 0.515 0.515
1/4 0.557 0.522 0.521 0.521
1/9 0.564 0.589 0.558 0.529
Relative attribute importance. Tree-based methods offer additional feasibility to learn relative importance of each attribute. Inspired by the method introduced in [15], we calculate a statistic of the relative impor-tance of each attribute for MART based on the training data. Recall that in MART, each feature corresponds to an attribute value. First, we traverse through all the regression trees, and calculate for each feature its contribution to the cost function by adding up the contributions of all the nodes that are split by this feature. Here we define feature contribution to be the reduction of the squared error in the loss function. For each attribute, we can sum up the contributions of all of its possible attribute values as its overall contribution.
the top two rank positions7; 2) Within the
demograph-ic category, Gender and Interests are more important than the others. 3) The social based attributes are ranked relatively lower compared to the other two categories. It seems that demographic attributes are less important than text attributes in our dataset. One possible reason is that many demographic attribute values are missing in users’ public profiles on WEIBO.8
Nevertheless, the ranking of relative importance of attributes does not entirely depend on their com-pleteness proportion. For example, Interests is more important thanLatent group preferenceeven though the later has a larger completeness proportion. Another possible reason is that the feature dimension for text attributes is much larger than that of demographic at-tributes, e.g.,Topic Distributionhas fifty feature dimen-sions whileGender only has two feature dimensions.
0 20 40 60 80 100 Marital status Career
Educa5on Weekly ac5vity distribu5on Age Daily ac5vity distribu5on Latent group preference Interests Gender Word embedding Topic distribu5on
Fig. 3. Relative attribute importance ranking (corre-sponding to the features in Table 1).
We can also evaluate the importance of each at-tribute by conducting experiments on the traditional product recommendation task. We use the standard MF approach as a baseline and add attributes one at a time using the SVDFeature framework discussed in Section 4.1, then check the performance improvement yielded by the added attribute. The attribute ranking obtained in this way is similar to the ranking in Fig. 3, but the gap between text attributes and demographic attributes becomes smaller.
5.3 Evaluation on Cold-Start Product Recommen-dation
For cold-start product recommendation, we aim to recommend products to microblog users without the
7.Although both topic distribution and word embedding are used to capture the semantic characteristics of user generated text, they have different focuses. Topic distribution is more suitable to extract general topical semantics while word embedding is more suitable to capture the semantic association between words. Hence, we keep both types of text features in our approach. Especially, our method is a tree-based approach, which can effectively reduce the information redundancy between features, i.e., if a feature contains redundant information given the tree that is being constructed, it will be pushed into a lower position in the attribute selection.
8. In our dataset, the completeness proportion of demographic attributes are as follows: Gender (100%), Interests (65.7%), Age (36.7%), Education (26.3%), Career (12.9%) and Marital status (4.6%); while for text and network attributes, the proportion of completeness is about 99.1%, i.e., most users have published tweets and followed some other users.
knowledge of their historical purchase records.
Construction of the Evaluation Set
The evaluation set splits users into training set and test set. For the training set, we sample negative prod-ucts with a ratio of 1:1 for each user, i.e., we have the same number of negative and positive products. For the test set, we randomly sample negative products with a ratio of 1:50 for each user, i.e., each positive product would involve 50 negative products. All neg-ative products are sampled from the same product category as the corresponding positive one. For exam-ple, for “iPhone 6”, we can sample “Samsung Galaxy S5” from the “Mobile Phones” category as a negative product. We follow the frequency based sampling method in [7] to generate the negative products, in which a (un-purchased) popular product is more like-ly to be selected as a negative product.Given a user, we can generate a list of candidate products consisting of both positive and negative products. On average, a user has about 52 positive products and 2,600 negative products in our experimental dataset, which is indeed a challenging task. Similar to the evaluation scenario in Information Retrieval, we would like to examine the performance that a system ranks positive products over negative products.
Methods to Compare
We consider the following methods for performance comparison:
• Popularity (Pop): products are ranked by their historical sale volumes.
• Popularity with Semantic Similarity (Pop++): the ranking score is a combination of two scores: (1) the popularity scoreS1; (2) the cosine
similar-ityS2 between product description and user text
information, including profile, tweets and tags. The two scores are combined bylog(1 +S1)×S2.
• Embedding Similarities (ES): Similarity scores
ˆ
v>u · vp between a user embedding vˆu and a list of product embeddings vp are used to rank products.
• MF with user attributes (MFUA): User attributes (including user profile and topic distributions) are incorporated into the basic matrix factori-sation algorithm for product rating prediction [6]. For fairness, we also use the pairwise loss function to train the model.
[image:10.567.46.264.275.371.2]• ColdE: Our proposed approach which uses the fitted user embedding features and product em-bedding features (Eq. 6).
• ColdD+E: Our proposed approach which uses the microblogging features, the product embedding features and the fitted user embedding features (Eq. 7). Especially, we only use demographic attributes here, since they have been shown im-portant to product recommendation [23], [5]. • Cold++: Since the user and product embeddings
can be learned for all the users and products respectively in the e-commerce website, we can train ColdE with all the users in U, not limited to the linked users UL. This variant is called Coldenhanced.
We set the regularization coefficient to a 0.004, the iteration number to 50 and the factor number to 32 for all the methods. We use theCBOWarchitecture to learn the embedding vectors based on the purchase records from all the non-linked users and the partial purchase records from linked users in our training set. The number of dimensions of embedding vectors is set to 50. The user embedding features in the test sets for different #training#test settings are set to the values fitted using MARTboth. For Coldenhanced, we add additional 10,000 randomly selected non-linked users from U
into the training set.
Evaluation Metrics for Product Recommendation
Five widely used metrics are used for the evalua-tion of product recommendaevalua-tion results, including P recision@k,Recall@k, the Mean Average Precision (MAP), the Mean Reciprocal Rank (MRR) and the Area Under roc Curve (AUC).
Experimental Results onDdense
We first evaluate the performance of product recom-mendation onDdense, whereδ%linked users are used as the training data, and the remaining (100−δ)%
linked users as the test data. To examine the perfor-mance with varying amount of training data, we setδ to 80, 50, 20 and 10, which correspond to the #training#test Split Ratios (SR) of 4:1, 1:1, 1:4 and 1:9 respectively.
The results of different methods for overall product recommendation are presented in Table 5. It can be observed that:
• Apart from the simple baselinePopularity, which does not rely on any training data, the perfor-mance of all other methods improves with the increasing size of the training data. Popularity
[image:11.567.291.524.118.394.2]appears to be a competitive baseline for cold-start recommendation due to the fact that negative products are selected from the same product cat-egories as the positive ones. By incorporating the semantic similarity between users and products, it leads to negligible performance change, which indicates the simple surface similarity cannot well capture the purchase preferences.
TABLE 4
Performance comparisons of different methods on cold-start product recommendation.∗indicates that our Cold method is significantly better than the best
baseline at the level of 0.01.
SR Methods P@10 R@50 MAP MRR AUC
4:1
Pop 0.175 0.215 0.120 0.380 0.669
Pop++ 0.175 0.215 0.120 0.380 0.669
ES 0.117 0.195 0.115 0.267 0.653
MFUA 0.212 0.245 0.136 0.495 0.701
FMUI 0.226 0.253 0.145 0.502 0.730
ColdE 0.237 0.265 0.155 0.512 0.751
ColdD+E 0.243∗ 0.270∗ 0.159∗ 0.527∗ 0.771∗
Cold++ 0.239 0.261 0.157 0.517 0.763
1:1
Pop 0.175 0.215 0.120 0.380 0.669
Pop++ 0.175 0.215 0.120 0.380 0.669
ES 0.117 0.195 0.115 0.267 0.653
MFUA 0.210 0.240 0.130 0.469 0.681
FMUI 0.215 0.241 0.125 0.481 0.687
ColdE 0.222 0.251 0.142 0.484 0.724
ColdD+E 0.229∗ 0.257∗ 0.146∗ 0.508∗ 0.734∗
Cold++ 0.226 0.255 0.146 0.497 0.730
1:4
Pop 0.175 0.215 0.120 0.380 0.669
Pop++ 0.175 0.215 0.120 0.380 0.669
ES 0.117 0.195 0.115 0.267 0.653
MFUA 0.202 0.231 0.126 0.449 0.693
FMUI 0.186 0.225 0.131 0.389 0.670
ColdE 0.216 0.243 0.137 0.475 0.700
ColdD+E 0.218 0.248 0.137 0.477 0.705
Cold++ 0.220∗ 0.249∗ 0.140∗ 0.484∗ 0.715∗
1:9
Pop 0.175 0.215 0.120 0.380 0.669
Pop++ 0.175 0.215 0.120 0.380 0.669
ES 0.117 0.195 0.115 0.267 0.653
MFUA 0.193 0.230 0.118 0.439 0.678
FMUI 0.172 0.225 0.117 0.411 0.668
ColdE 0.205 0.234 0.128 0.461 0.683
ColdD+E 0.206 0.238 0.129 0.473 0.685
Cold++ 0.217∗ 0.245∗ 0.138∗ 0.482∗ 0.695∗
• FMUIperforms better thanMFUAon the dataset with the split ratios of 1:1 and 4:1, but is worse with the other two ratios. A possible reason is that FMUI involves all the microblogging at-tributes and thus potentially requires more ing data for a better performance. When the train-ing data is limited, FMUI cannot gather sufficient statistics for some microblogging attributes due to data sparsity.
• Our proposedCold variants are consistently bet-ter than the baselines. Inbet-terestingly, Coldenhanced is not sensitive to the amount of training da-ta, which gives rather stable performance across all the three ratios. By incorporating additional demographic attributes, ColdD+E is consistently better than ColdE, and the improvement seems more significant when the training data is abun-dant (at the ratio of 1:1). When the training data is limited, Cold++ outperforms all the other
methods. But with more training data, it performs slightly worse than ColdD+E.
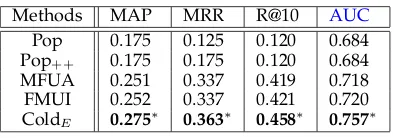
Experimental Results onDsparse
also be capable of generating recommendations for these users. We use the users inDdenseas the training data for both user embedding fitting and matrix fac-torization learning, and consider the users inDsparse as the test data for product recommendation. Since the users in Dsparse have fewer than five purchases, we only report the performance of Recall@k but not P recision@k. We also use MAP, MRR and AUC as evaluation metrics. We can observe from Table 5 that our proposed method ColdE is consistently better than all the baselines, which indicates that the effectiveness of recommendation for long-tail users.
TABLE 5
Performance comparisons of different methods on cold-start product recommendation onDsparse.∗
indicates that ColdE is significantly better than the
best baseline at the level of 0.01.
Methods MAP MRR R@10 AUC Pop 0.175 0.125 0.120 0.684 Pop++ 0.175 0.175 0.120 0.684
MFUA 0.251 0.337 0.419 0.718 FMUI 0.252 0.337 0.421 0.720 ColdE 0.275∗ 0.363∗ 0.458∗ 0.757∗
Scalability Analysis
We present the scalability analysis for our model ColdE.9 We first analyze the time complexity for both offline parameter training and online product recommendation. For offline parameter training, the cost of training the MART models is Ntree×C¯tree, where Ntree is the number of trees and C¯tree is the average cost for generating a decision regression tree. Then, the SGD method to train ColdE has the computational complexity of O(nLF¯|D|), where n is the iteration number, L is the number of latent factors,F¯ is the average number of non-zero features for a training instance and |D| is the training data size. In practice, we have found that SGD converges quickly and usually converges in 30−50 iterations on our training set. Foronline product recommendation, when a new user arrivees, we first generate the fitted user embedding features, at most incurring a cost of hmax×Ntree, wherehmaxis the maximum tree height. When making recommendation, we use Eq. 6 to score each candidate product. In Eq. 6, a user incurs a cost of K×L additions and K multiplications to derive
PK
k=1ˆvu,kxk and a cost of L multiplications and L additions for dot product, whileyp+P
K
k=1vp,kyk for all the products are pre-computed. To generate recom-mendation, we further need a cost ofNlist×logNlist for ranking candidate products for a user, whereNlist is the length of candidate product list.
9. TheColdmodel is implemented in C++ and the MART model is implemented in JAVA. We run the program (single-thread) in the server with Intel(R) Xeon(R) CPU E5-2620 v2 2.10GHz and Ubuntu 14.04 LTS.
While for space complexity, our major cost consists of space for MART models and latent factors. MART models take up a cost of O( ¯Nnode×C¯node×Ntree), where N¯node and Cnode denotes the average number of nodes in a MART tree and the average space cost for a single node respectively. We have a cost of
(|U |+|P|+K)×Lto store latent factors. Compared to traditional matrix factorization, it incurs an additional cost ofK×L. In practice,Kis usually set to 50∼200. We summarize the time and space cost for ColdE in Table 6.10 It can be observed that our method is very
[image:12.567.58.255.275.344.2]efficient in online recommendation. When dealing with extremely large datasets, the training process can be performed in a distributed way by using SGD, and the test process can still be efficient since it only involves the MART tree traversal and latent vector operations.
TABLE 6
Running time and memory costs for our approach on Ddensewith the split ##traintest ratio of 1:1.
Phases #users Time (sec.) Space (MB)
Training 7,927 563 (MART) 4.67 (MART) 304 (ColdE) 15.72 (ColdE)
Test 7,926 13.8 (MART)5.1 (Cold 4.67 (MART)
E) 15.72 (ColdE)
Parameter Analysis
[image:12.567.296.517.560.645.2]For our methods, an important component is the recurrent neutral networks, which can be set to two simple architectures, namely CBOW and Skip-gram. We present the comparison results of our method ColdE using these two architectures in Table 7. We can see that the performance of using Skip-gram is slightly worse than that of using CBOW11
TABLE 7
Performance comparisons of ColdEusing two
different architectures.
#training
#test Architectures P@10 MAP MRR
1:1 CBOW 0.222 0.142 0.484 Skip 0.220 0.138 0.472 1:4 CBOW 0.216 0.137 0.475 Skip 0.213 0.133 0.462 1:9 CBOW 0.205 0.128 0.461 Skip 0.204 0.123 0.458
10. For each user, we consider a candidate list of m positive product and 50×m negative products, where m is the actual number of purchases.
We also examine how the performance varies with different number of embedding dimensions from 50 to 150 with a gap of 25. We observe that the performance is relatively stable with the varying number of em-bedding dimensions. This is not surprising since the MART models fit each dimension independently. The optimal performance ofColdEwas obtained when the dimension number is 100, which is only slightly better than that of 50. Thus, using 50 embedding dimensions would be sufficient for our recommendation tasks considering the trade-off between performance and computational complexity.
For matrix factorization methods, an important pa-rameter to set is the number of latent factors. We use ColdE and MFUA as a comparison and vary the number of latent factors from 16 to 80 with a gap of 16. The performance of two methods is relatively stable with different numbers of latent factors, and ColdE is consistently better than MFUA.
5.4 Revisiting the Effectiveness of the Distributed Representations of Users and Products
In the previous section, we have shown that the learnt product and users embeddings are effective to improve the recommendation performance. In this section, we give more insights into the effectiveness of the distributed representations.
Insights into Product Embeddings
First, we take the learnt product embeddings to con-duct a quantitative similarity analysis in order to find out whether the learned product embeddings can discriminate products from different categories or brands. We compute the average similarity score be-tween product pairs from (1) different categories and brands (DCDB); (2) same category but different brand-s (SCDB); and (3) brand-same category and brand-same brand (SCSB). As it is infeasible to calculate the similarity scores for all possible product pairs in JINGDONG, we sample 10 million product pairs randomly for each type of product pairs for computation. The results are as follows: simDCDB= 0.0217, simSCDB= 0.2719and simSCSB = 0.4406. The average similarity score of simSCDB > simDCDB indicates the product embed-dings learned are indeed very different for products under different categories; while simSCSB>simSCDB indicates the product embeddings have a good dis-criminative power for brands12.
Insights into User Embeddings
We take the learnt user embeddings to conduct a quantitative similarity analysis in order to find out whether the learned user embeddings can identify users with similar purchase history.
Given a user u, we build two groups of users, denoted by GA
u and G B u.G
A
u contains the top K most
12.All the improvement is signifiant at the confidence level of 0.01.
similar users (a.k.a.K nearest neighbours) of user u, which are identified by the Jacarrd coefficient in terms of purchase history;GB
u containsKrandomly selected users. We would like to examine whether the user embedding vectors can discriminate a user inGA
u from another one inGB
u.
Given user u together with GA u and G
B
u, we can derive two similarity values sim(Au)and sim
(u) B , which are the average similarities with the users inGA
u and the users in GB
u respectively for user u. We use the cosine function to compute the similarity between two user embedding vectors. K is set to 30 in our experiments. In this way, we can obtain two arrays of similarity values{sim(Au)}u∈U and{sim
(u)
B }u∈U. By constructing the pairedt-test, the results have shown that the values in{sim(Au)}u∈U are significantly larger than those in {sim(Bu)}u∈U at the level of 0.001. The average similarities for {sim(Au)}u∈U and {sim
(u) B }u∈U are 0.090 and 0.031 respectively.
6
R
ELATEDW
ORKOur work is mainly related to three lines of research: Recommender systems. In recent years, the matrix fatortization approach [14], [24] has received much research interests. With the increasing volume of Web data, many studies focus on incorporating auxiliary information [25], [1], [26], [27], [28], [29], [30] into the matrix factorization approach. Two typical frame-works of such studies are the SVDFeature [20] and Factorization Machine [21].
There has also been a large body of research work focusing specifically on the cold-start recommenda-tion problem. Seroussi et al. [6] proposed to make use of the information from users’ public profiles and topics extracted from user-generated content into a matrix factorization model for new users’ rating pre-diction. Zhang et al. [31] propose a semi-supervised ensemble learning algorithm. Schein [32] proposed a method by combining content and collaborative data under a single probabilistic framework. Lin et al. [10] addressed the cold-start problem for App recommen-dation by using the social information from Twitter. Trevisiol et al. Zhou et al. [18] experimented with eliciting new user preferences using decision trees by querying users’ responses progressively through an initial interview process. Moshfeghi et al. [33] proposed a method for combining content features such as semantic and emotion information with rat-ings information for the recommendation task. Liu et al. [34] identified representative users whose linear combinations of tastes are able to approximate other users.
collective matrix factorization to estimate the relations of multiple entities by factorizing several matrices simultaneously while sharing parameters in the latent space. Li [38] attempted to transfer user-item rating patterns from an auxiliary matrix in another domain to the target domain through Codebooks. Hu [39] and Zhao [40] extended transfer learning to triadic factorization and active learning for cross-domain recommendation, respectively.
Social network mining. We follow the early com-mercial mining studies on social networking web-sites. Hollerit et al. [41] presented the first work on commercial intent detection in Twitter. Zhao et al. [5] first proposed to route products from e-commerce companies to microblogging users. Our work is also related to studies on automatic user profiling [42] and cross-site linkage inference [43].
Our work is built upon these studies, especially in the areas of cross-domain and cold-start recommenda-tion. Though sharing some similarities, we are dealing with a very specific task of highly practical value, cold-start product recommendation to microblogging users. To the best of our knowledge, it has not been studied on a large data set before. The most relevant studies are from [44], [45] by connecting users across eBay and Facebook. However, they only focus on brand- or category-level purchase preference based on a trained classifier, which cannot be directly applied to our cross-site cold-start product recommendation task. In addition, their features only include gender, age and Facebook likes, as opposed to a wide range of features explored in our approach. Lastly, they do not consider how to transfer heterogeneous information from social media websites into a form that is ready for use on the e-commerce side, which is the key to address the cross-site cold-start recommendation problem.
7
C
ONCLUSIONSIn this paper, we have studied a novel problem,
cross-site cold-start product recommendation, i.e., recom-mending products from e-commerce websites to mi-croblogging users without historical purchase records. Our main idea is that on the e-commerce websites, users and products can be represented in the same latent feature space through feature learning with the recurrent neural networks. Using a set of linked users across both e-commerce websites and social network-ing sites as a bridge, we can learn feature mappnetwork-ing functions using a modified gradient boosting trees method, which maps users’ attributes extracted from social networking sites onto feature representation-s learned from e-commerce webrepresentation-siterepresentation-s. The mapped user features can be effectively incorporated into a feature-based matrix factorisation approach for cold-start product recommendation. We have constructed a large dataset from WEIBOand JINGDONG. The results
show that our proposed framework is indeed effective in addressing the cross-site cold-start product recom-mendation problem. We believe that our study will have profound impact on both research and industry communities.
Currently, only a simple neutral network architec-ture has been employed for user and product embed-dings learning. In the future, more advanced deep learning models such as Convolutional Neural Net-works13 can be explored for feature learning. We will
also consider improving the current feature mapping method through ideas in transferring learning [35].
R
EFERENCES[1] J. Wang and Y. Zhang, “Opportunity model for e-commerce recommendation: Right product; right time,” inSIGIR, 2013. [2] M. Giering, “Retail sales prediction and item
recommenda-tions using customer demographics at store level,”SIGKDD Explor. Newsl., vol. 10, no. 2, Dec. 2008.
[3] G. Linden, B. Smith, and J. York, “Amazon.com recommen-dations: Item-to-item collaborative filtering,” IEEE Internet Computing, vol. 7, no. 1, Jan. 2003.
[4] V. A. Zeithaml, “The new demographics and market fragmen-tation,”Journal of Marketing, vol. 49, pp. 64–75, 1985. [5] W. X. Zhao, Y. Guo, Y. He, H. Jiang, Y. Wu, and X. Li, “We
know what you want to buy: a demographic-based system for product recommendation on microblogs,” inSIGKDD, 2014. [6] Y. Seroussi, F. Bohnert, and I. Zukerman, “Personalised rating
prediction for new users using latent factor models,” inACM HH, 2011.
[7] T. Mikolov, I. Sutskever, K. Chen, G. S. Corrado, and J. Dean, “Distributed representations of words and phrases and their compositionality,” inNIPS, 2013.
[8] Q. V. Le and T. Mikolov, “Distributed representations of sen-tences and documents,”CoRR, vol. abs/1405.4053, 2014. [9] J. Wang, W. X. Zhao, Y. He, and X. Li, “Leveraging product
adopter information from online reviews for product recom-mendation,” inICWSM, 2015.
[10] J. Lin, K. Sugiyama, M. Kan, and T. Chua, “Addressing cold-start in app recommendation: latent user models constructed from twitter followers,” inSIGIR, 2013.
[11] K. Y. C. Chung, T. P. Derdenger, and K. Srinivasan, “Economic value of celebrity endorsements: Tiger woods’ impact on sales of nike golf balls,”Marketing Science, vol. 32, no. 2, pp. 271–293, 2013.
[12] T. Mikolov, K. Chen, G. Corrado, and J. Dean, “Efficient estimation of word representations in vector space,”CoRR, vol. abs/1301.3781, 2013.
[13] S. G ¨uden and U. T. Gursoy, “Online shopping customer data analysis by using association rules and cluster analysis,” in ICDM, 2013, pp. 127–136.
[14] Y. Koren, R. Bell, and C. Volinsky, “Matrix factorization tech-niques for recommender systems,”Computer, vol. 42, no. 8, pp. 30–37, Aug. 2009.
[15] J. H. Friedman, “Greedy function approximation: A gradient boosting machine,”Annals of Statistics, vol. 29, pp. 1189–1232, 2000.
[16] L. Breiman, J. Friedman, R. Olshen, and C. Stone,Classification and Regression Trees. Monterey, CA: Wadsworth and Brooks, 1984.
[17] L. Breiman, “Random forests,”Mach. Learn., vol. 45, no. 1, Oct. 2001.
[18] K. Zhou, S. Yang, and H. Zha, “Functional matrix factoriza-tions for cold-start recommendation,” inSIGIR, 2011. [19] T. Chen, H. Li, Q. Yang, and Y. Yu, “General functional matrix
factorization using gradient boosting,” inICML, 2013. [20] T. Chen, W. Zhang, Q. Lu, K. Chen, Z. Zheng, and Y. Yu,
“SVDFeature: A toolkit for feature-based collaborative filter-ing,”Journal of Machine Learning Research, vol. 13, 2012.
[21] S. Rendle, “Factorization machines with libfm,”ACM Trans. Intell. Syst. Technol., vol. 3, no. 3, May 2012.
[22] ——, “Social network and click-through prediction with fac-torization machines,” inKDDCup, 2012.
[23] B. Xiao and I. Benbasat, “E-commerce product recommenda-tion agents: Use, characteristics, and impact.” MIS Quarterly, vol. 31, pp. 137–209, 2007.
[24] Y. Shi, X. Zhao, J. Wang, M. Larson, and A. Hanjalic, “Adaptive diversification of recommendation results via latent factor portfolio,” inSIGIR, 2012.
[25] L. Hong, A. S. Doumith, and B. D. Davison, “Co-factorization machines: Modeling user interests and predicting individual decisions in twitter,” inWSDM, 2013.
[26] P. Massa and P. Avesani, “Trust-aware recommender systems,” inACM RecSys, 2007.
[27] M. Jamali and M. Ester, “Trustwalker: a random walk model for combining trust-based and item-based recommendation,” inSIGKDD, 2009.
[28] J. Tang, H. Gao, H. Liu, and A. Das Sarma, “etrust: Under-standing trust evolution in an online world,” inSIGKDD, 2012. [29] H. Ma, T. C. Zhou, M. R. Lyu, and I. King, “Improving recommender systems by incorporating social contextual in-formation,”ACM Trans. Inf. Syst., vol. 29, no. 2, 2011. [30] Y. Zhang, G. Lai, M. Zhang, Y. Zhang, Y. Liu, and S. Ma,
“Explicit factor models for explainable recommendation based on phrase-level sentiment analysis,” inSIGIR, 2014.
[31] M. Zhang, J. Tang, X. Zhang, and X. Xue, “Addressing cold start in recommender systems: a semi-supervised co-training algorithm,” inSIGIR, 2014.
[32] A. I. Schein, A. Popescul, L. H. Ungar, and D. M. Pennock, “Methods and metrics for cold-start recommendations,” in SIGIR, 2002.
[33] Y. Moshfeghi, B. Piwowarski, and J. M. Jose, “Handling data sparsity in collaborative filtering using emotion and semantic based features,” inSIGIR, 2011.
[34] N. N. Liu, X. Meng, C. Liu, and Q. Yang, “Wisdom of the better few: cold start recommendation via representative based rating elicitation,” inACM RecSys, 2011.
[35] S. J. Pan and Q. Yang, “A survey on transfer learning,”IEEE TKDE, vol. 22, no. 10, pp. 1345–1359, 2010.
[36] W. Pan, E. W. Xiang, N. N. Liu, and Q. Yang, “Transfer learning in collaborative filtering for sparsity reduction,” inAAAI, 2010. [37] A. P. Singh and G. J. Gordon, “Relational learning via
collec-tive matrix factorization,” inSIGKDD, 2008.
[38] B. Li, Q. Yang, and X. Xue, “Can movies and books collab-orate? cross-domain collaborative filtering for sparsity reduc-tion,” inIJCAI, 2009.
[39] L. Hu, J. Cao, G. Xu, L. Cao, Z. Gu, and C. Zhu, “Personalized recommendation via cross-domain triadic factorization,” in WWW, 2013.
[40] L. Zhao, S. J. Pan, E. W. Xiang, E. Zhong, Z. Lu, and Q. Yang, “Active transfer learning for cross-system recommendation,” inAAAI, 2013.
[41] B. Hollerit, M. Kr ¨oll, and M. Strohmaier, “Towards linking buyers and sellers: Detecting commercial intent on twitter,” inWWW Companion, 2013.
[42] A. Mislove, B. Viswanath, K. P. Gummadi, and P. Druschel, “You are who you know: Inferring user profiles in online social networks,” inWSDM, 2010.
[43] R. Zafarani and H. Liu, “Connecting corresponding identities across communities,” inICWSM, 2009.
[44] Y. Zhang and M. Pennacchiotti, “Recommending branded products from social media,” in Seventh ACM Conference on Recommender Systems, RecSys ’13, Hong Kong, China, October 12-16, 2013, 2013, pp. 77–84.
[45] ——, “Predicting purchase behaviors from social media,” in 22nd International World Wide Web Conference, WWW ’13, Rio de Janeiro, Brazil, May 13-17, 2013, 2013, pp. 1521–1532.
PLACE PHOTO HERE
Wayne Xin Zhaois currently an assistan-t professor aassistan-t assistan-the School of Informaassistan-tion, Renmin University of China. He received the Ph.D. degree from Peking University in 2014. His research interests are web tex-t mining and natex-tural language processing. He has published several referred papers in international conferences journals such as ACL, EMNLP, COLING, ECIR, CIKM, SI-GIR, SIGKDD, ACM TOIS, ACM TIST, IEEE TKDE, KAIS and WWWJ.
PLACE PHOTO HERE
Sui Li is currently a PhD student at the School of Electronic Engineering and Com-puter Science, Peking University, China. He received his BEng degree in Computer Sci-ence from Peking University in 2014, China. His research mainly focuses on Web mining and machine learning.
PLACE PHOTO HERE
Yulan Heis a Reader at the School of Engi-neering and Applied Science, Aston Univer-sity, UK. She received her PhD degree from Cambridge University working on statistical models to spoken language understanding. She has published over 100 articles with most appeared in high impact journals and at top conferences. Her research interests in-clude natural language processing, statistical modelling, text and data mining, sentiment analysis, and social media analysis.
PLACE PHOTO HERE
Edward Y. Changis the Vice President of Research and Innovation at HTC since July 2012, heading software and hardware future technology research and development. Pri-or to his HTC post, Ed was a directPri-or of Google Research and was a full professor of Electrical Engineering at the University of California, Santa Barbara (UCSB). Ed has served on ACM (SIGMOD, KDD, MM, CIKM), VLDB, IEEE, WWW, and SIAM conference program committees, and co-chaired several conferences including MMM, ACM MM, ICDE, and WWW. He is a recipient of the NSF Career Award, IBM Faculty Partnership Award, and Google Innovation Award.
PLACE PHOTO HERE
Ji-Rong Wenis a professor at the School of Information, Renmin University of China. Before that, he was a senior researcher and group manager of the Web Search and Min-ing Group at MSRA since 2008. He has published extensively on prestigious inter-national conferences/journals and served as program committee members or chairs in many international conferences. He was the chair of the “WWW in China” track of the 17th World Wide Web conference. He is currently the associate editor of ACM Transactions on Information Systems (TOIS).
PLACE PHOTO HERE