warwick.ac.uk/lib-publications
Original citation:
Thomason, Alasdair, Griffiths, Nathan and Sanchez Silva, Victor (2016) Predicting
interactions and contexts with context trees. In: 24th ACM SIGSPATIAL International
Conference on Advances in Geographic Information Systems, California, USA, 31 Oct - 3 11
Nov 2016. Published in: GIS '16 Proceedings of the 24th ACM SIGSPATIAL International
Conference on Advances in Geographic Information Systems p. 46.
Permanent WRAP URL:
http://wrap.warwick.ac.uk/81664
Copyright and reuse:
The Warwick Research Archive Portal (WRAP) makes this work by researchers of the
University of Warwick available open access under the following conditions. Copyright ©
and all moral rights to the version of the paper presented here belong to the individual
author(s) and/or other copyright owners. To the extent reasonable and practicable the
material made available in WRAP has been checked for eligibility before being made
available.
Copies of full items can be used for personal research or study, educational, or not-for profit
purposes without prior permission or charge. Provided that the authors, title and full
bibliographic details are credited, a hyperlink and/or URL is given for the original metadata
page and the content is not changed in any way.
Publisher’s statement:
"© ACM, 2016. This is the author's version of the work. It is posted here by permission of
ACM for your personal use. Not for redistribution. The definitive version was published in
GIS '16 Proceedings of the 24th ACM SIGSPATIAL International Conference on Advances in
Geographic Information Systems p. 46.
http://dx.doi.org/10.1145/2996913.2996993
"
A note on versions:
The version presented here may differ from the published version or, version of record, if
you wish to cite this item you are advised to consult the publisher’s version. Please see the
‘permanent WRAP url’ above for details on accessing the published version and note that
access may require a subscription.
Predicting Interactions and Contexts with Context Trees
Alasdair Thomason
Nathan Griffiths
Victor Sanchez
{alasdair.thomason, nathan.griffiths, v.f.sanchez-silva}@warwick.ac.uk Department of Computer Science
University of Warwick CV4 7AL, United Kingdom
ABSTRACT
Predicting the future actions of individuals from geospatial data has the potential to provide a basis for tailored services. This work presents the Predictive Context Tree (PCT), a new hierarchical classifier based on theContext Tree sum-mary model [8]. The PCT is capable of predicting the future contexts and locations of individuals to provide a basis for understanding not only where a user will be, but also what type of activity they will be performing. Through a com-parison to established techniques, this paper demonstrates the applicability of the PCT by showing increased accura-cies for location prediction, and increased utility through context prediction.
CCS Concepts
•Computing methodologies→Classification and re-gression trees;•Information systems→Location based services;
Keywords
Context Prediction; Geospatial Systems; Hierarchical Clas-sifier; Location Prediction; Trajectories
1.
INTRODUCTION
Accurately being able to predict the future actions of in-dividuals from geospatial trajectories allows for the provi-sion of timely information that can influence the behaviour of an individual or group. Where existing work has pri-marily focused on predicting the location a user will next visit, context prediction instead aims to identify the context that the person will be immersed within, paving the way for understanding what the user will be doing in the future. Building upon the Context Tree data structure [8], the re-mainder of this paper presents and evaluates thePredictive Context Tree (PCT), a hierarchical classifier that is capable of predicting both future locations and future contexts of individuals.
Permission to make digital or hard copies of all or part of this work for personal or classroom use is granted without fee provided that copies are not made or distributed for profit or commercial advantage and that copies bear this notice and the full citation on the first page. Copyrights for components of this work owned by others than the author(s) must be honored. Abstracting with credit is permitted. To copy otherwise, or republish, to post on servers or to redistribute to lists, requires prior specific permission and/or a fee. Request permissions from [email protected].
SIGSPATIAL’16, October 31-November 03, 2016, Burlingame, CA, USA
c
2016 Copyright held by the owner/author(s). Publication rights licensed to ACM. ISBN 978-1-4503-4589-7/16/10. . . $15.00
[image:2.612.340.529.204.352.2]DOI:http://dx.doi.org/10.1145/2996913.2996993
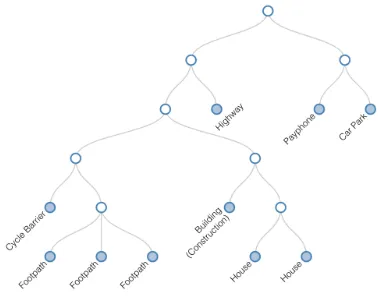
Figure 1: Example Context Tree
2.
RELATED WORK
Predicting the future location of individuals and devices from geospatial trajectories has been considered in the liter-ature, using various techniques including neural networks [1, 5], support vector machines (SVMs) [9], and Markov mod-els [2, 6, 7]. Originally motivated by the desire to predict movement around cellular networks [5], recent work extracts meaningful locations from trajectories and uses these as a basis for prediction [2, 6].
Identifying the context of user actions has also been con-sidered in the literature, where the goal is to identify periods of time in which the user was likely performing the same task or had a similar goal [3]. These contexts have been used to improve location predications [4].
2.1
The Context Tree
For the purpose of identifying contexts, theContext Tree
data structure has been proposed [8]. The Context Tree is constructed by identifying real-world features (e.g. buildings and roads) that an individual has interacted with and clus-tering these elements together based on their semantics, and properties of the interactions, using a hierarchical clustering algorithm. The algorithm creates a tree-like data structure where leaf nodes represent individual features, and non-leaf nodes are contextual clusters, as illustrated in Figure 1.
Figure 2: Classification methods for Predictive Context Trees. Classification begins at the root node, selecting chil-dren to follow based on the output of their binary classifiers. The algorithm would follow the solid green arrows for con-text prediction, or carry on down the dotted orange arrow for element prediction
3.
THE PREDICTIVE CONTEXT TREE
ThePredictive Context Tree (PCT)is an extension to the Context Tree data structure that is capable of both sum-marising a user’s historic contexts as well as predicting their future context as a classification model. Initial Context Trees are trained according to the procedure outlined in [8]: geospatial trajectories are augmented with land usage ele-ments to identify the real-world feature that the person was likely interacting with. These elements are then clustered hi-erarchically to identify contexts that the user was immersed within. The procedure outlined in [8] allows an arbitrary number of land usage elements to be associated with each trajectory point, but in this work for the purpose of pre-diction we impose a limit of one element per point. This element is selected during filtering by considering only ele-ments smaller than a specified size,maxradius, and selecting the one with the highest assigned score.
The Context Tree representing the identified clusters is then converted into a hierarchical predictive model by turn-ing each non-root node into a binary classifier, in our case an SVM. Each classifier aims to answer the question “does this instance belong in the subtree rooted at this node?” when presented with an unlabelled instance. Overall classi-fication of an instance occurs by starting at the root node and requesting a classification from each of the root’s chil-dren. The child with the highest confidence, determined by logistic regression, in ayesclassification is selected for con-sideration. Here, the goals of the prediction are considered. If the prediction requested is for a context, then the child is followed only if its confidence is above some threshold,
Ts, and the process repeated. This is shown by solid green
arrows in Figure 2 (forTs= 0.5). If, however, a land usage
element is requested then the PCT must return a leaf node, and so the threshold is ignored and the child with highest confidence is followed at each stage until a leaf node is found (Figure 2, following the solid then dashed arrows).
3.1
Training a PCT
As Predictive Context Trees are made up of binary classi-fiers, they are trained in the same way as other classification-based approaches. A set of instances is provided as the
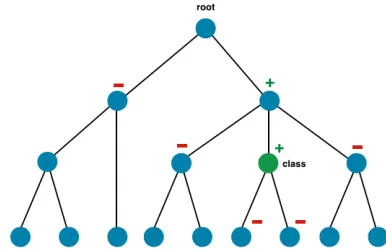
Figure 3: Example of how a training instance is treated by each classifier when the class label is associated with the node labelled ‘class’. All nodes labelled with ‘+’ treat this instance as a positive example, nodes labelled ‘-’ treat it as negative, while nodes without a label ignore this instance for training.
training set, where the class label refers to the next element or context the user interacted with. These instances are fed into each node’s classifier in turn, with the class variable modified to become binary in the following ways:
• If the instance’s class represents this node, it is used as apositivetraining example
• If the class represents a node in the subtree rooted at this node, it is apositiveexample
• If the class represents a sibling of this node, or a de-scendant of a one, it is anegativeexample
• If the class represents an ancestor of this node, it is a
negativeexample
• If the class represents any other node, it is ignored and not used for training in this classifier
An example of how each node treats a particular instance is shown in Figure 3. It is through such a training procedure that the hierarchical links between contexts and elements are learnt by the PCT. Intuitively, each node’s classifier is trained to returnyesif the instance belongs to itself or one of its descendants, ornoif the instance belongs to a sibling or one of their descendants (i.e. following this particular child would be a mistake). The SVM classifiers in each node can now be trained using instances with known class labels.
4.
EXPERIMENTAL METHODOLOGY
This section details the experimental methodology fol-lowed to evaluate the applicability of the PCT to the task of context and location prediction. For evaluation, we employ trajectories collected from 10 members of the University of Warwick over a period of 6 months. Additionally, we use land usage information from OpenStreetMap1.
4.1
Extracted Locations
The first stage of evaluation is using existing location ex-traction and prediction techniques to provide a compari-son for predictive accuracy. Locations are extracted using a widely-used approach, that of identifying subtrajectories that are smaller than a specified radius and longer than a
1
[image:3.612.334.527.55.181.2]specified duration [10]. For this work, we set the maximum radius as 50m, and vary the minimum duration, dmin, to
explore its impact. Clustering locations is then performed with DBSCAN, with parametersminpts= 0, eps= 15m.
4.2
Land Usage Elements
Land usage interactions are identified through the pro-cedure presented in Section 3. These interactions can be considered both as a basis for prediction using established techniques, as extracted land usage elements mirror identi-fied locations, and as a basis for PCT generation. In order to produce a representative comparison, parameters are se-lected that aim to mirror the extracted locations as best as possible: the maximum element size is constrained to be 50m across, and the same values ofdminare used for
explor-ing its impact on predictive accuracy. Additionally,δ, the width of the buffer to consider when selecting land usage el-ements, is set to 5 minutes andλ, the weighting assigned to semantic similarity over feature similarity when determining contexts, is set to 0.6, selected empirically.
4.3
Predictions
Training instances for each technique are generated by se-lecting interactions with locations or extracted features that last longer than dmin minutes. Higher values of dmin will
remove noise, while smaller values allow for the identifica-tion of locaidentifica-tions and elements that the user interacts with briefly. Interactions are then summarised into a set of fea-tures: day of year, day of week, hour, minute, duration, cur-rent element/location, class (next element/location). These instances are then used to train both existing techniques, specifically SVMs and hidden Markov models, and the PCT. When predicting individual locations or elements, a cor-rect prediction is one where the class value of the test in-stance matches the class value returned by the model. A PCT prediction can be consideredcontext correctif the node represented by the predicted class label is an ancestor of the actual class node.
5.
RESULTS
0 20 40 60 80 100
0 50 100 150 200 250
A
c
cu
ra
c
y
Minimum Duration (dmin, minutes)
HMM, Loc SVM, Loc
[image:4.612.320.560.57.232.2]HMM, Elem SVM, Elem
Figure 4: Predictive accuracy using existing prediction tech-niques, for extracted locations and land usage elements
0 20 40 60 80 100
0 50 100 150 200 250
A
c
cu
ra
c
y
Minimum Duration (dmin, minutes)
[image:4.612.319.558.295.463.2]Element PCT SVM, Elem
Figure 5: Predictive accuracy for element prediction using the PCT, with SVMs shown as a comparison
0 20 40 60 80 100
0 50 100 150 200 250
A
c
cu
ra
c
y
Minimum Duration (dmin, minutes)
Context Correct Element Correct
Figure 6: Predictive accuracy for context prediction using the PCT (Ts= 0.6)
The predictive accuracy for both location prediction and element prediction is shown in Figure 4, for different val-ues ofdmin. The results indicate that in both cases, SVMs
outperform hidden Markov models. The figure also demon-strates that for small values of dmin(i.e. visit durations of
less than 25 minutes), higher predictive accuracy is seen by predicting over extracted locations than land usage el-ements. Beyond this point, however, the predictive accu-racy is consistently better when using identified land usage elements. While both sets of data provide a similar foun-dation for predicting the future movements of an individ-ual, elements have a greater relationship with the real world and contain information about the features they represent. As would be expected, the predictive accuracy for all tech-niques increases withdmin, as predicting longer interactions
reduces noise.
[image:4.612.55.291.496.676.2]0 20 40 60 80 100 S V M , L o ca tio n S V M , E lem en t El em en t PCT Co n tex t P CT
(a)dmin= 20min
0 20 40 60 80 100 S V M , L o ca tio n S V M , E lem en t El em en t PCT Co n tex t P CT Element Context
[image:5.612.72.287.55.243.2](b)dmin= 1hr
Figure 7: Comparison with previous results
the PCT when predicting elements. The results demonstrate that the PCT performs similarly to the existing approach, providing a good foundation for understanding individuals through predicting their next interactions. The PCT is also capable of predicting contexts, with results for context pre-diction shown in Figure 6. Element prepre-dictions are returned when there is high confidence (≥ 0.6 in this case), other-wise context predictions are returned according to the pro-cedure outlined in Section 3. A comparison of the results from the four prediction schemes is shown in Figure 7 for
dmin= 20min and 1hr.
In Figure 7, the best predictive accuracies are attained by the context-prediction PCT, when combining the ele-ment correct and context correct scores. Fordmin= 20min,
predicting over extracted locations has a slightly higher ac-curacy than using identified land usage elements. With
dmin= 1hr, however, predictive accuracies are significantly
higher when using identified land usage elements as a ba-sis with either existing techniques or the PCT. Although the difference between established techniques and the PCT in element mode is minimal, when combining this with the context correct predictions, the PCT offers additional utility over existing techniques. Figure 8 demonstrates the effect that the selection threshold (Ts) has on predictive accuracy,
where higher values of Ts make it much more likely that
a prediction will stop higher up in the tree, yielding more context correct, and fewer element correct predictions.
6.
CONCLUSION
This work has presented and evaluated thePredictive Con-text Tree (PCT), a hierarchical classification model for pre-dicting the future locations and contexts of individuals from geospatial trajectories. Additionally, we have demonstrated the applicability of predicting future interactions with land usage elements using existing machine learning techniques, with results indicating that land usage elements offer supe-rior predictive accuracy than extracted locations. The PCT has been demonstrated to produce accuracies commensurate with existing approaches when predicting elements, and in-creased utility over these approaches when considering con-text prediction. 0 20 40 60 80 100
0 0.2 0.4 0.6 0.8 1
P e rce n ta g e
Selection Threshold (Ts)
Element Correct Context Correct
Figure 8: Selection threshold,Ts, against accuracy (dmin=
20min). The dotted blue line representsTs= 0, i.e. element
prediction, and the dashed red line shows Ts = 0.6, i.e.
context prediction from previous figures
References
[1] S. Akoush and A. Sameh. Bayesian Learning of Neural Networks for Mobile User Position Prediction. InProc. Euro-Par, pages 1234–1239, 2007.
[2] D. Ashbrook and T. Starner. Using GPS to Learn Sig-nificant Locations and Predict Movement Across Multi-ple Users. Pers. Ubiquit. Comput., 7(5):275–286, 2003.
[3] T. Bao, H. Cao, E. Chen, J. Tian, and H. Xiong. An Un-supervised Approach to Modelling Personalized Con-texts of Mobile Users.Knowl. Inf. Syst., 31(2):345–370, 2011.
[4] N. Bhyri, G. V. Kidiyoor, S. K. Varun, S. Kalambur, D. Sitaram, and C. Kollengode. Predicting the Next Move. InProc. ICACCI, pages 2359–2365, 2015.
[5] P. Bilurkar, N. Rao, G. Krishna, and R. Jain. Applica-tion of Neural Network Techniques for LocaApplica-tion Predi-cation in Mobile Networking. InProc. ICONIP, pages 2157–2161, 2002.
[6] R. Hariharan and K. Toyama. Project Lachesis: Pars-ing and ModelPars-ing Location Histories. In Proc. GI-Science, pages 106–124, 2004.
[7] A. Thomason, N. Griffiths, and V. Sanchez. Parameter Optimisation for Location Extraction and Prediction Applications. InProc. IEEE PICom, pages 2173–2180, 2015.
[8] A. Thomason, N. Griffiths, and V. Sanchez. Context Trees: Augmenting Geospatial Trajectories with Con-text. ACM T. Inform. Syst. (In Press), 2016.
[9] J. Wang and B. Prabhala. Periodicity Based Next Place Prediction. InProc. MDC Workshop, Pervasive, 2012.
[image:5.612.318.556.56.231.2]