SHORT COMMUNICATION
Reduced non-bicarbonate skeletal muscle buffering capacity in
mice with the mini-muscle phenotype
Jarren C. Kay, Jocelyn Ramirez, Erick Contreras and Theodore Garland, Jr*
ABSTRACT
Muscle pH decreases during exercise, which may impair function. Endurance training typically reduces muscle buffering capacity as a result of changes in fiber-type composition, but existing comparisons of species that vary in activity level are ambiguous. We hypothesized that high-runner (HR) lines of mice from an experiment that breeds mice for voluntary wheel running would have altered muscle buffering capacity as compared with their non-selected control counterparts. We also expected that 6 days of wheel access, as used in the selection protocol, would reduce buffering capacity, especially for HR mice. Finally, we expected a subset of HR mice with the‘mini-muscle’ phenotype to have relatively low buffering capacity as a result of fewer type IIb fibers. We tested non-bicarbonate buffering capacity of thigh muscles. Only HR mice expressing the mini-muscle phenotype had significantly reduced buffering capacity, females had lower buffering capacity than males, and wheel access had no significant effect.
KEY WORDS: Artificial selection, Buffering capacity, Endurance, Voluntary exercise, Skeletal muscle, Wheel running
INTRODUCTION
During exercise, metabolic acidosis may occur from by-products of muscle contraction and ATP production. This acidosis may impair muscle function in various ways, including decreased rates of glycolysis and glycogenolysis due to inhibition of glycogen phosphorylase and phosphofructokinase activities, and through decreased maximum force (see Cairns, 2006, for review; Chase and Kushmerick, 1988; Chasiotis et al., 1983; Donaldson and Hermansen, 1978; Fitts, 1994; Trivedi and Danforth, 1966).
Organisms ameliorate decreases in muscle pH in at least two ways. One is to remove protons generated in the cytosolic compartment by transporting them to the mitochondria or out of the cell entirely. Transport of protons into the mitochondria using monocarboxylate transporter 1 (MCT1) also transports lactate, which can be used by the mitochondria and converted to pyruvate (intracellular lactate shuttle; Brooks, 1998; Brooks et al., 1999). Proton transport out of the cell is accomplished by numerous mechanisms, but MCT proteins are of particular interest because lactate may then be taken up by other muscle cells via MCT1 (usually by type I or type IIa fibers; Donovan and Pagliassotti, 2000) and converted into pyruvate via lactate dehydrogenase.
The other way to mitigate decreased pH is to buffer it, which is especially important in the blood and muscle of organisms that must
undergo an oxygen deficit, such as during some types of exercise or diving. Organisms accomplish this in numerous ways, including the use of HCO3− and imidazole-containing (histidine-containing)
compounds (carnosine, anserine, etc.), production of lactate, hydrolysis of phosphocreatine (and subsequent production of inorganic phosphate, Pi), and behavioral changes (e.g. increased
ventilation). As might be expected, marine mammals and pelagic fish have higher buffering capacity than terrestrial mammals or deep-sea/shallow water fish, respectively (see Abe, 2000, for review; Castellini and Somero, 1981; Okuma and Abe, 1992). Greyhounds and thoroughbred horses, which regularly perform extended bouts of exercise, have increased buffering capacity as compared with humans of unspecified training status (Harris et al., 1990). In humans, buffering capacity changes in response to training, and differentially depending on the type of training (e.g. high-intensity interval training increases buffering capacity; Parkhouse et al., 1985; Sahlin and Henriksson, 1984; Weston et al., 1997). Possible mechanisms underlying the training responses in humans include increases in the amount of buffering compounds in the muscle ( potentially by changing the number of fast glycolytic fibers), increases in the number of proton transporters (Juel et al., 2004a,b, 2003; Pilegaard et al., 1999, 1994) and/or increases in muscle capillarity (Jensen et al., 2004).
Given its association with athletic ability, buffering capacity would be expected to evolve in concert (co-adapt) when artificial selection targets forced or voluntary exercise (review in Swallow et al., 2009). The purpose of the present study was to examine muscle buffering capacity in replicate high-runner (HR) lines of mice that have experienced long-term breeding for high voluntary wheel running (Swallow et al., 1998). Several correlated responses in the HR lines seem to enhance capacity for endurance exercise, including more intermittent locomotion on wheels, altered stride characteristics during treadmill locomotion, increased maximal oxygen consumption (V̇O2,max), increased heart ventricle mass and larger femoral heads (Claghorn et al., 2017; Garland and Freeman, 2005; Girard et al., 2001; Kelly et al., 2017, 2006; Rezende et al., 2006).
A subset of the HR mice, known as mini-muscle individuals, have a 50% reduction in hindlimb muscle mass when homozygous for a SNP mutation in theMyh4gene (Burniston et al., 2013; Kelly et al., 2014). This mutation leads to a severe reduction in type IIb muscle fibers throughout the body (Talmadge et al., 2014), increased cost of transport, reduced maximal sprint speed, and differences in contractile properties of some muscles in the triceps surae complex (e.g. slower twitches; Dlugosz et al., 2009; Guderley et al., 2006; Syme et al., 2005). Mice with the mini-muscle phenotype also show increased capillarity in the medial gastrocnemius, increased V̇O2,max during hypoxia and decreased plasma lactate concentration during peak wheel running, but not during exhaustive exercise (Meek et al., 2009; Rezende et al., 2006; Wong et al., 2009). Thus, mini-muscle individuals may have altered buffering capacity.
Received 16 October 2017; Accepted 9 April 2018
Department of Evolution, Ecology, and Organismal Biology, University of California, Riverside, CA 92521, USA.
*Author for correspondence (tgarland@ucr.edu)
T.G.Jr, 0000-0002-7916-3552
Journal
of
Experimental
MATERIALS AND METHODS Experimental animals
All procedures in this study were approved by and are in accordance with guidelines set forth by the Institutional Animal Care and Use Committee at the University of California, Riverside. Mice used in the present study are the same as in Thompson et al. (2017), which came from generation 74 of an ongoing artificial selection experiment in which mice are bred for high voluntary wheel-running behavior (Careau et al., 2013; Swallow et al., 1998). The founding population was 224 outbred Hsd:ICR mice (Mus domesticus). After two generations of random mating, individuals were randomly assigned to one of eight closed lines; four lines designated as non-selected control (C) and four designated as HR lines. In the selection protocol, all mice were given access to Wahman-type activity wheels (1.12 m circumference, 10 cm wide, 35.7 cm diameter) attached to home-cages, withad libitumfood and water. The HR mice were bred based on their mean amount of wheel running on days 5 and 6 of a 6 day trial, while C mice were bred without regard to their wheel running. In all cases, sibling mating was not allowed.
This study used 50 male and 50 female mice (evenly split between C and HR) that were not allowed access to wheels, along with another 50 male and 50 female mice that were given access to running wheels for 6 days (also evenly split between C and HR) immediately prior to dissection. A period of 6 days was chosen in order to gain insight regarding their running abilities in a way that matched the criterion used for selective breeding. As in Thompson et al. (2017), experimental animals were on a reverse photoperiod, with lights on from 19:00 h to 07:00 h. Mini-muscle status was determined by dissection of the triceps surae muscle complex (Garland et al., 2002). Because the mini-muscle phenotype includes altered fiber type of the hindlimb muscles (Bilodeau et al., 2009; Guderley et al., 2006, 2008; Talmadge et al., 2014), it was used as an additional main effect in all statistical analyses (see below).
Wheel running
For the group of mice with access to wheels, revolutions were recorded for 23 h day−1by a computer that records revolutions in
1 min intervals (Careau et al., 2013; Swallow et al., 1998). Mice were removed from wheels during peak wheel running on day 6 and immediately killed (see ‘Buffering capacity’, below). Wheel freeness (measured by accelerating the wheel to a known velocity and recording the number of free-spinning revolutions) was used as a covariate in all analyses of wheel running (e.g. Acosta et al., 2017; Copes et al., 2015; Kolb et al., 2010).
Home-cage activity
Home-cage activity (HCA, an indicator of spontaneous physical activity; Garland et al., 2011) was measured using passive infrared motion sensors placed inside each cage. As previously described (Acosta et al., 2017; Copes et al., 2015; Thompson et al., 2017), HCA sensors were interfaced with a computer and recorded activity 3 times s−1as a binary output (0=no movement, 1=movement) and
then readings were averaged across every 1 min interval. As for wheel running, HCA was measured for 23 h day−1. Sensor
sensitivity was used as an additional covariate in these analyses.
Buffering capacity
Right thigh muscles from all mice were studied for buffering capacity. All mice were killed via cardiac puncture (under anesthesia) at the time when peak wheel running would occur on the sixth day, dissected, and thigh muscles were frozen and stored at−80°C. (Age at
sampling was 71–91 days.) Muscle buffering capacity (βm or Slyke; defined as the number of micromoles of base needed to change the pH of muscle homogenate by 1 pH unit per gram of wet mass of muscle) was determined using methods modified from Castellini and Somero (1981). Muscles were homogenized in 0.9% NaCl solution on ice (1 g of muscle in 19 ml of NaCl solution), and 2 ml was then transferred to a scintillation vial to be tested for buffering capacity at a constant temperature of 37±0.5°C. Initial pH of homogenized muscle was taken, and 0.5 mol l−1HCl was used to reduce the pH to 6, then
0.0125 mol l−1NaOH was used in 10 µl increments to bring the pH
up to 7. Preliminary studies showed no effect of total protein concentration on buffering capacity and therefore it was not measured in this experiment.
Statistics
Dependent variables were transformed as needed to improve normality and homoscedasticity of residuals. Following previous studies of mice from this selection experiment (e.g. Belter et al., 2004; Meek et al., 2009; Swallow et al., 1998; Thompson et al., 2017), buffering capacity was analyzed by nested analysis of covariance (ANCOVA), with replicate line nested within line type (HR versus C) using SAS Procedure Mixed. Analyses of wheel running and HCA across 5 days were done by SAS Procedure Mixed repeated-measures ANCOVA. The main factors for all analyses were line type (HR versus C), sex and the mini-muscle phenotype (Thompson et al., 2017), and wheel access was also used when applicable. As noted above, a measure of wheel freeness and a measure of home-cage sensor sensitivity were used as covariates. For all analyses, age at muscle dissection was used as a covariate. In preliminary analyses, body mass was never a significant predictor of HCA, so it was removed for final analyses (following Thompson et al., 2017).
For analyses of buffering capacity (always log-transformed to improve normality of residuals), age at muscle dissection was used as an additional covariate. Because previous studies have shown fiber-type alteration within muscle resulting from as little as 1 week of training (Allen et al., 2001), we tested whether the amount of physical activity was a predictor of buffering capacity and whether the level of activity would change the magnitude of the main effects or the interactions. Therefore, in some analyses of buffering capacity we also used the total amount of wheel running (assigning mice without wheels values of zero) and/or the total amount of HCA as covariates (following Thompson et al., 2017). Note that the mini-muscle phenotype is absent from all C lines, fixed (100% of individuals have it) in one of the HR lines and polymorphic in another HR line, so mini-muscle status is confounded with line type. Therefore, we performed additional analyses removing line and line type from the model and performing an ANCOVA of buffering capacity for the four sex×line type groups of mice. Statistical significance was judged atP<0.05.
RESULTS AND DISCUSSION Wheel running
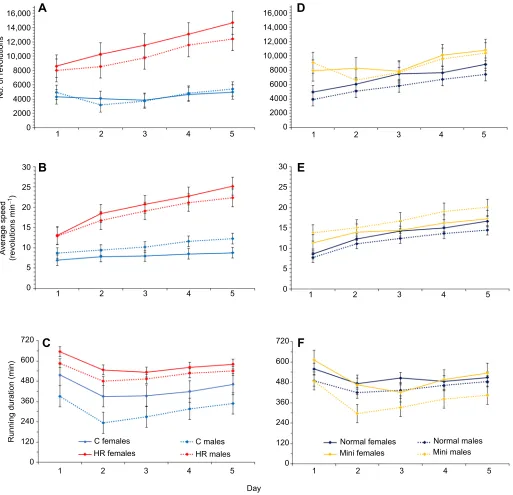
As shown previously (e.g. Belter et al., 2004), HR mice ran significantly more revolutions across days 1–5 than their C counterparts (repeated-measures ANCOVA,P=0.0068; see Fig. 1A and Table S1), with a strong effect of day (P<0.0001) and a line type×day interaction (P<0.0001). Fig. 1A shows that HR mice had a dramatic increase from ∼8000 and ∼8500 revolutions day−1 for
males and females, respectively, on day 1 to ∼11,000 and ∼14,000 revolutions day−1 on day 5. In contrast, both sexes of C
mice had a smaller absolute and proportional increase from
Journal
of
Experimental
∼4000 revolutions day−1on day 1 to∼5000 revolutions day−1on day
5. Fig. 1A suggests that females tended to run more than males in HR lines, but not in C lines, but the line type×sex interaction was non-significant (P=0.2431). The pattern for the total number of revolutions per day was largely mirrored by the pattern for average running speed (Fig. 1B), with a strong effect of line type (P=0.0029), day (P<0.0001) and their interaction (P<0.0001). The amount of time
spent running was higher for HR than for C mice (P=0.0157; Fig. 1C) and higher for females than for males (P=0.0391), with a strong effect of day (P<0.0001), where most groups ran the most on day 1, likely an effect of novelty (Table S1). ANCOVA indicated a significant positive effect of mini-muscle phenotype on the number of revolutions per day (P=0.0119; Fig. 1D) and average running speed (P=0.0240; Fig. 1E), but not running duration (Fig. 1F). 16,000
A
B
C
D
E
F
14,00012,000
No. of revolutions
A
v
erage speed
(revolutions min
−
1)
Running duration (min)
10,000
8000
6000
4000
2000
30
25
20
15
10
5
720
600
480
360
240
C females
HR females
C males
HR males
Normal females Normal males Mini females Mini males 120
0
720
600
480
360
240
120
0 0
1 2 3 4 5 1 2 3 4 5
1 2 3 4 5
1 2 3 4 5
1 2 3 4 5 1 2 3 4 5
30
25
20
15
10
5
0 0
16,000
14,000
12,000
10,000
8000
6000
4000
2000
0
[image:3.612.52.565.57.552.2]Day
Fig. 1. Average wheel-running metrics across 5 days (n=92).Values are least squares (LS) means±s.e.m. from SAS Procedure Mixed repeated-measures ANCOVA (see Table S1 for full results). (A) Total number of revolutions for control (C) versus high-runner (HR) mouse lines. (B) Average speed (revolutions per minute) for C versus HR mice. (C) Running duration (number of 1 min intervals with at least one revolution) in C versus HR mice. (D) Total number of revolutions for normal versus mini-muscle mice. (E) Average speed (revolutions per minute) for normal versus mini-muscle mice. (F) Running duration (number of 1 min intervals with at least one revolution) in normal versus mini-muscle mice. HR mice ran significantly more total revolutions per day, at higher average speeds and for a longer duration than C mice. The day-to-day increase in distance run and average speed was significantly greater for HR than for C mice. In addition, mini-muscle individuals ran a greater distance and at a faster speed than normal-muscled individuals. The duration of activity varied significantly across days, such that all groups tended to run more on day 1, which probably represents a novelty effect.
Journal
of
Experimental
HCA
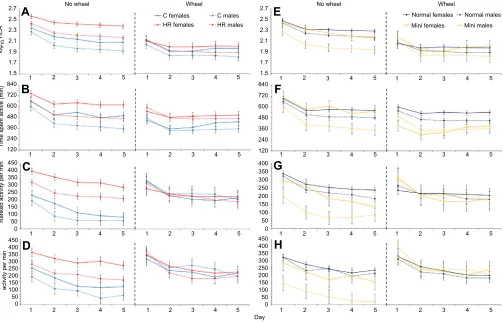
Similar to results from previous studies of animals housed without wheels (Acosta et al., 2017; Copes et al., 2015; Thompson et al., 2017), HR mice had higher total activity, time spent active (minutes per day), mean activity per minute, and maximal activity for any 1 min interval (Fig. 2, left panels; Table S2; line typeP=0.0015, P=0.0235, P=0.0007 and P=0.0018, respectively). In addition, females without wheels had higher total activity, spent more time active, and showed more activity per minute and higher maximal activity for any 1 min interval than male mice (P=0.0133, P=0.0134,P=0.0410 andP=0.0207, respectively; Fig. 2A–D and Table S2). Mini-muscle individuals without wheels had significantly lower total activity (P=0.0061; Fig. 2E) and activity per minute (P=0.0002; Fig. 2G). Male mini-muscle mice without wheels had lower maximum activity in any 1 min interval than other mice (sex×mini interaction P=0.0114; Fig. 2H). No other interaction terms were statistically significant (Table S2). All measures of activity tended to decline across days for all groups (all dayP<0.0001).
With access to wheels, the only line-type effect was that HR mice were active in cages for significantly more time than C mice (P=0.0402; Fig. 2B), while mini-muscle individuals were active for less time per day as compared with other mice (P=0.0044; Fig. 2F). Again, all measures of activity tended to decline across days (all day
P<0.0001), at the same time that wheel running was increasing (Fig. 1), a phenomenon that has been reported previously for these mice (Acosta et al., 2017). No interaction terms were statistically significant for mice with access to wheels (Table S2).
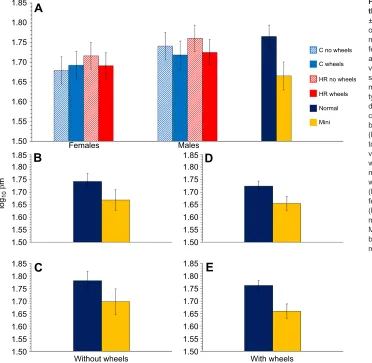
Buffering capacity
Our hypothesis that HR mice in general would have reduced buffering capacity in skeletal muscle was not supported by any statistical model (Fig. 3A and Table S3). However, the subset of HR mice with the mini-muscle phenotype had significantly lower buffering capacity than normal-muscled mice (Fig. 3 and Table S3). The mini-muscle phenotype has been favored (unintentionally) by the selective breeding protocol, and hence can be viewed as an adaptive response to selection, albeit one that occurs in only two of the four replicate HR lines because it was initially rare and the underlying Mendelian recessive allele was lost by random genetic drift in all other lines (Garland et al., 2002). Although it has been favored by selection, the mini-muscle phenotype includes several differences as compared with normal-muscled individuals (e.g. increased fatigue resistance in medial gastrocnemius: see Introduction), and it is not yet clear which one(s) of these provides the primary benefit(s) for endurance running. Indeed, reduced buffering capacity might even be maladaptive for endurance running. For example, a study of endurance capacity
2.7
A
No wheelB
C
D
E
F
G
H
Wheel No wheel Wheel
C females HR females
log
10
HCA
T
ime spent active (min)
Ranked activity per min
Ranked maximum activity per min
HR males
C males Normal females Normal males
Mini females Mini males 2.5
2.3
2.1
1.9
1.7
1.5
1 2 3 4 5 1 2 3 4 5 1 2 3 4 5 1 2 3 4 5
1 2 3 4 5
1 2 3 4 5
1 2 3 4 5
1 2 3 4 5
1 2 3 4 5 1 2 3 4 5 1 2 3 4 5 1 2 3 4 5
1 2 3 4 5
1 2 3 4 5
1 2 3 4 5
1 2 3
Day
4 5
840
720
600
480
360
240
120
450 400 350 300 250 200 150 100 50 0
400 350 300 250 200 150 100 50 0
400 450
350 300 250 200 150 100 50 0 400
450
350 300 250 200 150 100 50 0
840
720
600
480
360
240
120 2.7
2.5
2.3
2.1
1.9
1.7
[image:4.612.56.559.333.655.2]1.5
Fig. 2. Average home-cage activity metrics across 5 days for C versus HR mice and normal versus mini-muscle mice.Analyses of mice with and without wheel access were performed separately. Values are LS means±s.e.m. from SAS Procedure Mixed used to implement repeated-measures ANCOVA.
(A) Total home-cage activity (HCA, arbitrary units;n=191). (B) Time spent active (n=190). (C) Mean activity per minute (n=191). (D) Mean maximum activity in any
1 min interval (n=191). (E) Total HCA (n=191). (F) Time spent active (n=190). (G) Mean activity per minute (n=191). (H) Mean maximum activity in any 1 min
interval (n=191). HR mice had a higher total activity, mean activity per minute and maximum activity in any 1 min interval compared with C mice when
housed without access to wheels, and they were active for more minutes regardless of wheel access. Mini-muscle individuals had less total activity, less activity per minute and less maximum activity in any 1 min interval than normal-muscled mice when housed without access to wheels. Mini-muscle mice were
also active for fewer minutes than normal-muscled mice when housed with wheels.
Journal
of
Experimental
during forced treadmill exercise found that the HR line fixed for the mini-muscle phenotype has relatively low endurance compared with the other three HR lines (Meek et al., 2009). However, in the context of the prevailing selective regime, this ‘cost’ appears to be outweighed by other benefits inherent to mini-muscle individuals.
Regardless of its adaptive significance, what might underlie the reduced buffering capacity of mini-muscles? Many previously mentioned comparative studies have shown that fiber type of the muscle and a few histidine-containing compounds are very important in the non-bicarbonate buffering capacity of muscles (carnosine, anserine and balenine). These compounds occur in most animals (Crush, 1970; Davey, 1960) but vary in their concentrations (among species; see Bate-Smith, 1938) and in different muscle fiber types (Dunnett and Harris, 1995). Much work has been done on anserine and carnosine, which have pKavalues of 6.83 and 7.04
(Bate-Smith, 1938; Davey, 1960), respectively, which would make them good buffering compounds. Dunnett and Harris (1995) showed that carnosine concentrations in the middle gluteal muscle of horses are increased in type IIa fibers, but highest in type IIb fibers. Mini-muscle mice have reduced numbers of type IIb fibers (Bilodeau et al., 2009; Guderley et al., 2008, 2006; Talmadge et al., 2014), meaning that they should show reduced carnosine-mediated buffering capacity. Taurine (an organic acid) was shown to have marked effects on increasing buffering capacity as well, but its distribution is opposite to that of carnosine, being higher in type I fibers, but still present in lower concentrations in type IIa fibers and type IIb fibers (Dunnett and Harris, 1995). This evidence suggests
that the differences in buffering capacity between mini-muscle and normal-muscled individuals are unlikely to be caused by differences in taurine concentration.
Mini-muscle mice further differentiate themselves from normal-muscled mice by having lower blood lactate during peak wheel running (Meek et al., 2009), which could be caused by either reduced lactate production or increased usage within the mitochondria. If mini-muscle mice are generating less lactate, then they should have reduced ability to resist changes in pH, given that lactate acts as a buffering compound. Mini-muscle mice also have increased mitochondrial densities (Guderley et al., 2006), but lower lactate dehydrogenase activity per gram of muscle tissue (Houle-Leroy et al., 2003), which could prevent them from using the intracellular lactate shuttle to convert lactate to pyruvate in the mitochondria of type I and type IIa fibers. The increased capillarity of mini-muscle mice (Wong et al., 2009) may be more effective at transporting H+away from the
muscles (via MCT proteins), as suggested by Juel (2008), which could mean they would not require increased buffering capacity.
Female mice had a lower buffering capacity than males (P=0.0051; see Fig. 3A and Table S3). The differences in buffering between the sexes in these mice may reflect lower carnosine and/or anserine levels in muscles of females, as has been reported in some species of mammal (e.g. humans and mice; Mannion et al., 1992; Peñafiel et al., 2004), but not in others (i.e. rats; Peñafiel et al., 2004). The sex differences seem to be mediated by testosterone in mice, given that treatment of females with testosterone propionate increases their carnosine to levels similar to those seen in males, and hence may also 1.85
A
B
C
D
E
1.80log
10
β
m
Females
Without wheels With wheels
Males
C no wheels
C wheels
HR no wheels
HR wheels
Normal
Mini 1.75
1.70
1.65
1.60
1.55
1.50
1.85 1.80
1.75
1.70 1.65
1.60
1.55
1.50
1.85 1.80
1.75
1.70 1.65
1.60
1.55
1.50
1.85
1.80
1.75 1.70
1.65
1.60
1.55
1.50 1.85
1.80
1.75
1.70
1.65 1.60
1.55
[image:5.612.51.423.60.423.2]1.50
Fig. 3. Buffering capacity (βm) of right thigh muscles.Values are LS means ±s.e.m. from SAS Procedure Mixed, based
on log10-transformed data. (A) Analyses of all
mice combined (n=176) showing male and
female C and HR mice, with or without access to running wheels, as well as normal versus mini-muscle mice. Female mice had significantly lower buffering capacity than males regardless of wheel access or line
type (P=0.0051; Table S3). C and HR mice
did not significantly differ in buffering capacity. Mini-muscle mice had lower buffering capacity than normal mice.
(B–E) Separate analyses of a quarter of the
total sample size. (B) Normal-muscled versus mini-muscle female mice without
wheels (n=43,P=0.0206). (C)
Normal-muscled versus mini-muscle male mice
without wheels (n=45,P=0.0413).
(D) Normal-muscled versus mini-muscle
female mice with wheels (n=46,P=0.0084).
(E) Normal-muscled versus mini-muscle
male mice with wheels (n=42,P=0.0004).
Mini-muscle mice had significantly lower buffering capacity than normal-muscled mice regardless of sex or wheel access.
Journal
of
Experimental
equalize muscle buffering capacity (Peñafiel et al., 2004). Female mice also have lower levels of type IIb fibers in some hindlimb muscles (e.g. the tibialis anterior; see fig. 1 in Haizlip et al., 2015), which could also contribute to lowered buffering in those muscles.
Our results regarding the effects of sex and of mini-muscle phenotype were generally unaltered when we included measures of wheel running and/or of HCA as covariates, and the activity metrics did not significantly predict buffering capacity in these statistical models (Table S3). However, in an analysis using only mice with wheel access, average running speed across 5 days negatively predicted buffering capacity (P=0.0407). Similarly, the sum of the wheel revolutions during the 8 min prior to muscle sampling negatively predicted buffering capacity (P=0.0440) ( preliminary analyses indicated that wheel running over this time interval had a higher predictive ability than that over other intervals in the range of 1 to 120 min prior to muscle sampling). Both of these results suggest that wheel-running activity may have some influence on muscle buffering capacity, i.e. cause training effects.
Training effects on muscle buffering capacity have been reported previously (Parkhouse et al., 1985; Sahlin and Henriksson, 1984). For example, endurance cyclists have lower muscle buffering capacity than other athletes that perform more short-term, high-intensity exercises (because of reduced numbers of fast glycolytic or type IIb fibers), but high-intensity interval training can raise their muscle buffering capacity (Weston et al., 1997). This training effect is potentially caused by an increase in type IIb fiber abundance after high-intensity training (type IIb fibers generate the most lactate because of their lower oxidative capacity; Baldwin et al., 1977). In mice, Allen et al. (2001) showed that as little as 1 week of voluntary wheel running (commonly thought of as endurance training) is enough to induce a fiber-type shift in the tibialis anterior muscle, increasing the number of type IIa fibers and reducing the number of type IIb fibers. A change in fiber type toward more oxidative fibers (type I and type IIa) may lower buffering capacity as a result of either lower lactate or lower carnosine levels (Dunnett and Harris, 1995; Dunnett et al., 1997). Future studies could explore these possibilities by direct analysis of muscle fiber types at different time points after the initiation of wheel access in HR and C lines of mice. In conclusion, we have shown that buffering capacity is reduced in mini-muscle mice (Garland et al., 2002) as well as female mice in general. We have also provided possible explanations for these differences (e.g. potentially lower levels of carnosine in mini-muscle mice); however, it is likely that more than one process is occurring simultaneously to affect the buffering capacity of these mice. Future studies should quantify the imidazole-containing peptides in the hindlimb muscles of mini- and normal-muscled mice, as well as the amount of MCT proteins (see Introduction) present in the same muscles. Based on our current knowledge of the fiber-type composition in the mini-muscle mice (see references in Introduction), we would expect lower levels of carnosine and lactate, but potentially increased concentrations of MCT1 proteins because of the lower numbers of type IIb fibers in their hindlimb muscles.
Acknowledgements
We thank Dr Zoe Thompson for help in obtaining the mice used here. Dr Douglas A. Syme and Dr Robert J. Talmadge offered helpful comments on the manuscript.
Competing interests
The authors declare no competing or financial interests.
Author contributions
Conceptualization: J.C.K., T.G.; Methodology: J.C.K., T.G.; Formal analysis: J.C.K., T.G.; Investigation: J.C.K., J.R., E.C.; Resources: T.G.; Writing - original draft: J.C.K.;
Writing - review & editing: J.R., E.C., T.G.; Supervision: T.G.; Project administration: T.G.; Funding acquisition: T.G.
Funding
Supported by US National Science Foundation grants IOS-1121273 and DEB-1655362 to T.G.
Supplementary information
Supplementary information available online at
http://jeb.biologists.org/lookup/doi/10.1242/jeb.172478.supplemental
References
Abe, H.(2000). Role of histidine-related compounds as intracellular proton buffering constituents in vertebrate muscle.Biochem. CC BIOKHIMIIA65, 757-765.
Acosta, W., Meek, T. H., Schutz, H., Dlugosz, E. M. and Garland, T., Jr. (2017). Preference for Western diet coadapts in High Runner mice and affects voluntary exercise and spontaneous physical activity in a genotype-dependent manner.
Behav. Processes135, 56-65.
Allen, D. L., Harrison, B. C., Maass, A., Bell, M. L., Byrnes, W. C. and Leinwand, L. A.(2001). Cardiac and skeletal muscle adaptations to voluntary wheel running in the mouse.J. Appl. Physiol.90, 1900-1908.
Baldwin, K. M., Campbell, P. J. and Cooke, D. A.(1977). Glycogen, lactate, and alanine changes in muscle fiber types during graded exercise.J. Appl. Physiol.43, 288-291.
Bate-Smith, E. C.(1938). The buffering of muscle in rigor; protein, phosphate and carnosine.J. Physiol.92, 336-343.
Belter, J. G., Carey, H. V. and Garland, T., Jr. (2004). Effects of voluntary exercise and genetic selection for high activity levels on HSP72 expression in house mice.
J. Appl. Physiol.96, 1270-1276.
Bilodeau, G. M., Guderley, H., Joanisse, D. R. and Garland, T.Jr. (2009). Reduction of type IIb myosin and IIB fibers in tibialis anterior muscle of mini-muscle mice from high-activity lines.J. Exp. Zool. Part Ecol. Genet. Physiol.311A, 189-198.
Brooks, G. A.(1998). Mammalian fuel utilization during sustained exercise.Comp.
Biochem. Physiol. B Biochem. Mol. Biol.120, 89-107.
Brooks, G. A., Dubouchaud, H., Brown, M., Sicurello, J. P. and Butz, C. E.
(1999). Role of mitochondrial lactate dehydrogenase and lactate oxidation in the intracellular lactate shuttle.Proc. Natl. Acad. Sci. USA96, 1129-1134.
Burniston, J. G., Meek, T. H., Pandey, S. N., Broitman-Maduro, G., Maduro, M. F., Bronikowski, A. M., Garland, T., Jr and Chen, Y.-W.(2013). Gene expression profiling of gastrocnemius of“minimuscle”mice.Physiol. Genomics
45, 228-236.
Cairns, S. P. (2006). Lactic acid and exercise performance.Sports Med. 36, 279-291.
Careau, V., Wolak, M. E., Carter, P. A. and Garland, T., Jr. (2013). Limits to behavioral evolution: the quantitative genetics of a complex trait under directional selection.Evolution67, 3102-3119.
Castellini, M. A. and Somero, G. N.(1981). Buffering capacity of vertebrate muscle: correlations with potentials for anaerobic function. J. Comp. Physiol. 143, 191-198.
Chase, P. B. and Kushmerick, M. J.(1988). Effects of pH on contraction of rabbit fast and slow skeletal muscle fibers.Biophys. J.53, 935.
Chasiotis, D., Hultman, E. and Sahlin, K.(1983). Acidotic depression of cyclic AMP accumulation and phosphorylase b to a transformation in skeletal muscle of
man.J. Physiol.335, 197-204.
Claghorn, G. C., Thompson, Z., Kay, J. C., Ordonez, G., Hampton, T. G. and Garland, T.Jr. (2017). Selective breeding and short-term access to a running wheel alter stride characteristics in house mice.Physiol. Biochem. Zool.90, 533-545.
Copes, L. E., Schutz, H., Dlugosz, E. M., Acosta, W., Chappell, M. A. and Garland, T.Jr. (2015). Effects of voluntary exercise on spontaneous physical activity and food consumption in mice: results from an artificial selection experiment.Physiol. Behav.149, 86-94.
Crush, K. G.(1970). Carnosine and related substances in animal tissues.Comp.
Biochem. Physiol.34, 3-30.
Davey, C. L.(1960). The significance of carnosine and anserine in striated skeletal muscle.Arch. Biochem. Biophys.89, 303-308.
Dlugosz, E. M., Chappell, M. A., McGillivray, D. G., Syme, D. A. and Garland, T.Jr. (2009). Locomotor trade-offs in mice selectively bred for high voluntary wheel running.J. Exp. Biol.212, 2612-2618.
Donaldson, S. K. B., Hermansen, L. and Bolles, L.(1978). Differential, direct effects of H+ on Ca2+-activated force of skinned fibers from the soleus, cardiac and adductor magnus muscles of rabbits.Pflüg. Arch.376, 55-65.
Donovan, C. M. and Pagliassotti, M. J. (2000). Quantitative assessment of pathways for lactate disposal in skeletal muscle fiber types.Med. Sci. Sports
Exerc.32, 772-777.
Dunnett, M. and Harris, R. C.(1995). Carnosine and taurine contents of type I, IIA and IIB fibres in the middle gluteal muscle.Equine Vet. J.27, 214-217.
Journal
of
Experimental
Dunnett, M., Harris, R. C., Soliman, M. Z. and Suwar, A. A. S.(1997). Carnosine, anserine and taurine contents in individual fibres from the middle gluteal muscle of the camel.Res. Vet. Sci.62, 213-216.
Fitts, R. H.(1994). Cellular mechanisms of muscle fatigue.Physiol. Rev.74, 49-94.
Garland, T., Jr and Freeman, P. W.(2005). Selective breeding for high endurance running increases hindlimb symmetry.Evolution59, 1851-1854.
Garland, T., Jr, Morgan, M. T., Swallow, J. G., Rhodes, J. S., Girard, I., Belter, J. G. and Carter, P. A.(2002). Evolution of a small-muscle polymorphism in lines of house mice selected for high activity levels.Evolution56, 1267-1275.
Garland, T., Jr, Schutz, H., Chappell, M. A., Keeney, B. K., Meek, T. H., Copes, L. E., Acosta, W., Drenowatz, C., Maciel, R. C., van Dijk, G. et al.(2011). The biological control of voluntary exercise, spontaneous physical activity and daily energy expenditure in relation to obesity: human and rodent perspectives.J. Exp.
Biol.214, 206-229.
Girard, I., McAleer, M. W., Rhodes, J. S. Garland, T., Jr. (2001). Selection for high voluntary wheel-running increases speed and intermittency in house mice (Mus
domesticus).J. Exp. Biol.204, 4311-4320.
Guderley, H., Houle-Leroy, P., Diffee, G. M., Camp, D. M. and Garland, T.Jr. (2006). Morphometry, ultrastructure, myosin isoforms, and metabolic capacities of the“mini muscles”favoured by selection for high activity in house mice.Comp.
Biochem. Physiol. B Biochem. Mol. Biol.144, 271-282.
Guderley, H., Joanisse, D. R., Mokas, S., Bilodeau, G. M. and Garland, T.Jr. (2008). Altered fibre types in gastrocnemius muscle of high wheel-running selected mice with mini-muscle phenotypes. Comp. Biochem. Physiol. B
Biochem. Mol. Biol.149, 490-500.
Haizlip, K. M., Harrison, B. C. and Leinwand, L. A.(2015). Sex-based differences in skeletal muscle kinetics and fiber-type composition.Physiology30, 30-39.
Harris, R. C., Marlin, D. J., Dunnett, M., Snow, D. H. and Hultman, E.(1990). Muscle buffering capacity and dipeptide content in the thoroughbred horse, greyhound dog and man.Comp. Biochem. Physiol.97A, 249-251.
Houle-Leroy, P., Guderley, H., Swallow, J. G. and Garland, T.Jr. (2003). Artificial selection for high activity favors mighty mini-muscles in house mice.
Am. J. Physiol. Regul. Integr. Comp. Physiol.284, R433-R443.
Jensen, L., Bangsbo, J. and Hellsten, Y.(2004). Effect of high intensity training on capillarization and presence of angiogenic factors in human skeletal muscle: capillarization in exercise-trained skeletal muscle.J. Physiol.557, 571-582.
Juel, C.(2008). Regulation of pH in human skeletal muscle: adaptations to physical activity.Acta Physiol.193, 17-24.
Juel, C., Lundby, C., Sander, M., Calbet, J. A. L. and van Hall, G.(2003). Human skeletal muscle and erythrocyte proteins involved in acid-base homeostasis: adaptations to chronic hypoxia.J. Physiol.548, 639-648.
Juel, C., Holten, M. K. and Dela, F.(2004a). Effects of strength training on muscle lactate release and MCT1 and MCT4 content in healthy and type 2 diabetic humans: MCT, type 2 diabetes and training.J. Physiol.556, 297-304.
Juel, C., Klarskov, C., Nielsen, J. J., Krustrup, P., Mohr, M. and Bangsbo, J.
(2004b). Effect of high-intensity intermittent training on lactate and H+ release from human skeletal muscle.AJP Endocrinol. Metab.286, E245-E251.
Kelly, S. A., Czech, P. P., Wight, J. T., Blank, K. M. and Garland, T.Jr. (2006). Experimental evolution and phenotypic plasticity of hindlimb bones in high-activity house mice.J. Morphol.267, 360-374.
Kelly, S. A., Nehrenberg, D. L., Hua, K., Garland, T., Jr and Pomp, D.(2014). Quantitative genomics of voluntary exercise in mice: transcriptional analysis and mapping of expression QTL in muscle.Physiol. Genomics46, 593-601.
Kelly, S. A., Gomes, F. R., Kolb, E. M., Malisch, J. L. and Garland, T.Jr. (2017). Effects of activity, genetic selection and their interaction on muscle metabolic capacities and organ masses in mice.J. Exp. Biol.220, 1038-1047.
Kolb, E. M., Kelly, S. A., Middleton, K. M., Sermsakdi, L. S., Chappell, M. A. and Garland, T.Jr. (2010). Erythropoietin elevates but not voluntary wheel running in mice.J. Exp. Biol.213, 510-519.
Mannion, A. F., Jakeman, P. M., Dunnett, M., Harris, R. C. and Willan, P. L. T.
(1992). Carnosine and anserine concentrations in the quadriceps femoris muscle of healthy humans.Eur. J. Appl. Physiol.64, 47-50.
Meek, T. H., Lonquich, B. P., Hannon, R. M. and Garland, T.Jr. (2009). Endurance capacity of mice selectively bred for high voluntary wheel running.J. Exp. Biol.
212, 2908-2917.
Okuma, E. and Abe, H.(1992). Major buffering constituents in animal muscle.
Comp. Biochem. Physiol.102A, 37-41.
Parkhouse, W. S., McKenzie, D. C., Hochachka, P. W. and Ovalle, W. K.(1985). Buffering capacity of deproteinized human vastus lateralis muscle.J. Appl.
Physiol.58, 14-17.
Peñafiel, R., Ruzafa, C., Monserrat, F. and Cremades, A.(2004). Gender-related differences in carnosine, anserine and lysine content of murine skeletal muscle.
Amino Acids26, 53-58.
Pilegaard, H., Bangsbo, J., Richter, E. A. and Juel, C.(1994). Lactate transport studied in sarcolemmal giant vesicles from human muscle biopsies: relation to training status.J. Appl. Physiol.77, 1858-1862.
Pilegaard, H., Domino, K., Noland, T., Juel, C., Hellsten, Y., Halestrap, A. P. and Bangsbo, J.(1999). Effect of high-intensity exercise training on lactate/H+ transport capacity in human skeletal muscle.Am. J. Physiol. Endocrinol. Metab.
276, E255-E261.
Rezende, E. L., Gomes, F. R., Malisch, J. L., Chappell, M. A. and Garland, T.Jr. (2006). Maximal oxygen consumption in relation to subordinate traits in lines of house mice selectively bred for high voluntary wheel running.J. Appl. Physiol.
101, 477-485.
Sahlin, K. and Henriksson, J.(1984). Buffer capacity and lactate accumulation in skeletal muscle of trained and untrained men.Acta Physiol. Scand.122, 331-339.
Swallow, J. G., Carter, P. A. and Garland, T., Jr. (1998). Artificial selection for increased wheel-running behavior in house mice.Behav. Genet.28, 227-237.
Swallow, J. G., Hayes, J. P., Koteja, P. and Garland, T.Jr. (2009). Selection experiments and experimental evolution of performance and physiology.Exp.
Evol. Concepts Methods Appl. Sel. Exp.301-351.
Syme, D. A., Evashuk, K., Grintuch, B., Rezende, E. L. and Garland, T., Jr. (2005). Contractile abilities of normal and“mini”triceps surae muscles from mice
(Mus domesticus) selectively bred for high voluntary wheel running.J. Appl.
Physiol.99, 1308-1316.
Talmadge, R. J., Acosta, W. and Garland, T.Jr. (2014). Myosin heavy chain isoform expression in adult and juvenile mini-muscle mice bred for high-voluntary wheel running.Mech. Dev.134, 16-30.
Thompson, Z., Argueta, D., Garland, T., Jr and DiPatrizio, N.(2017). Circulating levels of endocannabinoids respond acutely to voluntary exercise, are altered in mice selectively bred for high voluntary wheel running, and differ between the sexes.Physiol. Behav.170, 141-150.
Trivedi, B. and Danforth, W. H.(1966). Effect of pH on the kinetics of frog muscle phosphofructokinase.J. Biol. Chem.241, 4110-4114.
Weston, A. R., Myburgh, K. H., Lindsay, F. H., Dennis, S. C., Noakes, T. D. and Hawley, J. A. (1997). Skeletal muscle buffering capacity and endurance performance after high-intensity interval training by well-trained cyclists.
Eur. J. Appl. Physiol.75, 7-13.
Wong, L. E., Garland, T., Jr, Rowan, S. L. and Hepple, R. T.(2009). Anatomic capillarization is elevated in the medial gastrocnemius muscle of mighty mini mice.
J. Appl. Physiol.106, 1660-1667.