RESEARCH ARTICLE
Accumulation and excretion of manganese ion in the kidney
of
Mytilus galloprovincialis
Hidefumi Wakashin1, Eriko Seo2and Yoshiteru Seo1,*
ABSTRACT
T1-weighted magnetic resonance imaging (T1w-MRI) was employed to detect the accumulation of manganese ion (Mn2+) in urine in the kidney of the musselMytilus galloprovincialis, and the longitudinal relaxation rates (1/T1=R1) were measured. When the mussel was exposed to seawater containing 10 µmol l−1 Mn2+, the T
1w-MRI intensity andR1of the kidney, stomach and digestive glands were increased. Mn2+ might be taken into the hemolymph via the gastrointestinal tract, and then filtrated into the pericardium via the auricles. Although the image intensity in the pericardium was not affected by manganese, an image intensity enhancement was observed in the distal part of the renopericardial communication canals between the pericardium and the kidneys, indicating Mn2+was concentrated in the excretion pathway. As the seawater Mn2+ concentration ([Mn2+]
SW) was increased from 3 to 50 µmol l−1,R1of the kidney (R1K) was elevated. When the mussels were immersed in 3–10 µmol l−1[Mn2+]
SWfor 24 h, the Mn2+concentration in the kidney ([Mn2+]
K) showed a 15-fold increase compared with the ambient [Mn2+]
SW. In the range of [Mn2+]SW from 10 to 50 µmol l−1, R1K reached a plateau level that corresponded to 200 µmol l−1[Mn2+]
K. As [Mn2+]
Kfell transiently, voluntary excretion of urine from the kidney was assumed. The decreases in intensity were not synchronized between the right and left kidneys, and the closure of the shells might not be essential for urinary excretion. The voluntary excretion suggested an additional explanation for the large range in metal concentratons in the kidneys of the mussel.
KEY WORDS: Nephridia, Heavy metal,T1relaxation time,
Magnetic resonance imaging
INTRODUCTION
The excretion system of mussels consists of kidneys and the pericardium (Martin and Harrison, 1966; Bayne, 1976). Hemolymph is filtered by the auricular wall in the heart (Andrews and Jennings, 1993). Secretion, absorption and storage might be attributed to the kidneys (Martin and Harrison, 1966; Bayne, 1976). In freshwater bivalves, the excretion of hypo-osmotic urine was reported as a means to maintain the osmolality of body fluid. For example, the salt concentration in the final urine is approximately half of the pericardial filtrate (Picken, 1937), and the absorption of chloride and calcium have been detected inAnodonta(Florkin and
Duchâteau, 1948). Meanwhile, it is known that marine bivalves are euryhaline (Robertson, 1964). It has been shown that the concentration of electrolytes in the hemolymph of Mytilus were virtually in equilibrium with the external medium (Robertson, 1953). It has been considered that the function of osmoregulation, such as the dilution or concentration of urine, is very limited, and even NH3/NH4+was not enriched inMytilus(Bayne, 1976; Thomsen et al., 2016). Intensive studies have been focused on the accumulation of heavy metal ions such as cadmium, copper, mercury and manganese in bivalves, and the kidney is one of the marked organs that accumulate metals (Bayne, 1976). These studies have been conducted usingin vitrotechniques such as chemical and histochemical analysis (George et al., 1982), autoradiography (Soto and Cajaraville, 1966), X-ray microanalysis and atomic absorption spectroscopy (Carmichael et al., 1979). As far as we know, no time-resolved in vivo studies have been performed to elucidate the mechanism of the accumulation of heavy metals in the kidney, mainly owing to technical limitations.
In our previous report, we applied a magnetic resonance imaging (MRI) method in a study of the musselMytilus galloprovincialis, and also estimated the filtration volume through the auricles of the heart, and determined the direction of the flow of hemolymph in the renopericardial canal (Seo et al., 2014a). The image contrast of MRI is determined mainly by the longitudinal relaxation time (T1) and the spin-lattice relaxation time (T2). TheT1relaxation rate (1/T1=R1) is the exponential decay constant of the magnetic moment of the1H nuclei of water. The nominalR1value for seawater is approximately 0.5 s−1. Some of the heavy metals are paramagnetic, such as the manganese ion (Mn2+), which could accelerateT
1relaxation. Thus, when Mn2+is added to seawater, theR
1is increased, depending on the concentration. Therefore,R1in the kidney should be increased when Mn2+ is concentrated in the kidney. In order to test this hypothesis, we (1) measuredT1-weighted MRI (T1w-MRI) signals andR1of the urine in the kidney of mussels enhanced by Mn2+, and (2) evaluated the relationship between the Mn2+concentration and R1 of the urine in the kidney. We also examined the (3) time-dependentR1 value changes shown by urine in the kidney using three-dimensional T1w-MRI. The results suggested voluntary excretion of urine from the kidney of mussels.
MATERIALS AND METHODS Experimental mussels
TheMytilus galloprovincialisLamarck 1819 used in this study were supplied by Hamasui Co., Ltd (Hiroshima, Japan). These mussels were collected from a subtidal zone and cultivated using a floating suspended culture off the shore of Miyajima, Hiroshima, in April and July 2015. At the laboratory, in two separate 5 liter baths, 10 mussels were kept in each bath for a week in aerated synthetic seawater (salinity 36‰) at room temperature (20–24°C) (Seo et al., 2014b). A total of 15 mussels were used in this MRI study. The length of the mussels was 35.7±0.6 mm (mean±s.e.m). All of the
Received 24 May 2018; Accepted 23 July 2018
1Department of Regulatory Physiology, Dokkyo Medical University School of Medicine, Tochigi 321-0293, Japan.2Department of Marine Ecosystem Dynamics, Division of Marine Life Science, Atmosphere and Ocean Research Institute, The University of Tokyo, Kashiwa 277-8564, Japan.
*Author for correspondence (yseo@dokkyomed.ac.jp)
E.S., 0000-0003-0879-9083; Y.S., 0000-0001-9775-4738
Journal
of
Experimental
animal experiments in this study were carried out under the rules and regulations of the‘Guiding Principles for the Care and Use of Animals’set by the Physiological Society of Japan, and approved by the Animal Research Councils at Dokkyo University School of Medicine.
Magnetic resonance imaging
The MRI examination of theM. galloprovincialisin this study used procedures noted in previous reports (Seo et al., 2014a, 2016). In brief, the mussels were placed in a plastic tube (inner diameter of 22.5 mm), and each mussel was positioned in place using a piece of elastic silicone strip that was inserted at the hinge position of the shell. The mussels were immersed in 15 ml of synthetic seawater without aeration, and the temperature was kept at 20°C. Seawater was exchangeable through another tube set in the bottom of the tube holding the mussel. The1H MR images were obtained by a 7 T MRI system (AVANCE III, Bruker Biospin, Ettlingen, Baden-Württemberg, Germany) and equipped with an active shielded gradient (micro2.5) and a 25-mm1H birdcage radiofrequency coil. T1relaxation time was measured by a two-dimensional saturation-recovery imaging method with five relaxation delays from 0.1 s to 4 s. The pixel size was 190×190 µm and the slice thickness was 1 mm. The total image acquisition time was 9 min 21 s. In order to take in the whole structure of the kidney, three-dimensional T1-weighted gradient-echo imaging (3D T1w-MRI) was used. The typical parameters used were a voxel size of 190×190×190 µm, a combination of TR/TE/θ=50 ms/3 ms/45 deg, where TR, TE and θ are relaxation delay, echo time and flip angle, respectively, and the total image acquisition time was 31 min. The time-lapse MR signal in the kidney was analyzed by 3D T1w-MRI with a voxel size of 380×380×380 µm, and a combination of TR/TE/θ=50 ms/2.5 ms/ 45 deg. Three-dimensional images were obtained every 3 min 24 s. In the histological examinations, high-resolution 3DT2-weighted rapid acquisition with relaxation enhancement imaging (3DT2w-MRI) was employed, with a voxel size of 60×60×60 µm, with a combination of TR/TE/RARE-factor=1500 ms/30 ms/8, where RARE-factor is the number of phase-encoding steps per single excitation, and the 3D T1w-MRI was measured with a voxel size of 60×60×60 µm with a combination of TR/TE=100 ms/4 ms. The increase in theT1w-MR image intensity (ΔI) was calculated as follows:
DI¼M=MC1; ð1Þ whereMCis an average of the image intensity (M) of four images before Mn2+exposure.
The T1 values of the MnCl2 solutions (1.2–6 mmol l−1) were measured by inversion recovery pulse sequences with a 10-mm1H coil at 22°C. The relaxivity of Mn2+was calculated from the slope of a linear regression line [6.3 l (s mmol)−1].
Histology
All of the mussels were fixed with 4% paraformaldehyde (PFA) for the histological examinations, and embedded in paraffin wax after dehydration. The paraffin sections were prepared using a slice thickness of 10 µm. The sections were stained with hematoxylin & eosin (H&E). Images were captured and combined using a microscope (BZ-9000, Keyence, Osaka, Japan) with an image-stitching mode.
RESULTS
Accumulation of manganese ion in the kidney of M. galloprovincialis
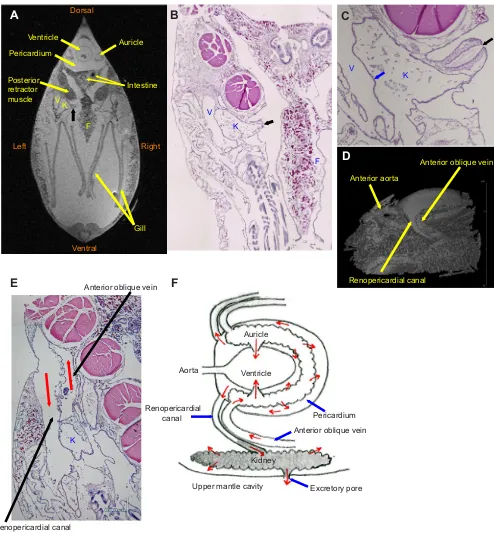
First, we reviewed the anatomy ofM. galloprovincialisusing MRI images and light microscopic analysis. The orientation of the organs are shown in a transverse MRI image obtained 3 mm posterior from the auriculoventricular valve (Fig. 1A). The kidneys were located on the dorsal side of the gill, on the inner side of the anterior oblique vein, and on the ventral side of the posterior retractor muscles. The shape of the kidney wall was lobular, and some parts were adjacent to the venous wall with no interstitial space (Fig. 1A–C). In order for a mussel to excrete urine, it is thought that the excretory pore opens to the upper mantle cavity connecting to the exhalant siphon (Fig. 1B). The excretory pore consisted of a short duct surrounded by muscular tissue (Fig. 1C). The kidneys were connected with the pericardium through the renopericardial canal. The renopericardial canal and the anterior oblique vein run side by side (Fig. 1D). Some parts of the wall of the renopericardial canal were lobular and parallel with the anterior oblique vein with no interstitial space (Fig. 1E). The structure of the kidney, heart and adjacent vessels were illustrated in a schematic diagram (Fig. 1F).
Next, we examined the distribution of a heavy metal, manganese ion, in the mussels using MRI. In the mussels fixed with PFA, the anatomical structure of the kidney was detected in the T1w-MR images (Fig. 2A), but in the living mussels, it was difficult to identify the kidney becauseT1relaxation rate (R1) values of kidney (0.551±0.035 s−1; mean±s.e.m, n=28) were similar to those of surrounding tissues and seawater (Table 1, Fig. 2B). When a live mussel was immersed in 300 ml aerated seawater containing 50 µmol l−1MnCl
2, the kidneys and digestive organs were depicted at a higher signal intensity (Fig. 2C). TheR1of the kidney transiently increased for 2–10 h, then decreased at 24 h of exposure to Mn2+ (1.83±0.132 s−1,n=14; Table 1). In a separate experiment,R
1of the kidney was maintained at almost the same level after 50 h of exposure to Mn2+(1.81±0.301 s−1,n=4). When the mussel was returned to normal seawater, theR1of the kidney decreased slowly, and returned to the control level at 72 h (Table 1). Therefore,M. galloprovincialis seemed to concentrate Mn2+ in the kidney from the surrounding seawater, and seemed to excrete Mn2+from the kidney.
Considering these results, the T1w-MR image of the kidney seemed to be contrasted by the accumulated manganese ion. However, it is known thatT1w-MR image intensity is affected by flow, such as the circulation of body fluids (Bock et al., 2001; Seo et al., 2014b). In order to eliminate the effect of flow in the kidney, the mussel was anesthetized using 4% MgCl2. In a transverse image of the region around the heart, the kidneys and gastrointestinal tract were depicted at a higher signal intensity compared with the PFA fixation, but without Mn2+, similar to Fig. 2A (Fig. 3A). After the application of 50 µmol l−1 Mn2+, the pericardium, ventricle and List of symbols and abbreviations
AV auriculoventricular FOV field of view H&E hematoxylin & eosin K relaxivity value of Mn2+
KM stability constant of metal complex
MRI magnetic resonance imaging PFA paraformaldehyde
R1 longitudinal relaxation rate (1/T1)
T1 longitudinal relaxation time
T2 spin-lattice relaxation time
T1w-MRI T1-weighted gradient-echo magnetic resonance imaging
T2w-MRI T2-weighted rapid acquisition with relaxation enhancement
magnetic resonance imaging TE echo time
TR relaxation delay
θ flip angle
Journal
of
Experimental
auricles of the heart were not enhanced, but the kidneys were clearly contrasted (Fig. 3B). These results indicated the T1w-MRI signal intensity in the kidneys was not affected by the flow. The 3D reconstructed image of the kidneys showed the whole structure of the kidneys in the same condition as shown in Fig. 3B (Fig. 3C; Movie 1). The anterior–posterior lengths of the right and left
kidneys were 16.6 mm and 15 mm, respectively, and the volumes of the right and left kidneys were 24 µl and 14 µl, respectively. It is interesting to note that the pericardial canals were depicted from the middle of the canal to the kidneys, leading to the speculation that the renopericardial canals might participate in the concentration of manganese ion (* in Figs 3C and 1F).
Auricle
Renopericardial
canal Pericardium Ventricle
Kidney
Excretory pore Upper mantle cavity
Aorta
F
Anterior oblique vein
K V
V
K
Pericardium Ventricle
Auricle
Posterior retractor muscle
F
F
Gill Intestine
Dorsal
Ventral
Left Right
A
B
Renopericardial canal
Anterior oblique vein
Anterior aorta
C
D
K V
E
Renopericardial canal
Anterior oblique vein
[image:3.612.61.555.54.590.2]K
Fig. 1. Anatomical structure of the kidneys ofMytilus galloprovincialis.(A) TransverseT2w-MR image ofM. galloprovincialisfixed by paraformaldehyde
(PFA) at 3 mm posterior from the auriculoventricular (AV) valves. (B) Transverse image of hematoxylin & eosin (H&E) staining corresponding to panel A. (C) Transverse image of H&E staining around the excretory pore surrounded by muscular tissues. (D) A 3D reconstructed image of the heart and adjacent vessels. (E) Transverse images of H&E staining at the renopericardial canal and the anterior oblique vein. (F) Schematic diagram of the kidneys, heart and adjacent vessels. The gray area indicates the kidneys and renopericardial canals contrasted by Mn2+. Labeled features: K, kidneys; V, anterior oblique vein;
F, foot. The black arrows in A–C indicate the excretory pores of the kidneys. The blue arrow in C indicates a wall between the kidneys and the vein. The red arrows in E and F indicate the direction of flow.
Journal
of
Experimental
Concentration of manganese ion in the kidneys of M. galloprovincialis
In order to detect the concentration dependency of Mn2+ accumulation, the mussels were immersed in seawater containing 1 to 50 µmol l−1 MnCl
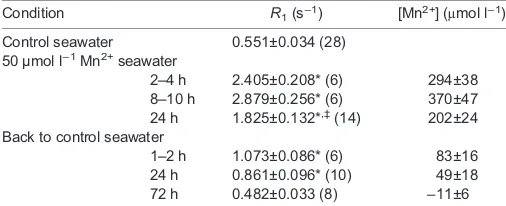
2. The R1 values of the kidneys were measured before and 24 h after the exposure to the MnCl2, because R1values were stable from 24 to 50 h of Mn2+exposure. As shown in Fig. 4A,R1was MnCl2concentration dependent and elevated, and significantly increased at 3 µmol l−1 and above, reaching a plateau level at over 10 µmol l−1 (around 1.6 s−1). TheR
1value depends on the concentration of Mn2+([Mn2+]) as follows:
R1¼R0þK ½Mn2þ; ð2Þ
whereR0is the intrinsicR1of the urine andKis the relaxivity value of Mn2+ [6.3 1 (s mmol)−1]. Fig. 4B shows the [Mn2+] in the kidneys, which was estimated by the R1 values. The maximum [Mn2+] was 15-fold higher in the kidneys compared with the ambient [Mn2+] in seawater, which was less than 10μmol l−1Mn2+. At the same time, the fold change of Mn2+ concentration was decreased at values higher than 10 µmol l−1Mn2+in seawater.
Time-lapse analysis of manganese ion in the kidneys of M. galloprovincialis
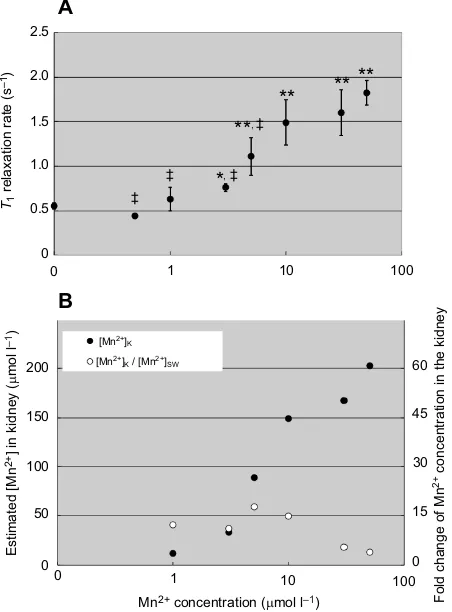
In order to analyze the initial increasing phase of the [Mn2+] in the kidney, the accumulation of Mn2+ in the kidneys was measured using 24 kidneys of 12 mussels. TheT1w-MR image intensity of the
kidneys was continuously/linearly increased for the first 2 h in 12 kidneys of eight mussels. A typical result is shown in Fig. 5A and Movie 2-1. When the normal seawater was replaced by seawater containing Mn2+, the signal intensity of the stomach increased instantaneously, which was then followed by the increase in the kidneys after a delay of a few minutes. The rate of increase of the signal intensity was constant, and the rates in the respective kidneys were similar to each other. As shown in the sagittal image of the left kidney (Movie 3), the signal intensity increased in the same pattern as seen in the long axis of the kidney. The image intensity of the seawater increased a bit owing to the 10 µmol l−1 Mn2+, then decreased gradually owing to uptake of Mn2+ into the mussel. The MR signals in the soft tissues were constant, except for the digestive organs, such as the stomach and the intestine. Because the increase of theT1w-MR image intensity with a short echo time was proportional to the Mn2+concentration (Fig. S1), the [Mn2+] in the kidneys was estimated by the acquired MR image intensity. The means±s.e.m for 12 kidneys are shown in Fig. 5D. The initial increase rate of [Mn2+] in the kidney (4.83±0.58 µmol l−1min−1, n=12) was calculated from the slope of the regression line of [Mn2+] at 10–40 min. A linear regression line of the increase in [Mn2+] was determined by the increase in [Mn2+] at 10–40 min, and the intercept to time axis was defined as the initial delay of [Mn2+] increase in the kidney (8.16±0.44 min,n=12).
In contrast, in some kidneys, the maximal image intensity of the kidney fell to below 50 µmol l−1and increased again after a short interval. A single intensity fall was observed in six kidneys of five mussels, and one example is shown in Fig. 6 and Movie 2-2. In this experiment, the mussel was immersed in 10 µmol l−1Mn2+seawater for the first 2 h, and thereafter, the 10 µmol l−1Mn2+seawater was replaced by 20 µmol l−1Mn2+ seawater. At first, [Mn2+] in both kidneys increased in the same kinetic pattern, but the [Mn2+] of the right kidney dropped to almost the basal level at 58 min. Then, the [Mn2+] of the right kidney started to increase again, and [Mn2+] increased at a rate similar to that seen in the left kidney. The [Mn2+] in the right and left kidneys at 120 min was estimated at 200 and 250 µmol l−1, respectively. When the seawater was replaced by 20 µmol l−1Mn2+seawater, the signal intensities in both kidneys dropped significantly. Thereafter, the image intensity increased again instantaneously. The average of the three drops was 173.5±26.6 µmol l−1. The fraction of residual urine in the kidney could be estimated as a ratio of Mn2+concentration after and before the drop (13.3±0.3%).
The rest of the six kidneys of three mussels demonstrated transient falls in [Mn2+] more than two times. Twelve falls showed
A
KidneyB C
Gill
Intestine Intestine Intestine Kidney
Dorsal
Ventral
[image:4.612.75.537.57.190.2]Left Right
Fig. 2. Manganese uptake of the kidneys ofM. galloprovincialis.(A) TransverseT1w-MR image ofM. galloprovincialisfixed by PFA 4 mm posterior to
the AV valves. (B) TransverseT1w-MR image of a livingM. galloprovincialisbefore the addition of Mn2+. (C) TransverseT1w-MR image after 24 h of exposure to
seawater containing 50 µmol l−1Mn2+at 20°C.
Table 1.T1relaxation rate (R1) of urine in the kidney ofMytilus
galloprovincialisand manganese concentration ([Mn2+]) estimated
fromR1before, during and after 50 µmol l−1Mn2+exposure
Condition R1(s−1) [Mn2+] (μmol l−1)
Control seawater 0.551±0.034 (28) 50 µmol l−1Mn2+seawater
2–4 h 2.405±0.208* (6) 294±38 8–10 h 2.879±0.256* (6) 370±47 24 h 1.825±0.132*,‡(14) 202±24
Back to control seawater
1–2 h 1.073±0.086* (6) 83±16 24 h 0.861±0.096* (10) 49±18
72 h 0.482±0.033 (8) −11±6
The asterisks indicate a significant increase inR1compared with that before
Mn2+exposure (two-tailedt-test, *P<0.01). The double dagger represents
a statistically significant decrease inR1compared with values at 2–4 h and
8–10 h (‡P<0.01). The number in parenthesis is the number of kidneys. TheR1
of the control seawater was 0.494±0.124 s−1(14), showing no significant
difference compared withR1of the kidney in the control seawater (P>0.01).
Journal
of
Experimental
[image:4.612.47.300.576.679.2]drops of more than 75 µmol l−1 (106.2±7.1 µmol l−1), and the average fraction of residual urine was 34.5±5.6%. Typical results are shown in Fig. 7 and Movie 2-3. The right kidney demonstrated
transient falls in [Mn2+] of the kidney three times, and the left kidney demonstrated transient falls four times. The falls in [Mn2+] were not synchronized between the right and left kidneys. However, the falls in [Mn2+] were synchronized between four slices from the posterior side to the anterior side of the kidney.
DISCUSSION
Accumulation of manganese in the kidneys of M. galloprovincialis
[image:5.612.73.539.58.192.2]This is the first study to visualize manganese ion accumulation in the urine of kidneys of bivalves using signal enhancement ofT1w-MRI. Because the image intensity andR1 of the stomach and digestive glands also increased, the Mn2+ might have been taken from the gastrointestinal tract, and then filtrated into the pericardium by auricles. There were no signal enhancements in the auricles or the pericardium. Therefore, the Mn2+was filtrated by the auricular wall, and was not concentrated in the auricles or the pericardium. Accumulation of the Mn2+was detected not only in the kidneys, but also in the distal part of the renopericardial canals (* in Fig. 3C). Consider the following evidence. (1) The walls of the renopericardial canal were attached to the anterior oblique vein, and the wall was a convex surface into the anterior oblique vein (Fig. 1E). This is the same in the wall of auricles that showed a convex surface into the pericardium. (2) Podocytes were distributed in the wall of the anterior oblique vein, and the podocytes faced the renopericardial canal (Pirie and George, 1979). It is supposed that the hemolymph fluid was filtered through the lobular wall into the vein, and then Mn2+was concentrated in the kidneys. However, as shown in the sagittal image of the left kidney (Movie 3) and in Fig. 7, the enhanced signal was observed in the long axis of the kidney, but it did not start to increase from the middle of the kidneys. Therefore, the distal part of the renopericardial canal might also function as the kidneys do, and a large surface area might be necessary to reabsorb water and electrolytes, etc. We admit the possibility of back diffusion of Mn2+from the kidney, because we could not detect any valve structure in the renopericardial canal or the convoluted funnel (renopericardial funnel) as reported by Pirie and George (1979).
The kidney is composed of a series of highly branched lobules with a single layered columnar epithelium with a brush border, basal nuclei, infolded basal membranes and many membrane-limited granules (Pirie and George, 1979). The kidney is one of the marked organs that accumulate metals such as cadmium (Cd), copper (Cu), mercury (Hg), zinc (Zn) and Mn (Bayne, 1976). Using isolated
A
Kidney
B C
Gill Ventricle
Kidney Stomach
Auricle
Kidney
i
* *
Left Right
Anterior
Posterior
Fig. 3. Three-dimensional structure of the kidneys ofM. galloprovincialis.(A) TransverseT1w-MR image ofM. galloprovincialisfixed by PFA 1 mm
anterior to the AV valves. (B) TransverseT1w-MR images of a livingM. galloprovincialisafter 3 weeks of exposure to seawater containing 50 µmol l−1Mn2+at 20°C.
The mussel was anesthetized by 4% MgCl2. (C) A 3D reconstructed image of the kidneys, stomach and a part of the intestine (i). * indicates the
renopericardial canal. Also see Movie 1.
0
** **
** ‡ A
B
**
Estimated [Mn
2+
] in kidney (
µ
mol l
–1
)
T1
relaxation rate (s
–1
)
Fold change of Mn
2+ concentration in the kidney
‡
‡
Mn2+ concentration (µmol l–1)
2.5
2.0
1.5
1.0
0.5
0
200
150
100
50
0
[Mn2+]
K
[Mn2+]
K / [Mn2+]SW
1 10 100
60
45
30
15
0
0 1 10 100
,
* ,‡
Fig. 4. Concentration dependency on the uptake of Mn2+to the kidneys of
M. galloprovincialis.(A) The longitudinal relaxation rate (R1) of the kidneys was
measured after 24 h of exposure to seawater containing Mn2+at 20°C.
The means±s.e.m. were calculated from four to six kidneys for mussels exposed to Mn2+, and also from 28 kidneys before the Mn2+exposure. Asterisks
represent statistically significant differences inR1before and after the Mn2+
exposure (two-tailedt-test, *P<0.05, **P<0.01). Double daggers represent statistically significant differences inR1compared withR1of 50 µmol l−1Mn2+
exposure (‡P<0.01). (B) Concentration of Mn2+in the kidney ([Mn2+] K) (filled
circles) estimated from the increase inR1and the relaxivity of Mn2+. Fold change
of Mn2+concentration in the kidney (open circles) was calculated from [Mn2+] K/
[Mn2+]
SW, where [Mn2+]SWis the Mn2+concentration of the seawater.
Journal
of
Experimental
[image:5.612.63.289.312.618.2]lipofuschin granules ofMytilus edulis, stability constants (KM) of Cd2+ and Zn2+ were determined to be approximately 5 (George, 1983). Because theKMof these ions is smaller than that of the strong chelating compounds, such as EDTA (KM=16.5), the binding of
Cd2+and Zn2+might be reversible depending on the concentration of Cd2+ and Zn2+ (George, 1983). For example, the fraction of binding metal forKM=5 is estimated as 50% at a metal concentration of 10 µmol l−1(Seo et al., 2013). In general, theK
M for Mn2+is –0.2
0 0.2 0.4 0.6 0.8 1.0 1.2 1.4 1.6 1.8 2.0 2.2
–20 0 20 40 60 80
Time (min)
Kidney (right) Kidney (left) Stomach Seawater
B
C
A
Kidney
Kidney
Increase of
T1w
-MRI intensity
Left Right
Ventral Dorsal
Dorsal
Ventral
Anterior Posterior
10 µmol l–1Mn2+
d
D
Time (min) –20
–50 0 50 100 150 200 250 300 350 400
0 20 40 60 80 100 120
Mn
2+
concentration (
µ
mol l
–1
[image:6.612.78.535.60.365.2])
Fig. 5. Time-course-dependent changes in the accumulation of Mn2+in the kidneys ofM. galloprovincialis.(A) Changes in image intensity of T1w-MRI during the exposure of 10 µmol l−1Mn2+every 3 min 24 s. Red arrow indicates replacement of seawater with that containing 10 µmol l−1Mn2+.
(B) Transverse and (C) sagittal images of the kidneys measured 2 h after the 10 µmol l−1Mn2+exposure (also see Movies 2-1 and 3, corresponding to B and C,
respectively). (D) The mean±s.e.m. Mn2+concentration of 12 kidneys showed a continuous increase, estimated from the image intensity. The‘d’indicates
the initial delay of the increase in the Mn2+concentration (8.16±0.44 min,n=12).
Journal
of
Experimental
smaller by 1–2 compared with theKM for Cd2+ or Zn2+(Dojindo Molecular Technologies, Kumamoto, Japan). Therefore, theKMfor Mn2+could be approximately 4–3, and chelators could not bind Mn2+ effectively at a [Mn2+] of less than 100 µmol l−1. In this study, theM. galloprovincialiskidney did accumulate Mn2+in 3 µmol l−1seawater, and the maximum concentration of Mn2+was 200 µmol l−1, where the Mn2+concentration in the seawater was higher than 10 µmol l−1 (Fig. 4). When the kidneys accumulated Mn2+at concentrations of
200 µmol l−1, the epithelial cells of the kidneys would uptake Mn2+ easily, so the lipofuschin granules could bind Mn2+effectively. In the mussel, the toxic concentration of heavy metals in seawater is approximately 100 µmol l−1(Bayne, 1976). In the frog or rat, cardiac function decreased at Mn2+ concentrations of approximately 100 µmol l−1(Seo et al., 2011; Seo et al., 2013; Yang et al., 2006). Therefore, 200 µmol l−1Mn2+might be the maximum concentration at which the kidneys can maintain normal function.
Mn
2+
concentration (
µ
mol l
–1
)
10 µmol l–1Mn2+ 20 µmol l–1Mn2+
Time (min) 300
Right kidney Left kidney 250
200
150
100
50
0
–50
[image:7.612.59.497.54.303.2]–20 0 20 40 60 80 100 120 140 160 180
Fig. 6. Transient changes in Mn2+in
the kidneys ofM. galloprovincialis
associated with closure of the shells.Changes in Mn2+concentration
in the kidneys calculated fromT1w-MRI
image intensity every 3 min 24 s. Normal seawater was replaced with seawater containing 10 µmol l−1Mn2+
at 0 min, and with seawater containing 20 µmol l−1Mn2+at 125 min. Also see
Movie 2-2.
Mn
2+
concentration (
µ
mol l
–1
)
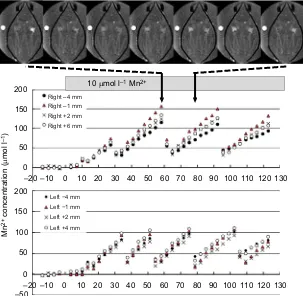
10 µmol l–1Mn2+ 200
Right –4 mm
Right –1 mm
Right +2 mm
Right +6 mm
Left −4 mm
Left −1 mm
Left +2 mm
Left +4 mm
150
100
50
0
200
150
100
50
0 –20 –50
–10 0 10 20 30 40 50 60
Time (min)
70 80 90 100 110 120 130 –20 –10 0 10 20 30 40 50 60 70 80 90 100 110 120 130
Fig. 7. Transient changes in Mn2+in the kidneys of
M. galloprovincialiswithout closure of the shells.
Changes in Mn2+concentration in the kidneys calculated from
T1w-MRI image intensity every 3 min 24 s. Normal seawater
was replaced with seawater containing 10 µmol l−1Mn2+at
0 min. The slice positions are shown from the AV valve on the posterior side (−4 mm) to the anterior side (+6 mm) of the kidney. The average s.d. of [Mn2+] was 20 µmol l−1for four
slices. Seven images from 58 min to 78.5 min are shown at the top. Also see Movie 2-3.
Journal
of
Experimental
[image:7.612.50.353.430.726.2]The accumulation of metals in the mussel has been used for monitoring pollution, and the kidney is typically one of the marked organs. (Bayne, 1976; Julshamn et al., 2001). Typical Mn2+ contents in the kidney was reported as 6 µg g−1tissue, which is approximately 100 µmol l−1 (Julshamn and Andersen, 1983). Because we may expect an increase in R1 by 0.6 s−1, we could detect Mn2+pollution byT
1w-MRI of the mussel and could also estimate the Mn2+concentration from theR
1of the kidney.
Voluntary excretion of urine from the kidneys ofM. galloprovincialis
The M. galloprovincialis kidney can concentrate Mn2+. In other words, the accumulation of Mn2+increases the toxicity to epithelial cells in the kidneys. As mentioned above, the lipofuschin granules contain the detoxication mechanisms of the mussel. We should also point out that the excretion of the urine from the kidneys is also a useful method to prevent the toxicity of the heavy metal. Anatomically, the kidneys are embedded deeply in the soft tissue, and there is no muscle layer in the wall of the kidney (Fig. 1). Therefore, at first, no one could imagine that the kidneys could excrete the urine instantaneously. As shown in Fig. 6, the right kidney cleared the urine after 58 min, and both kidneys emptied when the seawater in the chamber was replaced. Closure of the shells was associated with both cases where urine excretion was observed (Movie 2-3). These results suggest thatM. galloprovincialiscould excrete urine voluntarily. The presence of muscular tissue in the excretory pore suggested a neural control system (Fig. 1C). However, there are no muscular tissues around the kidneys. Therefore, although the kidney could not contract itself, internal pressure could be increased, possibly by the interstitial pressure, which may be due to closure of the shell by the adductor muscles, and shrinkage of soft tissue by contraction of the retractor muscles in order to minimize residual urine in the kidney (13%). However, as shown in Fig. 7 and Movie 2-3, the shells did not move in seven cases of excretion of the urine. Even when the residual urine in the kidney increased (35%, P<0.01), closure of the shells might not be essential for urine excretion. In contrast, in some mussels, this voluntary excretion of manganese ion from the kidney occurred repeatedly within 2 h, and the timing of excretion was not synchronized in the kidneys on both sides. It is unclear whether this is a physiological process or is due to the toxic effect of the manganese ion. In this study, we did not detect the details of the excretory process because 3D MR images were detected every 3.4 min. Further studies are necessary to document the voluntary excretion of the urine ofM. galloprovincialis.
In summary, we (1) usedT1w-MRI imaging inM. galloprovincialis following Mn2+exposure, and detected accumulation of Mn2+in the urine of kidneys, and (2) detected Mn2+ accumulation at a concentration of 3 µmol l−1 Mn2+ in the seawater, and the maximum Mn2+ concentration level in the urine of kidneys was 200 µmol l−1. (3) Using 3D T
1w-MRI, the changes in Mn2+ concentration were measured by duration in minutes, and we found thatM. galloprovincialiscan voluntarily excrete the urine. Thus, it is expected that there is an additional explanation for the large range in metal concentrations in the kidneys ofM. edulis(Lobel et al., 1991). Judging from these results, MRI is a useful technique that holds promise for the future investigation of the function of the kidneys in the mussel.
Acknowledgements
We offer our sincere thanks to Drs T. Okutani, K. Ohishi and T. Maruyama for providing helpful comments. We would also like to express our thanks to Drs D. Gross, V. Lehman and T. Oerther (Bruker Biospin), as well as Ms Y. Imaizumi-Ohashi and
Ms M. Yokoi-Hayakawa (DSUM) for their technical assistance. We must also thank Prof. S. Kojima (AORI, UT) for his helpful suggestions and encouragement to E.S.
Competing interests
The authors declare no competing or financial interests.
Author contributions
Conceptualization: E.S., Y.S.; Methodology: H.W., E.S., Y.S.; Investigation: H.W., E.S., Y.S.; Resources: Y.S.; Writing - original draft: H.W., Y.S.; Writing - review & editing: H.W., E.S., Y.S.
Funding
Parts of this study were supported by the Japan Society for the Promotion of Science Grant-in-Aid for Scientific Research (KAKENHI) program (JP24659102 and JP15K08185 to Y.S.).
Supplementary information
Supplementary information available online at
http://jeb.biologists.org/lookup/doi/10.1242/jeb.185439.supplemental
References
Andrews, E. B. and Jennings, K. H. (1993). The anatomical and ultrastructural basis of primary urine formation in bivalve molluscs.J. Moll. Stud.59, 223-257.
Bayne, B. L.(1976).Marine Mussels: their Ecology and Physiology. Cambridge: Cambridge University Press.
Bock, C., Frederich, M., Wittig, R.-M. and Pörtner, H.-O.(2001). Simultaneous observations of haemolymph flow and ventilation in marine spider crabs at different temperatures: a flow weighted MRI study. Magn. Reson. Imaging 19, 1113-1124.
Carmichael, N. G., Squibb, K. S. and Fowler, B. A.(1979). Metals in the molluscan kidney: a comparison of two closely related bivalve species (Argopecten), using X-ray microanalysis and atomic absorption spectroscopy.J. Fish. Res. Board Can.36, 1149-1155.
Florkin, M. and Duchâteau, G. (1948). Sur l’osmoregulation de l’anodonte (Anodonta cygneaL.).Physiol. Comp. Oecol.1, 29-45.
George, S. G.(1983). Heavy metal detoxication inMytiluskidney–anin vitrostudy of Cd- and Zn-binding to isolated tertiary lysosomes.Comp. Biochem. Physiol. C. 76, 59-65.
George, S. G., Coombs, T. L. and Pirie, B. J. S.(1982). Characterization of metal-containing granules from the kidney of the common mussel,Mytilus edulis. Bioch. Biophys. Acta716, 61-71.
Julshamn, K. and Andersen, K. J.(1983). Subcellular distribution of major and minor elements in unexposed molluscs in western Norway—II. The distribution and binding of cadmium, zinc, copper, magnesium, manganese and iron in the kidney and the digestive system of the common musselMytilus edulis.Comp. Biochem. Physiol. A75, 13-16.
Julshamn, K., Trope, E. K., Børns, C., Sæthre, L. J. and Maage, A.(2001). Cadmium, lead, copper and zinc in blue mussels (Mytilus edulis) sampled in the Hardangerfjord, Norway.J. Environ. Monit3, 539-542.
Lobel, P. B., Longerich, H. P., Jackson, S. E. and Belkhode, S. P.(1991). A major factor contributing to the high degree of unexplained variability of some elements concentrations in biological tissue: 27 elements in 5 organs of the musselMytilus as a model.Arch. Environ. Cntam. Toxicol.21, 118-125.
Martin, A. W. and Harrison, F. M.(1966). Excretion. InPhysiology of Mollusca, Vol. II (ed. K. M. Wilbur and C. W. Yonge), pp. 353-386. New York and London: Academic Press.
Picken, L. E. R.(1937). The mechanism of urine formation in invertebrates.J. Exp. Biol.14, 20-34.
Pirie, B. J. S. and George, S. G.(1979). Ultrastructure of the heart and excretory system ofMytilus edulis(L.).J. Mar. Biol. Assoc. UK.59, 819-829.
Robertson, J. D.(1953). Future studies on ionic regulation in marine invertebrates. J. Exp. Biol.30, 277-296.
Robertson, J. D.(1964). Osmotic and ionic regulation. InPhysiology of Mollusca, Vol. I (ed. K. M. Wilbur and C. W. Yonge), pp. 283-311. New York and London: Academic Press.
Seo, Y., Satoh, K., Watanabe, K., Morita, H., Takamata, A., Ogino, T. and Murakami, M.(2011). Mn-bicine: a low affinity chelate for manganese ion enhanced MRI.Magn. Reson. Med.65, 1005-1012.
Seo, Y., Satoh, K., Morita, H., Takamata, A., Watanabe, K., Ogino, T. and Murakami, M.(2013). Mn-citrate and Mn-HIDA: intermediate-affinity chelates for manganese-enhanced MRI.Contrast Media Mol. Imaging8, 140-146. Seo, E., Ohishi, K., Maruyama, T., Imaizumi-Ohashi, Y., Murakami, M. and
Seo, Y.(2014a). Testing the constant-volume hypothesis by magnetic resonance
Journal
of
Experimental
imaging of the mussel heart in the Mytilus galloprovincialis. J. Exp. Biol. 217, 964-973.
Seo, E., Ohishi, K., Maruyama, T., Imaizumi-Ohashi, Y., Murakami, M. and Seo, Y.(2014b). Magnetic resonance imaging analysis of water flow in the mantle cavity of liveMytilus galloprovincialis.J. Exp. Biol.217, 2277-2287.
Seo, E., Sazi, T., Togawa, M., Nagata, O., Murakami, M., Koima, S. and Seo, Y. (2016). A portable infrared photoplethysmograph: heartbeat of Mytilus galloprovincialis analyzed by MRI and application to Bathymodiolus septemdierum.Biol. Open5, 1752-1757.
Soto, M. and Cajaraville, M. P.(1966). Tissue and cell distribution of copper, zinc and cadmium in the mussel, Mytilus galloprovincialis, determined by autometallography.Tisseu Cell28, 557-568.
Thomsen, J., Himmerkus, N., Holland, N., Sartoris, F. J., Bleich, M. and Tresguerres, M.(2016). Ammonia excretion in mytilid mussels is facilitated by ciliary beating.J. Exp. Biol.219, 2300-2310.
Yang, H., Wang, T., Li, J., Gu, L. and Zheng, X.(2006). Decreasing expression of a1Ccalcium L-type channel subunit mRNA in rat ventricular myocytes upon manganese exposure.J. Biochem. Mol. Toxcol.20, 159-166.