Munich Personal RePEc Archive
Income distribution, turnover speed and
profit rate in Japan, Chile, Netherlands
and United States
Maito, Esteban Ezequiel
March 2014
Online at
https://mpra.ub.uni-muenchen.de/59283/
Income distribution, turnover speed
and profit rate in Japan, Chile,
Netherlands and United States.
Esteban Ezequiel Maito
ABSTRACT
This paper analyzes the valorization process in Chile, Japan, Netherlands and
United States, estimating advanced constant and variable capital, turnover speed,
capital composition and profit rate on total advanced capital. Furthermore, it
analyzes the role of turnover speed in the valorization process. In core countries,
turnover speed of capital tends to be higher due to a larger development of
productive forces. Thus, in Netherlands, United States and Japan there is higher
labor share, representing at the same time, the wage bill adjusted by capital
turnover, a lower proportion related to total capital and income, compared to
peripheral countries like Chile.
KEYWORDS: profit rate
–
labor share
–
turnover speed
–
capital composition
Introduction
This article aims not only to estimate the profitability levels, in Marxian terms, for Chile, Japan, Netherlands and the United States, but also to introduce the capital turnover speed influence on profitability and income distribution.
The few records in this regard are related to, among others, difficulties for collecting statistical data to estimate turnover speed, in addition to the marginal role that profitability and, to a lesser extent, the distribution of income have in hegemonic economic schools. Despite there are many studies on both profitability1 and distribution2, there are few cases in which the turnover of capital is introduced on the estimates3. In this sense, this is the first comparative study on the subject.
Once estimated turnover speed, we then have a rough idea of the profit rate in relation to estimates, despite useful for understanding the evolution of profitability, which just consider profits on fixed capital or profits on total capital assuming constant rotation. These tend to overestimate or underestimate the actual levels. Similarly, throughout the work we will observe the impact of turnover speed on other categories such as value composition of capital.
In Marxian terms, the rate of profit arises from the ratio of profits and capital advanced in machinery and infrastructure (fixed constant capital, FCC), in inputs (circulating constant capital, CCC) and wages (variable capital, VC).
Annual inputs consumed and wages should be divided by the annual number of turnovers (N). Capitalist advances circulating capital, inputs and wages, but it gets recovered, not within a year, but when commodities containing such capital are sold. So that, if the capitalist bought a ton of steel on January and on March sold it transformed into tubes, by April he has already recovered the amount paid by the steel on January. On April´s production, he only needs to reinvest the circulating capital advanced on January. Circulating capital embodied on final product is recovered by the capitalist after each production process, once the goods are sold, to be newly released to production and valorized. Since the labor force transforms inputs representing circulating constant capital, we suppose variable capital turnover is similar.
As developed above, "intermediate consumption" (or intermediate inputs ) –IC- and " wages" (or wage bill) –W- from national accounts cannot be used as equivalents of constant and variable circulating capital, without acknowledge of turnover speed.
RoP = P = P . FCC + IC + W FCC + CCC + VC. N N
1
Duménil & Lévy (2002, 2005), Iñigo Carrera (2007), Maito (2013a), Mariña Flores & Moseley (2001), Marquetti et al (2010), Reati (1986,1989).
2
Guerriero (2012), Lindenboim et al (2011). 3
If we use the intermediate consumption and wages as equivalent, which actually represent consumed circulating capital, but not advanced capital, we would be assuming that circulating capital performs only one annual turnover.
In countries where capital does not produce the generality of commodities, usually known as peripherals, the production of commodities embodying ground rent (agricultural or mining) is a central axis in accumulation, capital turnover tends to be lower than in countries with the general capacity to produce a wider range of commodities, since the time for production and circulation, expression of the relative development of productive forces, themselves are lower. Particularly in agricultural countries, primary production requires a time strongly regulated by the natural cycles of crop growth. In mining countries, it doesn´t seem to exist this limitation, but there is probably a pressure on turnover due to the exhaustion of the quarries and the increasing difficulty to extract from current mines and wells, which ultimately extend the turnover time, mainly the time of production.
Capital turnover speed in core countries will not be reduced by the greater relative growth of services activities in relation to manufacturing industries that has occurred in recent decades. Instead, there is a match in services between commodity production and consumption. Thus the turnover speed of circulating capital in these activities is probably higher. However, the latter may not apply equally to services in peripheral countries, where this sector has a significant heterogeneity and is, ultimately, less governed by fully developed capitalist relations.
Wages, of course, influence the appropriation of value generated, and therefore the mass of profit which forms the numerator, for the simple reason of being the reproduction value of labor force, and profits, the value exceeding that one. But the influence of the wage bill in the production is further determined by the turnover speed of the circulating variable capital in this case. Assuming a constant 50-50 distribution in the long-term between capital and labor, from the perspective of the production process, if turnover arises from 1 to 5, capitalists firstly would obtain 50 advancing 50, but later would get the same 50 just advancing 10, given the five annual turnovers at that point. That said, facing a higher turnover speed, which positively affects the annual rate of surplus value (P/VC) and the value capital composition (CC/VC or VCC) due to increased spending on fixed capital, real wages have, as cost, necessarily diminishing effects on profit rate determination.
Finally, this paper does not consider the distinction between productive and unproductive workers. Some authors consider that the wages of unproductive workers for capital, which are necessary for production of capitalist but do not generate value, are financed with surplus value from productive workers4. This surplus value would become unproductive worker´s wages. The rate of surplus value in these terms would be greater, since the real amount of variable capital would be exclusively represented by the wages of productive workers, and the surplus value would be represented by both capitalist profits as wages of unproductive workers of capitalist enterprises. Thus, here we consider at a more concrete level the behavior of profitability, being the wages of unproductive workers a cost to the
4
capitalist whose amount, moreover, does not enter the numerator of the rate of surplus value, and it does in the denominator.
The rate of profit in Chile, Japan, Netherlands and the United States
The rate of profit shows a downward trend in the four countries until the early eighties, and then a recovery of varying intensity. In the Japanese case, however, the rate continued to exhibit a marked decrease. From the fifties to the early seventies the rate of profit is higher in Japan, where the expansion of capitalist production has been wider.
However, after the general crisis of the seventies and early eighties, the rate in Japan experienced no partial rise, as usual in most of the countries, including the remaining three of this paper. On the contrary, Japan rate carried on a constant downward pace, thus reversing the yield differentials prevailing in the fifties and the sixties. The low levels since the nineties have held this economy immersed in economic stagnation with very low growth rates5.
In the Chilean case the downward cycle its lowest trough in 1975. Until that year, the rate shows significant similarity to the Japanese. After a brief interregnum of profitability recovering, it was relocated to a minimum in the early eighties and particularly in 1985. Thereafter the rate of profit entered sustained period of recovery until 1995. The downward cycle in subsequent years will be violently interrupted since 2003, by the growth of international copper prices, on what capital profit rate in Chile relies heavily in last decades6.
Chile, as peripheral country, has a higher rate of profit. Similar consideration can be done in the Japanese case during the initial period of our series, which could hardly be characterized as a core country. Thus there would be a dynamic in which capital expands
5
The Japanese economist Okishio held in 1961 that capitalists only modernize production if the investment will allow them to increase their profitability. These arguments were widely discussed and became a direct disclaim of the discoveries of Marx on the performance and trends of the capitalist economy. During the seventies, however, Okishio would review some of his own arguments. The behavior of the rate of profit in Japan until 1961 (a context of growing profitability) expresses the context in which Okishio developed his theory with its main arguments, and the subsequent period, the mistaken of his arguments in such irrefutable way. By 1975 the Japanese rate of profit was reduced to half its 1961´s level, the constant capital per employee was increased from 18.058 to 80.653 2012 dollars, whit profits rising only 5.471 to 12.571 (see statistical annex). Japanese capitalists themselves refuted those arguments, which on the other hand has been uncritically accepted as true by a significant number of economists, who generally tend to consider, just as Ricardo, that is the behavior of wages the main factor of declining profitability. However, the largest relative growth of fixed capital by competition, in cases such as United States (Freeman; 2009), Brazil (Marquetti et al:2010) or Argentina (Maito:2013a) has proved to be the main explanatory variable in the downward trend of the rate of profit. In short, the modernization of production is not a matter of choice but a necessity for any capital.
6
in less developed countries that would present higher rates of profit, in some similar way of the movement between branches.
The Netherlands has, in principle, lower levels of profitability and, especially compared to Chile, fluctuations are more focused. Always maintained in the range of 10% -15 %, until 1980 the trend was downward, while in later years a small recovery was observed in relation to the trough in the seventies. However, the decline of the profit rate in Japan was such that, during the nineties, became the country with the lowest rate of this four.
In the United States the behavior of the rate were remarkably similar, also the concrete levels, to Netherlands, also expressed in their similarities as core countries7 .
Figure no.1 compares profitability for the cases where turnover of circulating capital is computed and where not. Naturally, it´s lower in the latter. While it does not affect the sense of the trend, softens its slope, especially for the Japanese case, in which the rate of profit is almost double if we consider the rotation. Noteworthy is the remarkable leveling of the rate of profit during the most critical years of the period 1974-1982 (1974-1976, 1982-1985).
Source: see annexes.
Figure No. 2 shows the overall tendency of the four countries, considering the simple profit rates average, standard deviation and the weighted rate of profit, which arises from the sum, in a common currency (current dollars), of the four countries profits, divided by the sum of the capital advanced in all of them . The weight of the United States and Japan will obviously be very important.
7
[image:6.612.87.515.331.528.2]As this paper aims to set an international comparison, in the U.S. case estimates have been realized on total profits and reproductive fixed capital. Commonly, data is taken only for the corporate sector. 0% 5% 10% 15% 20% 25% 30% 35% 195 5 195 8 196 1 196 4 196 7 197 0 197 3 197 6 197 9 198 2 198 5 198 8 199 1 199 4 199 7 200 0 200 3 200 6 200 9
Figure 1a - Rate of profit adjusted by turnover
Japan Chile Neth. US
0% 5% 10% 15% 20% 25% 30% 35% 195 5 195 8 196 1 196 4 196 7 197 0 197 3 197 6 197 9 198 2 198 5 198 8 199 1 199 4 199 7 200 0 200 3 200 6 200 9
Figure 1b - Rate of profit, one annual turnover
Source: see annexes.
The weighted rate is the most related to Marx´s perspective, as it expresses the return on total capital (here reduced to four countries). In terms of this work, during the cycle of partial recovery of profitability since 1982, the normal rate of return to capital would have remained in the range of 12%-14% until the crisis in 2008, the year in which profitability levels come close to those prevailing in 1974-1982.
The average rate has a stronger tendency to decline than the weighted, largely due to a fall in domestic yield spreads, of which the standard deviation is an index. The expansion of capital accumulation during the postwar period in countries like Japan and Chile, with higher rates of profit, has been declining, by its own action in these domestic spaces, these differentials. Expression of the latter is the collapse of the average rate and standard deviation during the seventies and early eighties, as well as the inability to recover the previous levels. The partial recovery of profitability since the mid-eighties was higher in Chile than in the United States and the Netherlands, keeping the Japanese rate a continuous decline. The level of this average rate was during those years between 13%-16%, while in the sixties it was in a range of 19%-21%.
The turnover of capital
Capital, in its movement as expanding value, transits different phases, adopting three different shapes (money, commodity, productive):
M - C ... P ... C' - M'
As initial money-capital (M) in circulation is transformed (by exchange) into commodity-capital (M, means of production and labor power) that are productively consumed in the production process (P). This represents a necessary interruption of capital circuit and its
[image:7.612.86.515.70.298.2]0% 1% 2% 3% 4% 5% 6% 7% 8% 9% 10% 8% 10% 12% 14% 16% 18% 20% 22% 196 4 196 6 196 8 197 0 197 2 197 4 197 6 197 8 198 0 198 2 198 4 198 6 198 8 199 0 199 2 199 4 199 6 199 8 200 0 200 2 200 4 200 6 200 8
Figure N°2 - Rate of profit in the four countries. Mean, weighted and standard deviation (1964-2008).
transformation on productive-capital. Through the exploitation of the labor force, a surplus is generated. The labor force, unlike the means of production and inputs, has the power to generate an additional value that required to its own reproduction. Thus, the production process itself (P) in which the labor force, using the means of production, transforms inputs is realized, resulting in a mass of commodities of a greater value than the prior (M ') that capitalist released back into circulation. In the final product appears transferred the constant capital employee, plus an additional amount generated by labor force, equal to variable capital (reproduction value of labor force) exchanged with the capitalist, and a surplus-value. The capital is thus transmuting from money-capital to commodity-capital, then productive-capital, to finally return to the form of commodity-capital and money-capital of a greater value. This last step is the one that involves the sale on the market (C'-M'), the realization of the profit and the completion of the valorization process. Under this new form (M´), capital is able to restart the process on a larger scale.
The capital turnover thus represents the time it takes to capital to throughout the whole cycle. The reduction of production times (M ... P ... M ') and circulation (D - M , M' -D) will lower the time it takes to complete this circuit, thus increasing the speed and number of turnovers per year. The development of the productive forces and the production scale has a strong correlation with the growth rate of turnover speed, which in part may be affected too by cyclical and conjunctural conditions. A higher turnover implies that the capitalist may recover advanced circulating capital in less time and can eventually assign more capital to machinery or circulating capital itself, expanding its own volume of production (if some capital rotate in half of the time than other of equal magnitude, it can get its productive shape using a double amount of inputs and labor)8. Lower turnover represents a relative higher level of capital assigned to inputs and labor force until its recovery
8
through sale. The capital composition, technical and value compositions, tends to be lower in relation to capital with higher turnover9.
In this paper, capital turnover was estimated by dividing the total costs of the economy (intermediate consumption, wages and consumption of fixed capital) by total stock of inventories, according to Fichtenbaum (1988). The fundamental idea of this procedure is that the number of annual turnovers emerges from the number of times the total stock of inventories is expressed in the flow of total costs of the economy.
Source: see annexes.
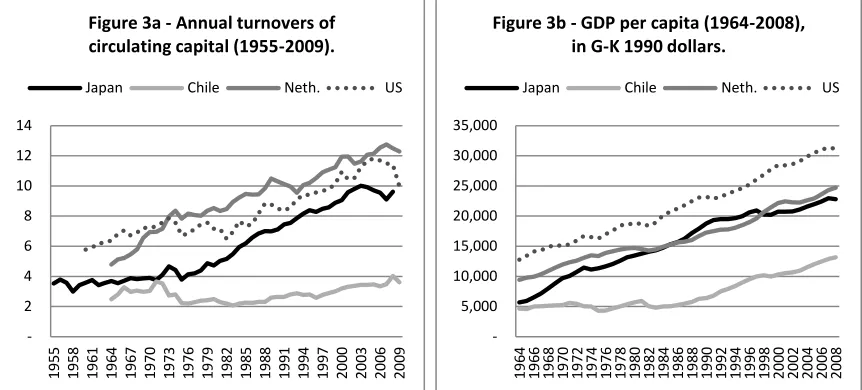
Turnover is higher in Netherlands, which trend over the period appears roughly linear. Similar consideration can be made in the American case, although the speed is further increased during the nineties. In Japan there is also an upward trend in turnover, but less linear: from the second half of the seventies it grows much more markedly. This distinctive feature has been more or less highlighted from other perspectives as a successful management on reducing inventories by Japanese "toyotism". In all four cases, the overall profitability crisis of the seventies is expressed in a stagnation or decline in the turnover speed. Particularly in the years 1973-1975 coinciding with the fall of profit rates observed. Specifically between 1970 and 1975, the rate of profit falls at average annual rates of 10.2% in Japan, 10.9% in Chile, 3.3% in the U.S. and 4.5% in Netherlands. The general crisis of capital in Chile, from the first half of the seventies to mid-eighties, was expressed in a pronounced decline and stagnation in turnover. The shift of capital from predominant industries in the postwar period to sectors, in addition to mining, more resource-based may have had, in this sense, a similar effect, although this flow of capital has been based on a greater relative profitability of these sectors.
9
The organic composition of capital is expressed both in the volume of constant capital advanced per worker (technical composition) and the relationship between constant capital and variable capital (value composition), increasing both as the productive force of social labor is developed.
[image:9.612.87.518.195.390.2]2 4 6 8 10 12 14 195 5 195 8 196 1 196 4 196 7 197 0 197 3 197 6 197 9 198 2 198 5 198 8 199 1 199 4 199 7 200 0 200 3 200 6 200 9
Figure 3a - Annual turnovers of circulating capital (1955-2009).
Japan Chile Neth. US
5,000 10,000 15,000 20,000 25,000 30,000 35,000 196 4 196 6 196 8 197 0 197 2 197 4 197 6 197 8 198 0 198 2 198 4 198 6 198 8 199 0 199 2 199 4 199 6 199 8 200 0 200 2 200 4 200 6 200 8
Figure 3b - GDP per capita (1964-2008), in G-K 1990 dollars.
The rate of surplus value and the value composition of capital
The rate of surplus value is defined by Marx in Volume I of Capital as the ratio of the surplus labor time and labor time necessary for the reproduction of the labor force. In this sense, the conventional distribution of income expresses the rate of surplus value or exploitation, as the ratio of the appropriated value by the capitalists and the value of the labor force (profits/wage bill).
In Volume II, Marx undertakes the analysis of the turnover of capital, while in Volume III, which deals, as its subtitle makes explicit, with the process of capitalist production as a whole, considering the influence of turnover on profitability. Marx finally differentiates two rates of surplus value. A ratio between profits and wages (or variable capital consumed), defined as the simple rate of surplus value. Moreover, the annual rate of surplus value is defined as the ratio between profits and the variable capital advanced. This definition thus includes the turnover of capital determining the rate of surplus value10.
The simple rate of surplus value is equal to the rate of surplus value for each turnover of capital, but, due to it makes several annual turnovers, in the successive annual circuits the value of labor force does not represent additional money-capital for capitalist. In distributional terms exemplified above, the simple rate of surplus value, which coincides with the conventional perspectives, is 100 % (50/50). The annual rate is, thereby, 500% (50/10) if capital performs five rotations. In each cycle the ratio is equal to the simple rate of surplus value of 100 % (10/10), but as in the subsequent four rotations capitalist just re-launches the same capital advanced and recovered, for these rotations it does not represent any additional capital advanced, obtaining anyway a profit of 10 from each circuit (10/0).
The simple rate of surplus value (SRSV) then expresses the relation between two flows of value created by the labor force, those destined to its own reproduction (W) and those appropriated by capitalist (P). The annual rate of surplus value (ARSV), expresses the relation between the variable capital advanced (VC), value faced by capitalist to put in action the workforce, and the value appropriated by the capitalist (P)11. In terms of the latter, regardless of the other conditions, is the annual rate of surplus value which represents real interest12. By contrast, and understanding the nature of the process of
10
Note that in this paper we consider just net profits in the rate of surplus value. Given the growth, in recent decades, in the share of the net taxes and consumption of fixed capital, a “gross” rate of surplus value would be higher. Anyway, the long-term increase in consumption of fixed capital share is a distributive expression of the growth of mechanization related to labor force and value added, according to the capitalist economic logic explained above on competition, mechanization and profitability in the long run.
11
It should be noted that, strictly speaking, capitalist doesn´t advance the variable capital to workers, but these are who advance to the capitalist their labor power in first place. However, this does not affect the fact that the capitalist must have a sufficient amount of capital to pay wages and supplies during the period in which it makes its own circuit.
12
capitalist production as a social and continuous process, the simple rate of surplus value for a year, as we see expressed in the statistics of conventional distribution between capital and labor, is the result of certain annual rate of surplus value, but considering national accounts just annual flows, national accountability simply multiplies the variable capital advanced by the number of turnovers (obviously not dealing with any of these categories).
SRSV = P = P = ARSV ARSV = P = P = SRSV . W VC*N N VC W/N N
Conventional explanations on higher wage shares in the core countries, which does not consider the turnover of capital, logically leads to the conclusion that this wage share, and the larger organization of the labor movement, is what explains the lower levels of profitability, squeezing profits. However, the rate of surplus value itself is generally higher in these countries when we introduce the turnover13.
Source: see annexes.
So that, is in core countries where profits are, for capitalists, looser regarding their variable capital advanced related to GDP or fixed capital. Since squeezing thesis sustain that higher labor costs explain the decrease in profitability, we need to consider the labor cost, not as the annual flow of wages (as indeed affirm such theories), but as actually the variable capital advanced, i.e., as the true cost faced by capitalists for the productive consumption of labor force14. And as we shall see later, this cost is not only systematically
play an indispensable role in the valorization social process and the distribution of surplus value among different capitals (Volume III).
13
Martínez González & Valle Baeza (2011) explicitly analyze the differential rates of surplus value between peripheral and core countries, considering the rate of surplus value without rotation. From this course is to conclude that "the rate of surplus value in developing countries is higher than in developed countries, contrary to what might be assumed according to the theory." This would be correct only if we consider the simple rate of surplus value.
14
For a critique of “profit squeeze” hypothesis, see Weeks (1979).
[image:11.612.93.493.168.199.2]0% 100% 200% 300% 400% 500% 600% 700% 195 5 195 8 196 1 196 4 196 7 197 0 197 3 197 6 197 9 198 2 198 5 198 8 199 1 199 4 199 7 200 0 200 3 200 6 200 9
Figure 4a - Annual rate of surplus value.
Japan Chile Neth. US
0% 20% 40% 60% 80% 100% 120% 140% 160% 195 5 195 8 196 1 196 4 196 7 197 0 197 3 197 6 197 9 198 2 198 5 198 8 199 1 199 4 199 7 200 0 200 3 200 6 200 9
Figure 4b - Simple rate of surplus value.
[image:11.612.88.515.302.500.2]lower in core countries, it presents a downward trend in the United States and Netherlands in the sixties and early seventies, when profits squeeze would have gestated and wage income shares have grown. As outlined below, in the case of core countries, this increased rate of surplus value is offset by a higher proportion between constant and variable capital, higher capital composition, which ultimately results in lower levels of profitability compared to peripherals.
In the postwar decades appears to exist in the rates of surplus value similar differentials regarding to the rates of profit (Figure No.1). Most leveling in the rate of surplus value is given in this case mainly in the mid-seventies. Since the eighties a change is then observed: differentials in rates of surplus for Chile and Japan that tended to predominate were reversed, especially in the nineties15.
Source: see annexes.
In Marx terms, capitalists tend to invest relatively more in constant capital. Forced by competition of other capitals, increased productivity or productive force eventually allows them to sell at a lower value than its competitors and reach wider market share, or at least maintain the value of their commodities at levels socially accepted to continue operating as capital in functions.
The reduced value of commodities also has the potential effect of reducing the value of the labor force. This growth of constant capital relative to variable capital, being the labor force
15
Although are issues beyond the scope of this paper, it´s worth noting the relevance of a more detailed analysis on certain variables. For example, the Chilean rate of surplus value, since the seventies, maintains a level related to the Japanese, except for three periods in which it grows faster. In two of these, this is related to the payment of the labor force below its value in the context of acute crises that operated a general devaluation of the Chilean capital, and all the variables of the production process. Thus, the higher rate of surplus value, which in the short term was reflected in a rise in the rate of profit, comes at the expense of not only the payment of the labor force below its value, but a reduced scale of Chilean capital. So that, these growths end up affecting the aggregate or world profitability in a lesser extent, and come at the expense of a substantial reduction in systemic terms of the Chilean mass of profit due to the crisis (see details in annex).
[image:12.612.88.517.253.447.2]5 10 15 20 25 30 35 40 45 50 195 5 195 8 196 1 196 4 196 7 197 0 197 3 197 6 197 9 198 2 198 5 198 8 199 1 199 4 199 7 200 0 200 3 200 6 200 9
Figure 5a - Value composition of capital, adjusted by turnover.
Japan Chile Neth. US
2 4 6 8 10 12 195 5 195 8 196 1 196 4 196 7 197 0 197 3 197 6 197 9 198 2 198 5 198 8 199 1 199 4 199 7 200 0 200 3 200 6 200 9
Figure 5b - Value composition of capital, one annual turnover.
the only source of surplus value, is what ultimately explains the downward trend in the rate of profit, even despite increases in the rate of surplus value.
As in previous cases, the turnover of capital again modifies the picture offered by the course of one annual rotation. The value composition of capital is higher in core countries. Since in the U.S. and Dutch case the rate of surplus describes a similar trend to the value composition, profit rates remain relatively stable. In the Japanese case, the rate of surplus has failed to support the growth of the composition, and therefore profitability trend has remained downward in recent decades. In Chile the composition is generally lower, largely due to lower turnover affecting the variable capital advanced, maintaining a large gap in performance compared to the other three countries.
The rate of profit as the ratio of the rate of surplus value and the value
composition of capital
The equation of the rate of profit can be expressed in different ways. The traditional way is the ratio of profits and total capital advanced. Another way of expressing the rate is calculated, dividing all terms by the variable capital, as the ratio of the rate of surplus value and the value composition of capital.
PR= P = ARSV . FCC + CCC + VC (VCC +1) .
Thus, profitability levels and their performance depend on the annual rate of surplus value and the value composition of capital. The relative growth of constant capital, composition, affects negatively capitalist profitability, while increasing annual rate of surplus value has a positive effect. The rate of profit thus emerges as a synthesis of these two influences. Marx didn´t notice any contradiction between a higher rate of surplus value and a lower rate of profit but rather the contrary. A higher rate of surplus value often go hand in hand with a higher composition of capital, and is the largest growth of the latter, by increasing competition among capitalists that modernize production, which ultimately explains the downward trend in the rate of profit :
“This mode of production produces a progressive relative decrease of the variable capital as
compared to the constant capital, and consequently a continuously rising organic composition of the total capital. The immediate result of this is that the rate of surplus-value, at the same, or even a rising, degree of labour exploitation, is represented by a continually falling general rate of profit. The progressive tendency of the general rate of profit to fail is, therefore, just an expression peculiar to the capitalist mode of production of the progressive development of the social productivity of
labour”16
.
16
In aggregate terms of the four countries we consider here the situation described above is presented by Marx. The growth rate of surplus value is less than the growth in the composition of capital, generating lower levels of profitability.
Source: see annexes.
[image:14.612.86.514.124.355.2]The highest relative growth rate of surplus value comes after the 1982 crisis, during which it produced most of the recovery of the profit rate and reaches its maximum level of recovery, whether we take the simple mean or the weighted rate of profit for these countries.
Table N°1 – Annual rate of surplus value, value composition of capital adjusted by turnover and rate of profit, five year average variation rate.
Japan Chile Netherlands US
ARSV VCC RoP ARSV VCC RoP ARSV VCC RoP ARSV VCC RoP 1965-2009 0,5% 2,0% -1,5% 1,1% 1,2% 0,2% 1,9% 2,0% -0,2% 1,0% 1,3% -0,3%
1965-1982 -0,8% 2,3% -3,2% -1,7% 0,7% -1,8% 1,9% 2,8% -0,9% -1,2% 1,0% -2,1% 1983-2009 1,0% 3,2% -2,1% 2,9% 1,6% 1,5% 1,9% 1,5% 0,2% 2,5% 1,5% 1,0%
1965-1969 1,5% 0,2% 1,2% 0,8% 0,2% 0,8% 4,7% 4,2% 0,5% -0,6% 1,7% -2,3% 1970-1974 -5,6% 4,7% -10,1% -0,7% 6,0% -6,6% 2,8% 4,5% -1,6% -0,8% 3,8% -4,4% 1975-1979 0,9% 1,9% -1,3% 2,7% -4,0% 7,5% -4,0% 0,4% -4,6% 0,8% -0,4% 1,3% 1980-1984 2,4% 3,5% -1,1% -2,5% 2,6% -4,3% 10,3% 2,8% 7,3% 3,3% 0,1% 2,9% 1985-1989 4,6% 3,7% 0,9% 9,1% 2,5% 7,4% 1,8% 2,3% -0,7% 3,0% 1,4% 1,4% 1990-1994 -2,1% 3,5% -5,4% -4,0% -3,0% -1,0% -1,4% -0,9% -0,7% 1,8% 0,7% 1,1% 1995-1999 -0,3% 2,5% -2,7% -4,1% 1,0% -4,9% 2,3% 2,3% 0,0% 2,9% 0,7% 2,1% 2000-2004 4,0% 3,5% 0,6% 7,8% 3,5% 4,4% 1,0% 2,0% -1,0% 2,9% 3,4% -0,5% 2005-2009 -4,2% 1,4% -5,2% 0,5% 2,6% -1,5% -0,4% 0,7% -1,2% -3,9% 0,0% -3,9%
Source: see annexes.
25 50 75 100 125 150 175 200 225
196
4
196
6
196
8
197
0
197
2
197
4
197
6
197
8
198
0
198
2
198
4
198
6
198
8
199
0
199
2
199
4
199
6
199
8
200
0
200
2
200
4
200
6
200
[image:14.612.85.521.460.682.2]8
Figure 6 - Aggregate rate of profit, annual rate of surplus value and value composition of capital (1964-1966=100).
For the entire 1964-2009 period (see Table 1) in the four countries there is an increased growth of the composition with respect to the rate of surplus value, although certain sub-cycles or periods latter may have a higher relative growth and thus generate a profit growth.
One aspect that highlights the global nature of the current crisis is that in the period 2005-2009 all countries showed a decrease in the rate of profit. The last five years in which this situation occurred was 1970-1974.
Income distribution and its relation with the production process
The level of wage share in GDP emerges as the percentage of wages on total production. The calculation is based on estimates of the wage bill, expressed in its simplest form as multiplying the average annual nominal wage by the number of employees. Or in Marxian terms, the variable capital consumed per employee multiplied by the number of employees. Additionally the nominal GDP (real GDP x GDP prices) must be introduced in the denominator. Thus, a smaller or larger relative increase in one component affects income participation.
Distribution is the final expression of what firstly occurs in the sphere of production, which determines the primary and functional distribution of income. In production, wages are expression of the variable capital advanced by the capitalist, but this capital is not necessarily equal to variable capital consumed or wage bill. This equalization, that thereby assumes a single annual turnover, either by ideological-economic conception, either for lack of data or estimates for turnover speed, it does not affect participation levels but, in order to explain the latter as a result of capitalist production, turnover speed must be introduced.
Introducing the turnover of capital as a characteristic and real aspect of capitalist production, other determination of wage shares could be obtained. The calculation of wage bill no longer arises exclusively from multiplying the annual salary by the number of employees, but the advanced variable capital per worker multiplied by the number of employees and turnovers:
W = average annual wage x employees = average VC x N x employees . GDP GDP GDP
It´s the further development of capital and productive forces, which naturally requires or generates, by its own scale, higher levels of training or organization, what operates a greater relative reduction of labor costs (higher annual surplus rate and turnover speed) from the perspective of the capitalist production process.
generally reaches the working class in either set of countries. Both interpretations assume that greater wage shares emerge, ultimately, from higher labor costs to the capital of certain country, either by production requirements or trade-union strength, reducing the share of profits in income. The capitalists in core countries would obtain a lower relative surplus per wage paid.
But if we take all elements of capitalist production, then a different picture emerges. More annual turnovers of circulating capital, which obviously includes the variable capital advanced, in developed countries completely reverses appearances arising from conventional income distribution. Relative labor costs, also expressed as a percentage of income, are significantly lower in these countries. The higher wage shares are formed from relatively lower costs, related to GDP or fixed capital, and more annual turnovers. Thus, the core countries, both the VC/GDP and VC/FCC ratios are generally lower than in the peripheral one. Particularly in the Chilean case, where the brutal social adjustment carried out by the Pinochet not only could not reverse the crisis of profitability but did not achieved substantially, until the crisis in 1982, to reduce real capitalists labor costs (variable capital) in the context of a collapse of economic activity and turnover speed17.
Source: see annexes.
In short, there is another way of expressing the share of profits and wages in income that goes one step further and consider the annual rate of surplus value. And given that wage bill is a function of annual rate of surplus value and variable capital, income distribution can be expressed directly as a result of the number of turnovers and the annual rate of surplus value, canceling variable capital in all three terms of the equation.
W = W = VC*N = N . GDP W+P (VC*N)+(VC*ARSV) N+ARSV
17
A similar conclusion about the failure of the dictatorship in Argentina to restore previous levels of profitability despite a brutal social setting can be found in Maito (2013a).
[image:16.612.86.516.326.523.2]0% 5% 10% 15% 20% 25% 195 5 195 8 196 1 196 4 196 7 197 0 197 3 197 6 197 9 198 2 198 5 198 8 199 1 199 4 199 7 200 0 200 3 200 6 200 9
Figure 7a - Variable capital advanced, as percentage of GDP.
Japan Chile Neth. US
20% 25% 30% 35% 40% 45% 50% 55% 60% 65% 195 5 195 8 196 1 196 4 196 7 197 0 197 3 197 6 197 9 198 2 198 5 198 8 199 1 199 4 199 7 200 0 200 3 200 6 200 9
Figure 7b - Wage share on GDP at market prices.
Now the distribution appears as an expression of the valorization process and a function of the annual rate of surplus value and capital turnover. This is not a way among many to present data relating to distribution, but to express fully the determinants of real capitalist production. Thus, a distribution may appear seemingly constant while internal components may have changed18. And this being the case changed in what sense? A fall in the cost of labor (VC), understood not as equivalent to a certain amount of consumption goods, but as the actual cost to the capitalists for its productive consumption. The variable capital advanced, as a percentage of GDP, has a clear downward trend and a growing gap with wage share, with increasing turnover speed and gross annual rate of surplus. The actual labor cost faced by capitalists in the core countries represented by 2008 only between 4% and 5.4 % of GDP, while on, the other hand, the wage bill or variable capital consumed was between 49.6% and 56.5 %. In Chile, while peripheral country with less development of the productive forces, the wage share is lower and, simultaneously, labor costs for capitalists higher, the latter understood as the cost for productive consumption of labor force, not as a basket of consumer goods in particular. Consolidation of high wage share in the Japanese case matches, despite any appearance, with a sustained decrease in labor cost for capitalists, that has been reduced by almost two-thirds since the peak reached in 1975.
Source: see annexes.
Figure N°8 presents, for the Japanese case, the income distribution for the period 1955-2008, considering some issues attended in this paper (the trends in the other three countries are similar). Due to a long-term increase of fixed capital related to living labor, consumption of fixed capital (CFK) will tend to extend its share on GDP. Thereby, capitalist
18
Economists have written rivers of ink about this apparent and constant distribution (known as Bowley´s Law) not only disclaiming the turnover issue but also misleading their own considerations about the main determination of the profit rate. In this sense, Neoclassical, Keynesians, Post-Keynesians, and many Marxists share similar considerations.
0% 10% 20% 30% 40% 50% 60% 70% 80% 90% 100%
[image:17.612.88.512.342.568.2]1955 1959 1963 1967 1971 1975 1979 1983 1987 1991 1995 1999 2003 2007
Figure 8 - Japan shares in GDP at market prices (1955-2008).
doesn´t get rewarded for these investment efforts, in the context of capitalist competition and constant mechanization, and the net profits (P) share presents a falling participation. Regarding wage share, considering the nature of capitalist production developed above (mainly in the rate of surplus value section), the conventional wage bill from national accounts can be decomposed in variable capital (VC) and a turnover effect (VC x N-1) as representing advanced variable capital restarting its circuit (not representing, despite profit squeeze theories, real additional capital or labor costs for capitalists).
Conclusions
The average and weighted rates of profit present a general downward trend over the period 1964-2009. This period could be divided into two stages. The first, which in fact began in the fifties, is marked by a sharp decline in profitability that is common to all four countries. After the 1982 crisis, except in the case of Japan, there is a partial recovery that seems, however, annulled by the 2008 crisis. The rate of surplus value failed to support the growth of the value composition.
The deeper decrease in the average rate differentials expresses a more pronounced drop in the rate of profit in peripheral countries, as exemplified not only Chile and Japan (in the previous step to become a core country) but in rate of profit estimates for other countries like Brazil, Korea, Argentina and Mexico19. Within this context is that can be interpreted many characterizations in the context of globalization that refers to increasing competition between peripheral countries to provide better regulatory conditions to the world's most advanced capitals .
The introduction of the turnover speed in the estimates of some categories considerably alters conventional views, not only with regarding to the rate of profit, the surplus value rate and composition, but also the way in which certain income shares conform within a capitalist economy.
19
STATISTICAL ANNEX: Constant Capital (CC), Variable Capital (VC), Profits (P) and Annual Wage (W) per Employee in 2012 U$$. Annual Turnovers (N), Unemployment Rate (d), Profit Rate (PR), Annual Rate of Surplus Value (ARSV) and Value Capital Composition (VCC).
Japan
CC VC P W N d (%) PR ARSV VCC
1955 15.221 1.048 3.625 3.697 3,5 2,5 22,3% 345,9% 14,5 1956 15.518 1.014 3.551 3.829 3,8 2,3 21,5% 350,4% 15,3 1957 15.204 1.091 3.820 3.900 3,6 1,9 23,4% 350,2% 13,9 1958 14.798 1.355 3.524 4.059 3,0 2,1 21,8% 260,1% 10,9 1959 14.945 1.259 3.859 4.314 3,4 2,2 23,8% 306,5% 11,9 1960 15.871 1.310 4.702 4.689 3,6 1,7 27,4% 359,0% 12,1 1961 18.058 1.399 5.471 5.250 3,8 1,4 28,1% 391,1% 12,9 1962 19.489 1.724 5.456 5.908 3,4 1,3 25,7% 316,4% 11,3 1963 21.049 1.857 5.977 6.620 3,6 1,3 26,1% 321,8% 11,3 1964 22.930 2.001 6.531 7.375 3,7 1,1 26,2% 326,4% 11,5 1965 23.856 2.289 6.518 8.105 3,5 1,2 24,9% 284,7% 10,4 1966 25.469 2.367 7.160 8.762 3,7 1,3 25,7% 302,5% 10,8 1967 28.073 2.459 8.309 9.525 3,9 1,3 27,2% 337,9% 11,4 1968 30.393 2.725 9.313 10.388 3,8 1,2 28,1% 341,7% 11,2
1993 217.469 8.391 26.406 66.005 7,9 2,5 11,7% 314,7% 25,9 1994 233.948 8.719 26.745 71.252 8,2 2,9 11,0% 306,7% 26,8 1995 250.813 9.167 27.375 76.820 8,4 3,2 10,5% 298,6% 27,4 1996 216.359 7.893 23.703 65.338 8,3 3,4 10,6% 300,3% 27,4 1997 195.752 6.871 20.782 58.309 8,5 3,4 10,3% 302,5% 28,5 1998 178.681 6.152 17.168 52.809 8,6 4,1 9,3% 279,1% 29,0 1999 202.328 6.643 19.973 59.023 8,9 4,7 9,6% 300,7% 30,5 2000 209.439 6.747 20.734 61.073 9,1 4,7 9,6% 307,3% 31,0 2001 179.513 5.473 16.380 52.454 9,6 5,0 8,9% 299,3% 32,8 2002 170.369 5.017 16.462 49.152 9,8 5,4 9,4% 328,1% 34,0 2003 180.802 5.119 17.801 51.264 10,0 5,3 9,6% 347,7% 35,3 2004 193.378 5.320 19.430 52.772 9,9 4,7 9,8% 365,2% 36,3 2005 187.408 5.169 19.056 50.192 9,7 4,4 9,9% 368,6% 36,3 2006 173.901 4.847 16.280 46.318 9,6 4,1 9,1% 335,9% 35,9 2007 169.234 4.806 16.644 43.783 9,1 3,9 9,6% 346,3% 35,2 2008 196.089 5.108 15.600 49.126 9,6 4,0 7,8% 305,4% 38,4
Chile
CC VC P W N d (%) PR ARSV VCC
1964 29.518 2.962 9.053 7.347 2,5 27,9% 305,6% 10,0 1965 30.833 2.795 8.547 7.827 2,8 25,4% 305,8% 11,0 1966 31.466 2.637 9.228 8.622 3,3 27,1% 350,0% 11,9 1967 29.585 2.675 8.602 7.971 3,0 26,7% 321,6% 11,1 1968 27.981 2.653 8.223 8.092 3,1 26,8% 309,9% 10,5
1987 26.890 1.980 5.952 4.575 2,3 10,9% 20,6% 300,5% 13,6 1988 27.968 2.099 7.114 4.848 2,3 9,7% 23,7% 339,0% 13,3 1989 27.674 2.074 7.325 5.372 2,6 7,9% 24,6% 353,2% 13,3 1990 29.088 2.218 7.109 5.856 2,6 7,8% 22,7% 320,5% 13,1 1991 29.871 2.473 7.770 6.530 2,6 8,2% 24,0% 314,2% 12,1 1992 32.244 2.713 8.412 7.596 2,8 6,7% 24,1% 310,1% 11,9 1993 31.924 2.688 7.719 7.715 2,9 6,6% 22,3% 287,2% 11,9 1994 35.795 3.167 9.067 8.742 2,8 7,8% 23,3% 286,3% 11,3 1995 39.951 3.707 11.489 10.343 2,8 7,3% 26,3% 309,9% 10,8 1996 43.848 4.266 13.565 11.006 2,6 6,3% 21,8% 245,6% 10,3 1997 46.123 4.285 14.175 11.869 2,8 6,1% 21,9% 257,7% 10,8 1998 44.809 4.040 12.371 11.717 2,9 6,4% 19,7% 237,9% 11,1 1999 45.397 3.833 11.262 11.498 3,0 10,1% 17,5% 225,0% 11,8 2000 42.967 3.437 11.350 10.998 3,2 9,7% 19,2% 259,7% 12,5 2001 39.763 2.947 9.607 9.756 3,3 9,9% 18,2% 263,3% 13,5 2002 38.591 2.766 9.101 9.322 3,4 9,8% 17,8% 266,6% 14,0 2003 39.695 2.754 9.617 9.474 3,4 9,5% 18,4% 283,2% 14,4 2004 44.819 3.156 12.441 10.824 3,4 10,0% 21,4% 325,6% 14,2 2005 50.497 3.491 14.999 12.078 3,5 9,2% 23,5% 363,1% 14,5 2006 54.670 3.825 18.342 12.775 3,3 7,8% 27,4% 418,4% 14,3 2007 58.399 3.919 19.223 13.679 3,5 7,1% 27,1% 430,9% 14,9 2008 63.164 3.679 16.129 14.788 4,0 7,8% 20,9% 379,2% 17,2 2009 64.586 4.016 14.806 14.498 3,6 9,7% 18,9% 322,0% 16,1
Netherlands
CC VC P ¨W N d (%) PR ARSV VCC
1964 4,8 14,0% 265,4% 18,0
1965 5,1 13,7% 271,6% 18,8
1966 5,2 12,4% 247,2% 19,0
1967 5,5 12,7% 262,6% 19,7
1968 5,8 12,6% 280,1% 21,2
1980 210.015 7.133 22.310 60.843 8,5 3,8% 10,3% 312,8% 29,4 1981 162.981 5.457 18.486 45.489 8,3 6,0% 11,0% 338,7% 29,9 1982 139.361 4.678 16.053 39.615 8,5 8,4% 11,1% 343,2% 29,8 1983 125.244 3.995 15.643 35.734 8,9 10,2% 12,1% 391,5% 31,3 1984 107.305 3.292 15.548 30.411 9,2 10,2% 14,1% 472,3% 32,6 1985 99.566 3.067 14.639 29.044 9,5 9,1% 14,3% 477,2% 32,5 1986 127.844 4.044 18.137 38.077 9,4 8,6% 13,8% 448,5% 31,6 1987 150.116 4.692 19.000 44.302 9,4 8,5% 12,3% 404,9% 32,0 1988 151.038 4.473 19.480 43.992 9,8 8,4% 12,5% 435,5% 33,8 1989 138.060 3.780 19.080 39.623 10,5 7,6% 13,5% 504,7% 36,5 1990 157.002 4.424 21.287 45.584 10,3 6,9% 13,2% 481,2% 35,5 1991 151.636 4.401 20.291 44.536 10,1 6,5% 13,0% 461,1% 34,5 1992 162.439 4.803 20.595 47.877 10,0 6,5% 12,3% 428,7% 33,8 1993 150.487 4.586 18.114 43.828 9,6 7,5% 11,7% 395,0% 32,8 1994 153.445 4.414 20.380 44.427 10,1 8,5% 12,9% 461,7% 34,8 1995 170.631 4.787 22.919 48.818 10,2 8,1% 13,1% 478,8% 35,6 1996 165.961 4.474 22.532 47.107 10,5 7,5% 13,2% 503,6% 37,1 1997 145.856 3.815 20.782 41.581 10,9 6,6% 13,9% 544,7% 38,2 1998 145.624 3.801 20.098 42.135 11,1 5,1% 13,5% 528,7% 38,3 1999 142.650 3.655 18.826 41.058 11,2 4,3% 12,9% 515,1% 39,0 2000 126.460 3.052 17.174 36.421 11,9 3,8% 13,3% 562,8% 41,4 2001 125.895 3.026 16.604 36.188 12,0 3,5% 12,9% 548,8% 41,6 2002 141.828 3.417 17.451 39.234 11,5 4,1% 12,0% 510,7% 41,5 2003 173.377 4.091 20.773 47.538 11,6 5,4% 11,7% 507,8% 42,4 2004 187.609 4.354 23.351 52.520 12,1 6,5% 12,2% 536,3% 43,1 2005 187.399 4.240 25.138 51.467 12,1 6,5% 13,1% 592,9% 44,2 2006 184.194 4.100 25.931 51.455 12,5 5,5% 13,8% 632,4% 44,9 2007 201.186 4.411 28.719 56.210 12,7 4,5% 14,0% 651,1% 45,6 2008 221.883 4.882 30.386 60.976 12,5 3,8% 13,4% 622,5% 45,5 2009 212.857 4.764 24.425 58.552 12,3 4,8% 11,2% 512,7% 44,7
United States
CC VC P W N d(%) PR ARSV VCC
METHODOLOGICAL ANNEX:
Chile:
Fixed Constant Capital: Official series of reproductive capital stock from Banco Central de Chile (1985-2010) – www.bcentral.cl -. For previous years, capital stock from Souza & Feu, investment prices from Braun et al, and reproductive construction participation from Aguilar & Collinao. The resulting series were linked with the official.
Circulating Constant Capital: Intermediate consumption series from Banco Central de Chile since 1986. For previous years Marcel data for 1975-1984, extrapolated to previous years taking intermediate consumption ratio to GDP.
Variable Capital: Wage bill series from CEPAL 1964-2009.
Inventories Stock: Estimates from Handl & Fuentes for 1960-1984 and official stats of inventories variations.
Profits: Net profits available on CEPALSTAT 1964-2009. Employees: Series from Banco Central de Chile.
Japan:
Fixed Constant Capital: Official series of reproductive capital stock from Statistics Bureau of Japan. Circulating Constant Capital: Intermediate consumption series from Statistics Bureau of Japan. Variable Capital: Wage bill series from Statistics Bureau of Japan.
Inventories Stock: Series from Statistics Bureau of Japan. Profits: Net profits from Statistics Bureau of Japan. Employees: Series from Statistics Bureau of Japan.
Netherlands:
Fixed Constant Capital: Estimated using perpetual inventory method with investment series of Groote et al (1996) and OECD and prices from Central Bureau voor de Statistiek (CBS).
Circulating Constant Capital: Intermediate consumption series from EUKLEMS 1970-2009, extrapolated to previous years taking intermediate consumption ratio to GDP.
Variable Capital: Wage bill series from CBS.
Inventories Stock: Estimated from Taminiau-van Veen et al (2009) and official stats of inventories variations.
Profits: Net profits from CBS.
Employees: Series from CBS, since 1969.
Estados Unidos:
Fixed Constant Capital: Official series of reproductive capital stock Bureau of Economic Analysis (BEA).
Circulating Constant Capital: Intermediate consumption series from EUKLEMS 1970-2009, extrapolated to previous years taking intermediate consumption ratio to GDP.
Variable Capital: Wage bill series from BEA. Inventories Stock: Series from BEA.
Profits: Net profits from BEA.
Employees: Series from Bureau of Labor Statistics (BLS).
References
- Aguilar, Ximena & Collinao, María Paz (2001) Cálculo del stock de capital para Chile
1985-2000, DT N°133, Santiago de Chile: Banco Central de Chile.
- Alemi, Piruz & Duncan Foley (1997) The circuit of capital, US manufacturing and
- Braun, Juan, et al.(2000) Economía chilena 1810-1995. Estadísticas históricas, DT N°187
del Instituto de Economía, Santiago de Chile: Universidad Católica de Chile.
- Dachevsky, Germán & Juan Kornblihtt (2011) Aproximación a los problemas metodológicos
de la medición de la tasa de ganancia y la renta de la tierra petrolera, Documento de Jóvenes Investigadores N°27, Instituto Gino Germani-UBA, Argentina.
- Duménil, Gerard & Levy, Dominique (2002) The profit rate. Where and how much did it fall.
USA 1948-2000, http://www.jourdan.ens.fr/levy/.
- Duménil, Gerard & Levy, Dominique (2005) From prosperity to neoliberalism. Europe
before and after the structural crisis of the 1970´s, http://www.jourdan.ens.fr/levy/.
- Fichtenbaum, Rudy (1988) Business cycles, turnover and the rate of profit: an empirical test
of Marxian crisis theory, Eastern Economic Journal Vol.XIII N°3, Estados Unidos.
- Freeman, Alan (2009) What makes the US profit rate fall?, MPRA Paper N°14147,
http://mpra.ub.uni-muenchen.de/14147/ .
- Grinberg, Nicolás (2011) Transformations in the Korean and Brazilian processes of
capitalist development between the mid-1950s and the mid-2000s: the political economy of late industrialisation.PhD thesis, The London School of Economics and Political Science (LSE).
- Groote., Peter et al. (1996) A standardized time series of the stock of fixed capital in the
Netherlands, 1900-1995, Groningen Growth & Development Center Working Paper N°25, Universidad de Groningen, Países Bajos.
- Guerriero, Marta (2012) The labour share of income around the world. Evidence from a
panel dataset, Development Economics and Public Policy Working Papers (WP32/2012), University of Manchester, Inglaterra.
- Haindl, Erik & Fuentes, Rodrigo (1986) Estimación del stock de capital en Chile
1960-1984”, Revista Estudios de Economía Vol.13 N°1, Universidad de Chile, Chile.
- Iñigo Carrera, Juan (2007) La formación económica de la sociedad Argentina, Imago
Mundi, Argentina.
- Jones, Peter (2012) Depreciation, devaluation and the rate of profit, Universidad de París,
Francia.
- Kaldor, Nicholas (1973) Teorías alternativas acerca de la distribución, en “Teoría del capital
y la distribución”, Editorial Tiempo Contemporáneo, Argentina.
- Lindenboim, Javier, Damián Kennedy & Juan Graña (2011) Distribución funcional y
demanda agregada en Argentina. Sesenta años en perspectiva internacional, CEPED-UBA DT N°16, Argentina.
- Maito, Esteban Ezequiel (2013a) La Argentina y la tendencia descendente de la tasa de
ganancia 1910-2011, Revista Realidad Económica N°275, Argentina
- Maito, Esteban Ezequiel (2013b) La tasa de ganancia en Chile 1986-2009, Revista Razón
y Revolución N°24, Ediciones RyR, Argentina.
- Mariña Flores, Abelardo & Moseley, Fred (2001) La tasa general de ganancia y sus
determinantes en México 1950-1999, Revista Economía, Teoría y Práctica N°15, México.
- Marquetti, Adalmir et al. (2010) The profit rate in Brazil 1953-2003, Review of Radical
Political Economics Vol.42 N°4, SAGE Publications, Estados Unidos.
- Marx, Karl (1968a) El Capital. Tomo I, FCE, México. - Marx, Karl (1968b) El Capital. Tomo II, FCE, México. - Marx, Karl (1968c) El Capital. Tomo III, FCE, México.
- Moseley, Fred & Roberts, Charles (1989) The Decline of the Rate of Profit in the Postwar US Economy: Regulation and Marxian Explanations, International Journal of Political Economy Vol.19N°1, M.E.Sharpe Inc., Estados Unidos
- Martínez González, Gloria & Alejandro Valle Baeza (2011) Differences in surplus-value
rates between developed and under-developed countries: An analysis based on differences in productivity and capital composition, Marxism 21 Vol.8 N°1, Corea.
- Reati, Angelo (1986) The rate of profit and the organic composition of capital in the post
- Reati, Angelo (1989) The rate of profit and the organic composition of capital in the post
1945 long wave. The case of French manufacturing industry from 1959 to 1981, International Journal of Political Economy Vol.19 N°1, Estados Unidos.
- Robinson, Joan (1973) Reconsideraciones de la teoría del valor, en “Teoría del capital y la
distribución”, Editorial Tiempo Contemporáneo, Argentina.
- Souza, Marcos & Aumara Feu (2005) Capital stock in Latin America: 1950-2000, Economy
& Energy N°50, Brasil.
- Taminiau-van Veen, Puck; Schaaf, Sandra & van den Bergen, Dirk (2009) Measuring
inventories in the Dutch national accounts, CBS Discussion Paper 09019, Países Bajos.
- Weeks, John (1979) The process of accumulation and the “profit-squeeze” hypothesis,