ISSN Online: 1945-3108 ISSN Print: 1945-3094
Effect of Tides on the Stratigraphic Resistance
of the South Coast of the Laizhou Bay
Qiao Su
1,2*, Xingyong Xu
1,2, Wenquan Liu
1,2, Guangquan Chen
1,2, Tengfei Fu
1,21Key Laboratory of Marine Sedimentology and Environmental Geology, First Institute of Oceanography, State Oceanic
Administration, Qingdao, China
2Laboratory for Marine Geology, Qingdao National Laboratory for Marine Science and Technology, Qingdao, China
Abstract
Seawater intrusion is a global environmental problem that is becoming in-creasingly severe with the overexploitation of underground freshwater in coastal regions and sea-level rise caused by global climate change. Although a series of achievements has been made on seawater intrusion, the role of tidal effects has not been fully revealed. In this paper, a typical case of tidal effects on seawater intrusion is provided. The high-density resistivity method was applied to the high-frequency continuous measurement of the stratigraphic resistance of the south coast of the Laizhou Bay, followed by the panel data analysis method. The results indicate that the formation resistivity in coastal area was affected by the tidal level significantly, particularly in the seawater intrusion channel. The effect of tide on the intensity distribution of formation resistivity was evaluated using this method. Because of the presence of a brine layer in the section, the trends of the tidal level effect on the formation resis-tivity in the left and right sides of the section were opposite, and the intensity of the effect increased sideways.
Keywords
Seawater Intrusion, Tidal, the High-Density Resistivity Method, Panel Data
1. Introduction
On a global scale, the economy in coastal regions is booming; therefore, the wa-ter consumption is increasing. The overexploitation of groundwawa-ter in these areas is common. A hydraulic connection exists between the groundwater and seawater; therefore, the balance between the groundwater and seawater in coast-al regions would be destroyed because of naturcoast-al factors and overexploitation [1]. The seawater will shift to the landward direction along the aquifer influx, How to cite this paper: Su, Q., Xu, X.Y.,
Liu, W.Q., Chen, G.Q. and Fu, T.F. (2017) Effect of Tides on the Stratigraphic Resis-tance of the South Coast of the Laizhou Bay. Journal of Water Resource and Protection, 9, 590-600.
https://doi.org/10.4236/jwarp.2017.96039
Received: March 5, 2017 Accepted: May 13, 2017 Published: May 16, 2017
Copyright © 2017 by authors and Scientific Research Publishing Inc. This work is licensed under the Creative Commons Attribution International License (CC BY 4.0).
and the freshwater resources would be destroyed. The seawater intrusion is widespread in coastal regions globally, particularly in the dryland and semidryl-and areas. So far, seawater intrusion has been found in dozens of countries semidryl-and regions such as America, Australia, Lebanon, Israel, Japan, and Egypt [2].
With increasing exploitation of fresh groundwater resources and sea-level rise due to the global climate change, seawater intrusion has become increasingly se-vere. Studies on seawater intrusion have been carried out since the late 19th Century. However, most of the studies are based on the assumption of a static sea level, without considering the effect of tidal waves [2].
In fact, tidal fluctuation is an important driving force for the groundwater flow in coastal areas. Several studies on the effect of tidal fluctuations on ground- water have been conducted since the 1950s [3]. However, the aquifer was as-sumed to be homogeneous in most of these studies. By studying the variable- density groundwater model, Ataie-Ashtiani et al. believed that tidal fluctuations increased seawater intrusion, thus increasing the thickness of brackish water in-terface and changing its structure completely [4]. Since then, many scholars have reached the same conclusion as Ataie-Ashtiani’s. They also believed that the ef-fect of tidal action on brackish water interface is small, and the geomorphology and stratigraphic features of sea beach are also important factors in affecting the coastal groundwater [5] [6] [7] [8]. However, all the studies were based on ma-thematical analysis and numerical simulations. Moreover, strict constraints were set for the theoretical models, or the tidal fluctuations and stratigraphic condi-tions were processed in simplified ways.
Seawater intrusion has been investigated using hydrographic survey, envi-ronmental isotopes, and geophysical methods [2]. Many studies analyzed the re-lationship between groundwater and tidal effects from the observed groundwa-ter level and conductivity data, and the same conclusions were drawn as those of the numerical analysis [9] [10] [11]. Environmental isotope is a sensitive para-meter for seawater intrusion [12] [13]; however, the environmental isotope me-thod needs higher investment and involves technical complexity. The hydro-graphic survey method requires installing hydrological monitoring wells and preferably specialized drilling. Compared to the other two methods, the geo-physical method is more convenient and economical. Swartz first applied the re-sistivity method for studying the interface of Hawaii brackish seawater intrusion, and this method was used by many other researchers later [14] [15] [16]. The in-itial one-dimensional (1D) measurement was developed to two-dimensional (2D) and three-dimensional (3D) measurements gradually [17]. Day-Lewis et al.
and Henderson et al. believed that tidal fluctuation affected the resolution and depth range of resistivity tomography [18] [19]. Poulsen et al. and Franco et al.
In this study, a case of seawater intrusion in the southern coastal plain of Laizhou Bay, Shandong, China was investigated. The mechanism of seawater in-trusion, numerical analysis of underground water, structure of brine, and pre-vention of seawater intrusion in this region were mainly studied [21]. The effect of tidal fluctuation on seawater intrusion has not been reported. The high-den- sity resistivity method was applied to the high-frequency continuous measure-ment of formation resistivity, followed by the panel data analysis method, which is commonly used in economics. This method was also introduced to study the effect of tidal fluctuation on seawater intrusion in this region. The purpose of the paper is to find a more convenient and economical method about the effect of tides on the seawater intrusion.
2. Geological Settings
[image:3.595.210.536.337.720.2]The south bank of the Laizhou Bay coastal area (Figure 1) has a warm temperate continental monsoon climate. It has the characteristics of maritime climate be-cause of its location near the sea. Rainfall infiltration is the main groundwater replenishment in this area. The Weibei Plain, which is a typical silty coast in
China, was formed by the alluviation of the rivers in the mountainous region in the central part of Shandong province. The terrain in this area is flat and slightly inclined to the north, with an altitude of 2 - 7 m. Alluvial and proluvial plains are present in the south and north, respectively. The quaternary sediments are mainly piedmont alluvial and coastal sediments, with an aggregate thickness of 500 m. Since the late Pleistocene epoch, the area was long in the process of set-tlement activities. Zhang et al. divided the marine and continental strata in the late Pleistocene and Holocene epochs, identified three times seawater intrusion, and found that the multilevel underground brine was formed during seawater intrusion and regression [22]. The underground brine mostly occurred in the loose sediments in the stratum of the Quaternary marine, which is mainly com-posed of silt, mingling with fine sand, muddy silt, coarse sand, and silty clay. The aquifer is formed with silt, fine sand, and clay silt. In the range of the Sha River in Laizhou and the Xiaoqing River in Shouguang, the area of subsurface brine is 1500 km2, with a general mineralization degree of 50 - 150 g/L (the highest mi-neralization degree is up to 217 g/L). The general burial depth is 0 - 60 m, and the value reaches to 70 - 80 m in some area. There are 3 - 4 brine layers includ-ing divinclud-ing underground brine and confined underground brine areas [23]. The diving underground brine occurred in the sandy silt soil in the Holocene marine layer, with an embedded depth of 0 - 15 m. The diving underground brine is at-tached to the seawater, and the mineralization degree is relatively low [24].
The Changyi marine special reserve is located in the north of Changyi City, Shandong Province, with a total area of 29.29 km2. The wetland ecological sys-tem including tamarix chinensis and marine organisms are protected in this area. Compared to the other regions in the south bank of Laizhou Bay, the pri-mitive natural environment in the Changyi marine special reserve are preserved relatively completely because the effect of human activities is relatively small. Considering that the effect of tidal wave on coastal groundwater is very weak, the effect of human activity was excluded in the earlier study. Human activity will be taken into account in the follow-up study.
3. Equipment and Field Methods
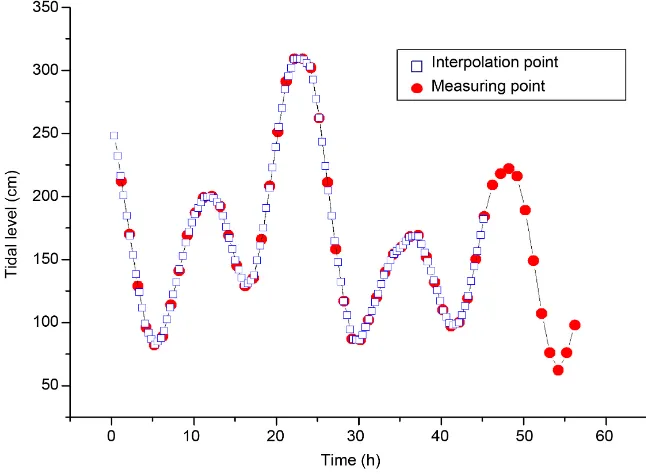
The tidal data were obtained from the tidal level information provided by the Weifang City Marine Environment Monitoring Station. The data were measured one time per hour. An interpolation method was applied to match the tidal data with those of the high-density resistivity method [25] (Figure 2).
4. Methodology
The term “panel data” refers to the multivariate time series data, which were ob-tained by observing the sectional individual in different times continuously. The time series and cross-section data can be used simultaneously during the para-meter analysis of the model. This technique is usually applied to the analysis of economic data [26] [27] [28]. Compared to the cross-section and time series da-ta, panel data have many advantages. They provide a large number of data points for researchers, increase the freedom of data, and reduce the explanatory va-riables of linear degree, thus improving the effectiveness of measurement model estimation. With the improvement of the panel data theory, it has been used to study environmental problems [29] [30]. In this case, the formation resistivity data, which were measured by the high-density resistivity method, were com-bined with the panel data. The measurement points, which were selected from the section data, can be viewed as 170 cross sections, and 119 measurements can be regarded as the time series data. Therefore, the panel data theory was used to analyze the data.
[image:5.595.209.532.481.718.2]The main purpose of this case is to investigate the effect of tide on the forma-tion resistivity in different posiforma-tions. First, the panel data model was selected. Both the section and time were included in the panel data, and the linear data equation, which is often used to analyze the effects of quantitative and qualita-tive factors, can be expressed as follows [31]:
*
, 1, 2, , ; 1, 2, ,
it it it it it
y =α +β′x +u i= N t= T (1)
where yit is the dependent variable; xit is the k-vector of regression coefficients;
it
α∗ and
it
β ′ are the 1 × 1 and 1 × K exogenous variable vectors, which are changed with i and t; i is the cross-section dimension, N is the total number of cross sections; t is the time series dimension; T is the total number of times; uitis the random disturbance term, which is independent of each other and also satis-fies zero mean and heteroscedasticity.
Equation (1) is only used in the description of some cases theoretically. It nei-ther can be estimated nor can be used to predict. Therefore, before the deduc-tion, a structural constraint should be added to the model. First, we assumed that the parameters do not vary with time, but with the individual variation. Therefore, the regression equations for each of the individual components can be defined as follows:
*
, 1, 2, , ; 1, 2, ,
it i i it it
y =α +β′x +u i= N t= T (2)
There are three types of constraint condition for Equation (2) as follows: 1) The regression slope coefficient is the same; however, the intercept is dif-ferent, namely, individual-mean corrected regression equation:
*
it i it it
y =α +β′x +u (3)
2) The regression intercept is the same; however, the slope coefficient is dif-ferent, namely, unrestricted equation:
*
it i it it
y =α +β′x +u (4)
3) Both the regression slope coefficient and intercept are the same, namely, pooled regression equation:
*
it it it
y =α +β′x +u (5)
In this case, the formation resistivity may be obtained by the panel model re-gression of the observed value of the tidal level. According to the previous study, the effect of tidal fluctuation on the groundwater at different positions varies, leading to different effects on the formation resistivity; the main performance is that the coefficient changes with the cross section. When each of the measuring point of the formation resistivity was treated as a cross section, the 119 mea-surements were treated as a time series, and the constraint condition (b) was se-lected. The expectation equation can be expressed as follows:
i i i
r = +α α +βt (6)
where, ri is the formation resistivity for measuring point i; α is a constant; αiis the intercept for measuring point i; βi is the slope coefficient for measuring point i; and t is the tide level for measuring point i at some point.
the calculation results as follows:
i i
i
r x
r x −
′ = (7)
where riis the value calculated by Equation (6) for measuring point i, and xi is the measured value for the same point.
5. Results and Discussion
A variable coefficient model was applied, and the coefficients in model (6) were calculated using the soft of Eveiws 6.0. The model test results are shown in Table 1. The R-squared of the model reaches 0.998794, indicating that the fitness of the model is significant. Because the data applied in this case did not meet the re-quirements of the panel data totally, Equation (7) was utilized to verify the cal-culation results. In Equation (6), for each measurement data point, because α
and αi were both constants, the effect of tidal change on formation resistivity was only associated to β. If the tidal level changes one unit, the formation resistivity changes β units. Therefore, β was regarded as the influencing strength of tidal change on formation resistivity.
Using the panel data calculation, the β value of each point was obtained, as shown in Figure 3(a). Along the direction of seawater intrusion, the value of β
[image:7.595.207.537.596.733.2]first changed from a negative value to zero and then to a positive value gradually. The value first decreased and then increased. According to Equation (7), statis-tical analysis was carried out on the error of the results, and the average error is shown in Figure 3(b). When the electrode spacing was <10 m, the error of the panel data calculation was smaller. This indicates that the tidal level mainly af-fects the surface formation resistivity, instead of deeper formation resistivity. If the error rate is <15% in accordance with the criteria, the distribution of β is shown in Figure 3(c), whose overall trend was consistent with the results shown in Figure 3(a). Supposing the data points, whose errors were >15%, would not affect the formation resistivity, the β value of such points can be regarded as ze-ro. Then, the distribution is shown in Figure 3(d), which was consistent with that shown in Figure 3(b). When the error was high, the effect strength was al-most zero.
Table 1. Effects specification of the model.
Cross-section fixed (dummy variables)
R-squared 0.998794 Mean dependent var 41.86404
Adjusted R-squared 0.998773 S.D. dependent var 63.46484
S.E. of regression 2.223014 Akaike info criterion 4.452269
Sum squared resid 156111.1 Schwarz criterion 4.593068
Log likelihood −70985.69 Hannan-Quinn criter. 4.497299
F-statistic 48525.09 Durbin-Watson stat 0.275435
Figure 3. Effect strength of tide on the formation resistivity and calculation error distribution.
6. Conclusion
In this study, the high-density resistivity method was applied to measure the formation resistivity, and the results were analyzed by the panel data method. Up to date, the results indicate that 1) the formation resistivity in coastal area was affected by the tidal level significantly, particularly in the seawater intrusion channel, indicating that it is possible to analyze the tide effect on the groundwa-ter in coastal area by formation resistivity; 2) because of the presence of a brine layer in the south bank of Laizhou Bay, the effects of the tidal level on the forma-tion resistivity in the left and right sides of the secforma-tion were opposite. On the right side of the profile, the tidal level has a negative correlation with the forma-tion resistivity, and the effect strength decreases along the direcforma-tion of seawater intrusion. On the left side of the profile, the tidal level has a positive correlation with the formation resistivity, and the effect increases along the direction of seawater intrusion. The effect strength of tidal fluctuation on formation resistiv-ity varied between 0.132 and 0.29.
Acknowledgements
This research was supported by National Natural Science Foundation of China (41406072), “State Oceanic Research Project for Public Benefit” (201105020).
References
[1] Paniconi, C., Khlaifi, I., Lecca, G., Giacomelli, A. and Tarhouni, J. (2001) Modeling and Analysis of Seawater Intrusion in the Coastal Aquifer of Eastern Cap-Bon, Tu-nisia. Transport in Porous Media, 43, 3-28.
https://doi.org/10.1023/A:1010600921912
[2] Werner, A.D., Bakker, M., Post, V.E.A., Vandenbohede, A., Lu, C., Ataie-Ashtiani, B., et al. (2013) Seawater Intrusion Processes, Investigation and Management: Re-cent Advances and Future Challenges. Advances in Water Resources, 51, 3-26. [3] Guo, H., Jiao, J.J. and Li, H. (2010) Groundwater Response to Tidal Fluctuation in a
Two-Zone Aquifer. Journal of Hydrology, 381, 364-371.
[4] Ataie-Ashtiani, B., Volker, R.E. and Lockington, D.A. (1999) Tidal Effects on Sea Water Intrusion in Unconfined Aquifers. Journal of Hydrology, 216, 17-31. [5] Li, L., Barry, D.A., Stagnitti, F., Parlange, J. and Jeng, D. (2000) Beach Water Table
Fluctuations Due to Spring-Neap Tides: Moving Boundary Effects. Advances in Water Resources, 23, 817-824.
[6] Nielsen, P. (1990) Tidal Dynamics of the Water Table in Beaches. Water Resources Research, 26, 2127-2134. https://doi.org/10.1029/wr026i009p02127
[7] Li, H., Boufadel, M.C. and Weaver, J.W. (2008) Tide-Induced Seawater-Ground- water Circulation in Shallow Beach Aquifers. Journal of Hydrology, 352, 211-224. [8] Carey, H., Lenkopane, M.K., Werner, A.D., Li, L. and Lockington, D.A. (2009) Tidal
Controls on Coastal Groundwater Conditions: Field Investigation of a Macrotidal System. Australian Journal of Earth Sciences, 56, 1165-1179.
https://doi.org/10.1080/08120090903246246
[10] Park, H., Jang, K., Ju, J.W. and Yeo, I.W. (2012) Hydrogeological Characterization of Seawater Intrusion in Tidally-Forced Coastal Fractured Bedrock Aquifer. Journal of Hydrology, 446, 77-89.
[11] Kim, K., Seong, H., Kim, T., Park, K., Woo, N., Park, Y., et al. (2006) Tidal Effects on Variations of Fresh-Saltwater Interface and Groundwater Flow in a Multilayered Coastal Aquifer on a Volcanic Island (Jeju Island, Korea). Journal of Hydrology, 330, 525-542.
[12] Kim, Y., Lee, K., Koh, D., Lee, D., Lee, S., Park, W., et al. (2003) Hydrogeochemical and Isotopic Evidence of Groundwater Salinization in a Coastal Aquifer: A Case Study in Jeju Volcanic Island, Korea. Journal of Hydrology, 270, 282-294.
[13] Hiroshiro, Y., Jinno, K. and Berndtsson, R. (2010) Hydrogeochemical Properties of a Salinity-Affected Coastal Aquifer in Western Japan. Hydrological Processes, 20, 1425-1435. https://doi.org/10.1002/hyp.6099
[14] Swartz, J.H. (1937) Resistivity-Studies of Some Salt-Water Boundaries in the Ha-waiian Islands. Transactions, American Geophysical Union, 18, 387-393.
https://doi.org/10.1029/TR018i002p00387
[15] Fretwell, J.D. and Stewart, M.T. (1981) Resistivity Study of a Coastal Karst Terrain, Florida. Groundwater, 19, 156-162.
https://doi.org/10.1111/j.1745-6584.1981.tb03454.x
[16] Franco, R.D., Biella, G., Tosi, L., Teatini, P., Lozej, A., Chiozzotto, B., et al. (2009) Monitoring the Saltwater Intrusion by Time Lapse Electrical Resistivity Tomogra-phy: The Chioggia Test Site (Venice Lagoon, Italy). Journal of Applied Geophysics, 69, 117-130.
[17] Dahlin, T. (2001) The Development of DC Resistivity Imaging Techniques. Compu- ters & Geosciences, 27, 1019-1029.
[18] Day-Lewis, F.D., White, E.A., Johnson, C.D., Lane, J.W. and Belaval, M. (2012) Continuous Resistivity Profiling to Delineate Submarine Groundwater Discharge— Examples and Limitations. Leading Edge, 25, 724-728.
https://doi.org/10.1190/1.2210056
[19] Ayala, J.E., Streeper, R.S., Desgrosellier, J.S., Durham, S.K., Suwanichkul, A., Svitek, C.A., et al. (2010) Marine Electrical Resistivity Imaging of Submarine Groundwater Discharge: Sensitivity Analysis and Application in Waquoit Bay, Massachusetts, USA. Hydrogeology Journal, 18, 173-185.
https://doi.org/10.1007/s10040-009-0498-z
[20] Poulsen, S.E., Rasmussen, K.R., Christensen, N.B. and Christensen, S. (2010) Eva-luating the Salinity Distribution of a Shallow Coastal Aquifer by Vertical Multielec-trode Profiling (Denmark). Hydrogeology Journal, 18, 161-171.
https://doi.org/10.1007/s10040-009-0503-6
[21] Han, D., Kohfahl, C., Song, X., Xiao, G. and Yang, J. (2011) Geochemical and Isoto- pic Evidence for Palaeo-Seawater Intrusion into the South Coast Aquifer of Laizhou Bay, China. Applied Geochemistry, 26, 863-883.
[22] Zhang, Z., Nie, X. and Liu, E. (2005) The Accumulation Records of Environmental Evolution on the Salt-Water Intruded Area South of Laizhou Bay Since Late Pleisto- cene. Geographical Research, 24, 105-111. (In Chinese)
[23] Han, Y., Meng, G. and Wang, S. (1996) Quaternary Underground Brine in the Coastal Areas of the Northern China. Science Press, Beijing. (In Chinese)
[25] Mundlak, Y. (1978) On the Pooling of Time Series and Cross Section Data. Econo-metrica,46, 69-85.
[26] Haripriya, G.S. and Parikh, J.K. (1998) Socioeconomic Development and Demand for Timber Products: A Panel Data Analysis. Global Environmental Change,8, 249- 262.
[27] Yang, S. and Martinez-Zarzoso, I. (2014) A Panel Data Analysis of Trade Creation and Trade Diversion Effects: The Case of ASEAN-China Free Trade Area. China Economic Review,29, 138-151.
[28] Marín, E., Pérezamaral, T., Rúa, A. and Hernández, E. (2001) The Evolution of the pH in Europe (1986-1997) Using Panel Data. Chemosphere,45, 329-337.
[29] Narayan, P.K. and Narayan, S. (2010) Carbon Dioxide Emissions and Economic Growth: Panel Data Evidence from Developing Countries. Energy Policy,38, 661- 666.
[30] Aşıcı, A.A. (2013) Economic Growth and Its Impact on Environment: A Panel Data Analysis. Ecological Indicators,24, 324-333.
[31] Cheng, H. (2003) Analysis of Panel Data. Cambridge University Press, Cambridge.
Submit or recommend next manuscript to SCIRP and we will provide best service for you:
Accepting pre-submission inquiries through Email, Facebook, LinkedIn, Twitter, etc. A wide selection of journals (inclusive of 9 subjects, more than 200 journals)
Providing 24-hour high-quality service User-friendly online submission system Fair and swift peer-review system
Efficient typesetting and proofreading procedure
Display of the result of downloads and visits, as well as the number of cited articles Maximum dissemination of your research work