A Pilot Clinical Trial on L-Carnitine Supplementation in
Combination with Motivation Training: Effects on Weight
Management in Healthy Volunteers
Satoshi Odo1, Koji Tanabe1, Masamitsu Yamauchi2
1Lonza Japan Ltd., Tokyo, Japan; 2Department of Home Economics, Registered Dietitians Section, Aichi Gakusen University, Oka-zaki, Japan.
Email: Satoshi.odo@lonza.com
Received December 4th, 2012; revised January 9th, 2013; accepted January 16th, 2013
ABSTRACT
A 4-week low dosage (500 mg/day) L-carnitine supplementation in combination with motivation training was carried out in 24 overweight (BMI 25.8 - 26.6 kg/m2) Japanese males in the course of a double-blind randomized pla-
cebo-controlled study. L-carnitine motivated group showed significant body weight loss and a decrement of serum triglyceride level vs. the non-motivated placebo group. Serum adiponectin levels increased in both L-carnitine supple- mented groups. The beneficial effects of L-carnitine were amplified by motivation training. For clinical evaluation of supplements, whose efficacy is potentially affected by inter-individual life style variability, supportive motivation training might be advisable for future clinical trials.
Keywords: L-Carnitine; Weight Management; Motivation Training; CarnipureTM
1. Introduction
Prevalence of obesity among adults in Japan was 3.9% in 2009, compared to nearly 34% for the United States [1]. However, according to national health and nutrition sur- vey in Japan in 2007, prevalence of obesity is increasing in males regardless of age group compared with the sta- tistics of 1986 and 1996. Additionally, among the 40 - 74 years old, one in two men and one in five women were strongly suspected to have either metabolic syndrome or prodromal metabolic syndrome [2].
Drugs approved for long-term management of obesity are very few [3,4] they have limited long-term effective- ness, and they have also significant side effects such as hypertension and insomnia for sibutramine [5] and diar- rhea and flatulence for orlistat [6,7]. On the other hand, long term administration of L-carnitine for fighting of obesity is considered safe [8] in comparison to the pre- viously mentioned medications.
L-carnitine (L-3-hydroxy-4-N-trimethylaminobutyrate) was discovered more than 100 years ago [9,10]. More and more new research is conducted on L-carnitine [11, 12]. Among many other functions, L-carnitine is crucial for beta-oxidation, facilitating the transport of long- chain fatty acids across the mitochondrial membrane [13,14], as well as moving the waste products such as
poorly metabolizable acyl groups from mitochondria to the cytoplasm [15]. Recent research shows that L-car- nitine possesses antioxidant capacity and protects plasma components against oxidative damage [16,17].
For long time, L-carnitine has been marketed as a die- tary supplement to improve body composition and in- crease athletic performance [11]. Wutzke and Lorenz have shown that L-carnitine supplementation led to a significant increase in 13C-fat oxidation, whereas protein
synthesis and breakdown rates remained unchanged in slightly overweight subjects [18]. This was confirmed by a recent study by Wall and coworkers, who found an increase in lipid utilization due to carnitine supplementa- tion in exercising humans [12]. According to Pekala et al., L-carnitine and its esters have been proposed as a treatment for many conditions, including obesity [19].
Most available results arise from studies which em- ployed daily dosages that were higher than those used as dietary supplements; e.g. more than 1000 mg per day. One of the reasons that high dosages were often used in the clinical studies may be the difficulty to obtain clear results of L-carnitine effects due to its indigenous exis- tence in the subjects. Moreover, energy metabolism is easily affected by individual life styles such as daily diet and physical activities, which may bias the effects of L- carnitine supplementation.
ate effects of low dose L-carnitine supplementation (500 mg per day) on weight loss and other energy metabo- lism-related parameters. Special focus is directed to the influence of concomitant motivation training on the out- come parameters of the study.
Modern weight loss programs comprise a combination of supplementation with weight-reducing agents and mo- tivation trainings in order to promote changes in life style with regard to eating habits and physical activity that may support the weight-reducing effects [20-23].
2. Materials and Methods
2.1. Study Design
The trial was designed as a double-blind randomized placebo controlled study. All subjects provided written informed consent before screening. The study protocol was approved by Shiba Palace Clinic Ethics Committee. The study was conducted from September 2009 to De- cember 2009 including subject recruitment and data pro- cessing in SOUKEN (Institute of General Health De- velopment Co., Ltd.).
97 male (20 - 60 years [yrs]) Japanese subjects were screened. 24 male subjects (BMI: 25 - 28 kg/m2, triglyc-
erides [TG]: 150 - 350 mg/dL, waist circumference: 85 - 100 cm, without exercising habit) were allocated to two classes: L-carnitine group (C) (760 mg of L-carnitine tar- trate = 500 mg L-carnitine for 4 weeks) and placebo group (NC). Subjects were instructed to ingest 4 cap- sules/day with water after breakfast. Lonza Japan Ltd. provided CarnipureTM (L-carnitine L-tartrate), and pla-
cebo (cellulose) capsules.
Each class was divided in two groups: motivated (M) and non motivated (NM). Motivation training included a face-to-face 30 min session with the principal investiga- tor at the baseline visit, where the subjects were informed about L-carnitine and its metabolic functions. Further- more, subjects learned about the beneficial effect of weight loss on the risk of metabolic diseases. Subjects were encouraged to perform daily physical activities like “taking stairs” instead of “using escalators”. Furthermore, it was recommended to reduce calorie intake to 1500 - 1800 kcal by taking light meals. Subjects were instructed to use pedometers (step counters) throughout the day to keep record of their physical activity, and to monitor their body weight using bathroom scales provided to them. Both step count and weight were recorded by each subject of the motivated groups on a daily basis. Fur- thermore, subjects were instructed to report food intake on the 7 days before start of supplementation and on the 7 days prior to the last visit. After 2 weeks, a 15 min fol- low up interview was held to review and reconfirm the previous instructions. The interviews were conducted in
double blinded manner in terms of L-carnitine ingestion. At baseline and after 4 weeks of supplementation, the following assessments were performed: body fat content was determined by bioelectrical impedance measurement (In Body 3.2, BIOSPACE Co., Ltd., Korea), basal meta- bolic rate was measured with a gas analyser (Vmax29s, Sensor Medics Co.). In addition blood analyses were per- formed (see below under Laboratory Assessment).
In the motivated group (M), energy intake, body weight, and amount of physical activity were monitored. Energy intake was calculated from a web diet survey (including a hearing survey with Excel Eiyo-kun Ver. 4. 5 Kenpaku-sha Ltd., a diet monitoring software). The amount of ex-ercise was surveyed by continuous pedometer measure-ments.
Subjects were fasting 12 hours prior to each visit. No beverages or food other than mineral water were allowed until blood was drawn on the measurement day. Subjects were prohibited to take any kinds of dietary supplements or functional foods which claim to modify fat or energy metabolism throughout the study. Subjects were asked to avoid irregular activities (lack of sleep, excessive eating or drinking, etc.).
After 2 weeks and after 4 weeks of supplementation, 15 minutes interviews were held to assess subject com- pliance and monitor potential adverse events.
This study was implemented in adherence with the guidelines of the Declaration of Helsinki.
2.2. Laboratory Assessment
The following parameters were measured in the whole blood: white blood cell count, red blood cell count, hae- moglobin, haematokrit, mean corpuscular volume (MCV), mean corpuscular haemoglobin (MCH), mean corpuscu- lar haemoglobin concentration and the platelet count.
In the serum the following was measured: total cho- lesterol, TG, low density lipoprotein (LDL) cholesterol, high density lipoprotein (HDL) cholesterol, adiponectin, urea nitrogen, creatinine, uric acid, aspartate aminotrans- ferase, alanine aminotransferase, γ-glutamyltransferase, serum insulin, sodium, potassium and chlorine.
One parameter was measured in the plasma: blood glucose.
One parameter was measured in haemolysate: HbA1c. All measurements were carried out at the research la- boratory of BML, Inc. 5-21-3 Sendagaya, Shibuya-ku, Tokyo 151-0051 Japan.
2.3. Statistical Analysis
The values of all parameters are presented as the mean ± standard deviation. 3 subjects were excluded from the statistical evaluation. Any unavailable data for any rea- son were processed as missed data.
All analyses were carried out using SPSS (IBM) Ver. 16. Effects of supplementation (value after 4 weeks) were tested versus baseline data. Furthermore, effect of L-carnitine supplementation with and without motivation training was tested versus the respective placebo group. Correlated t-test was applied at “baseline” and “after 4 weeks” within each group, and Tukey’s test was applied between groups at “baseline” and “after 4 weeks” on all variables.
3. Results
3.1. Baseline Values
The present study is a randomized, placebo-controlled double blind clinical trial to study the effect of 4 weeks intake of low dose (500 mg/day) L-carnitine in combi- nation with motivation training on body weight and body composition. Of the 24 subjects who entered into the study, all subjects completed the 4 weeks administration, but only 21 were included in the subsequent evaluation. 3 subjects were excluded from the analysis for violation of one inclusion criterion, as they led extraordinary life- styles being night workers. The demographic characteris- tics of the study population at baseline are presented in
Table 1. Subjects were randomized so that the means of serum TG levels (216 - 228 mg/dL), BMI (25.8 - 26.6 kg/m2), peripheral waist circumference (93.3 - 99.2 cm),
and age (40.2 - 44.4 yr) were as close as possible be- tween groups. However, body weight was higher in the L-carnitine-motivated group than in the other 3 groups at baseline (see Table 2).
3.2. Effect of Motivation Training on Life Style
Although subjects were motivated to keep daily calorie intake between 1500 and 1800 kcal, energy intake of most of the subjects exceeded 2500 kcal/day. Energy
Table 1. Baseline demographic characteristics of the sub- jects (n = 21).
L-carnitine Placebo
Motivated group
Non-motivated group
Motivated group
Non-motivated group
Number of
subjects 5 6 5 5
Age (year) 44.4 ± 3.5 43.3 ± 8.2 40.2 ± 4.8 43.4 ± 6.5
Height (cm) 175.7 ± 3.8 168.5 ± 5.1 169.5 ± 3.2 169.9 ± 5.8
mean ± SD.
intake did not change significantly during the intervene- tion and was not different between groups (Table3). In both motivated groups, average step count increased be- tween baseline (C/M = 5934; NC/M = 5199) and 4 weeks (C/M = 8617; NC/M = 6872). However, both increases were not found to be statistically significant.
3.3. Effect of Intervention on Body Weight and Body Composition
The L-carnitine motivated group showed a significant decrease in body weight (baseline: 82.0 ± 2.2, 4 weeks: 80.9 ± 1.8 kg, p = 0.007) within 4 weeks of intervention, while body weight increased or remained constant in all other groups (see Table 2). The body weight change was significantly different between the L-carnitine motivated group and the placebo non-motivated group (p = 0.0019; see Figure 1). As shown in Figure 2, body weight de- creased in all subjects in the L-carnitine motivated group, in contrast to all other 3 groups.
BMI decreased significantly in L-carnitine motivated group (from 26.6 kg/m2 at baseline to 26.2 kg/m2 after 4
weeks), whereas it remained the same or even slightly increased in other 3 groups (see Table 2).
No significant changes were observed in body fat mass, muscle mass and basal metabolism.
3.4. Effect of Intervention on Blood Lipids
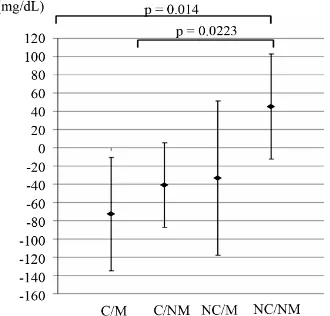
The L-carnitine motivated group showed the largest de- crease in serum TG levels (baseline 218 ± 45 mg/dL, 4 weeks 145 ± 42 mg/dL) among all other groups (see Ta- ble 4 and Figure 3). TG levels were statistically signifi- cantly lower in the L-carnitine motivated group than in the placebo non-motivated group at 4 weeks after intake (p = 0.03). Changes in triglyceride levels were signifi- cantly different between L-carnitine motivated group as well as L-carnitine non-motivated group and placebo non-motivated group (p = 0.014 and 0.0223, respectively,
Figure 3). On individual level shown on Figure 4, TG changes were observed with some similarities to those on body weight patterns (Figure 2).
Cholesterol levels did not change significantly, but showed positive trends in the L-carnitine motivated group: Total cholesterol decreased slightly in the L-carnitine motivated group (2 mg/dL), in comparison to all other groups which showed mild to moderate increases (up to +22 mg/dL in the placebo non-motivated group).
LDL cholesterol remained constant in the L-carnitine motivated group but increased in all other groups. The increase reached statistical significance only in the pla- cebo non-motivated group.
Table 2. Comparison of body weight and body composition between the 4 groups at baseline and after 4 weeks (n = 21).
L-carnitine Placebo
Motivated group Non-motivated group Motivated group Non-motivated group
Number of subjects 5 6 5 5
Baseline 82.0 ± 2.2 73.4 ± 3.6 75.3 ± 1.6 76.2 ± 6.4
Body weight (kg)
4 weeks 80.9 ± 1.8ab 73.6 ± 3.4 75.3 ± 1.4 76.9 ± 6.1
Baseline 26.6 ± 1.1 25.8 ± 0.6 26.2 ± 1.0 26.4 ± 0.6
Body mass index (kg/m2)
4 weeks 26.2 ± 1.0c 25.9 ± 0.6 26.2 ± 1.1 26.6 ± 0.5
Baseline 58.7 ± 3.0 53.6 ± 4.4 54.3 ± 3.3 56.5 ± 4.6
Muscle mass (kg)
4 weeks 58.0 ± 2.7 53.8 ± 3.7 54.6 ± 2.5 56.8 ± 4.5
Baseline 20.1 ± 2.4 16.8 ± 1.4 17.9 ± 2.6 16.5 ± 2.1
Body fat mass(kg)
4 weeks 19.7 ± 2.4 16.6 ± 1.0 17.6 ± 2.5 17.0 ± 1.9
Baseline 1590 ± 59 1512 ± 147 1546 ± 94 1566 ± 161
Basal metabolism (kcal/day)
4 weeks 1575 ± 48 1517 ± 128 1552 ± 82 1571 ± 160
Baseline 99.2 ± 3.4 93.3 ± 3.2 95.5 ± 4.9 94.7 ± 6.3
Waist (cm)
4 weeks 97.9 ± 2.3 94.2 ± 3.5 94.5 ± 4.4 95.2 ± 6.6
[image:4.595.345.497.379.570.2]mean ± SD; a: p < 0.01, for change from baseline at 4 weeks; b: p < 0.05, for L-carnitine motivated group versus L-carnitine non-motivated group; c: p < 0.05, for change from baseline at 4 weeks. Within each group, correlated t-test was applied at “baseline” and “after”; Tukey’s test was applied between every two group at “baseline” and “after 4 weeks”.
Table 3. Energy intake and step count in the motivated groups at baseline and after 4 weeks (n = 21).
L-carnitine Placebo
Motivated group Motivated group
Number of subjects 5 5
Baseline 1940 ± 307 2138 ± 576
Calories (kcal)
4 weeks 2079 ± 215 2125 ± 413
Baseline 5934 ± 2367 5199 ± 2473
Step count (step)
4 weeks 8617 ± 2883 6872 ± 1375
mean ± SD.
Figure 2. Individual body weight changes between baseline and 4 weeks. C/M: L-carnitine/Motivated; C/NM: L-carni- tine/Non-motivated; NC/M: Placebo/Motivated; NC/NM: Pla- cebo/Non-motivated. Values are means ± SD; n = 21.
3.5. Effect of Intervention on Metabolic Parameters
Adiponectin was significantly higher in the L-carnitine motivated group at 4 weeks after intake compared to baseline (baseline: 7.54 ± 2.44, 4 weeks: 8.72 ± 2.15 µg/mL, p = 0.04; see Table 5). However, this increase was not statistically significant compared to placebo or -carnitine non-motivated group. Adiponectin levels
[image:4.595.60.278.422.685.2]Table 4. Lipid profile between the 4 groups at baseline and after 4 weeks (n = 21).
L-carnitine Placebo
Motivated group Non-motivated group Motivated group Non-motivated group
Number of subjects 5 6 5 5
Baseline 218 ± 45 228 ± 33 216 ± 64 220 ± 79
Triglyceride (mg/dL)
4 weeks 145 ± 42a 187 ± 38 183 ± 51 265 ± 108
Baseline 215 ± 31 218 ± 32 232 ± 32 209 ± 28
Total Cholesterol (mg/dL)
4 weeks 213 ± 36 221 ± 30 237 ± 30 231 ± 36
Baseline 126 ± 22 128 ± 18 147 ± 30 125 ± 29
LDL Cholesterol (mg/dL)
4 weeks 129 ± 24 138 ± 24 154 ± 25 141 ± 38b
Baseline 57.4 ± 14.3 50.3 ± 18.8 48.2 ± 3.6 46.4 ± 10.9
HDL Cholesterol (mg/dL)
4 weeks 61.0 ± 14.0 50.2 ± 12.6 50.8 ± 6.0 47.2 ± 10.8
[image:5.595.65.540.324.475.2]mean ± SD; a: p < 0.05, for L-carnitine motivated group versus placebo non-motivated group; b: p < 0.05, for change from baseline at 4 weeks; Within each group, correlated t-test was applied at “baseline” and “after 4 weeks”; Tukey’s test was applied between every two group at “baseline” and “after 4 weeks”.
Table 5. Metabolic parameters between the 4 groups at baseline, and after 4 weeks (n = 21).
L-carnitine Placebo
Motivated group Non-motivated group Motivated group Non-motivated group
Number of subjects 5 6 5 5
Baseline 7.54 ± 2.44 6.32 ± 3.74 6.52 ± 1.75 5.68 ± 1.26
Total adiponectin (μg/mL)
4 weeks 8.72 ± 2.15a 6.93 ± 4.60 6.08 ± 1.48 6.24 ± 0.33
Baseline 99.2 ± 3.7 97.2 ± 4.5 99.8 ± 9.1 95.8 ± 4.3
Blood glucose (mg/dL)
4 weeks 98.6 ± 2.7 98.7 ± 11.2 96.2 ± 4.4 100.0 ± 4.0
Baseline 5.10 ± 0.29 5.07 ± 0.28 4.72 ± 0.24 4.78 ± 0.19
HbA1c (%)
4 weeks 5.12 ± 0.26 5.10 ± 0.28 4.72 ± 0.29 4.82 ± 0.24
Baseline 7.94 ± 2.16 6.17 ± 1.80 10.70 ± 10.20 5.96 ± 2.44
Insulin (μU/mL)
4 weeks 8.46 ± 1.92 13.10 ± 7.00a,c 5.44 ± 1.58 10.70 ± 3.70b
mean ± SD; a: p < 0.05, for change from baseline at 4 weeks; b: p < 0.01, for change from baseline at 4 weeks; c: p < 0.05, for L-carnitine non-motivated group versus placebo motivated group; Within each group, correlated t-test was applied at “baseline” and “after 4 weeks”; Tukey’s test was applied between every two group at “baseline” and “after 4 weeks”.
Figure 3. Average changes in serum triglyceride levels be- tween baseline and 4 weeks. C/M: L-carnitine/Motivated; C/ NM: L-carnitine/Non-motivated; NC/M: Placebo/Motivated; NC/NM: Placebo/Non-motivated. Values are means ± SD; n = 21.
[image:5.595.95.260.519.677.2] [image:5.595.346.501.523.676.2]showed an increase in all subjects in the L-carnitine mo- tivated group, in contrast to the diversified results of all other 3 groups.
No clinically or statistically significant changes were observed in levels of glucose and HbA1c across the dif- ferent groups. Insulin levels showed large fluctuations and increased statistically significantly in both carnitine and placebo non-motivated groups compared to baseline (p = 0.038 and p = 0.006, respectively). Insulin levels were statistically significantly higher in the L-carnitine non-motivated group compared to placebo motivated
group at 4 weeks (p = 0.047).
3.6. Effect of Intervention on Safety Parameters
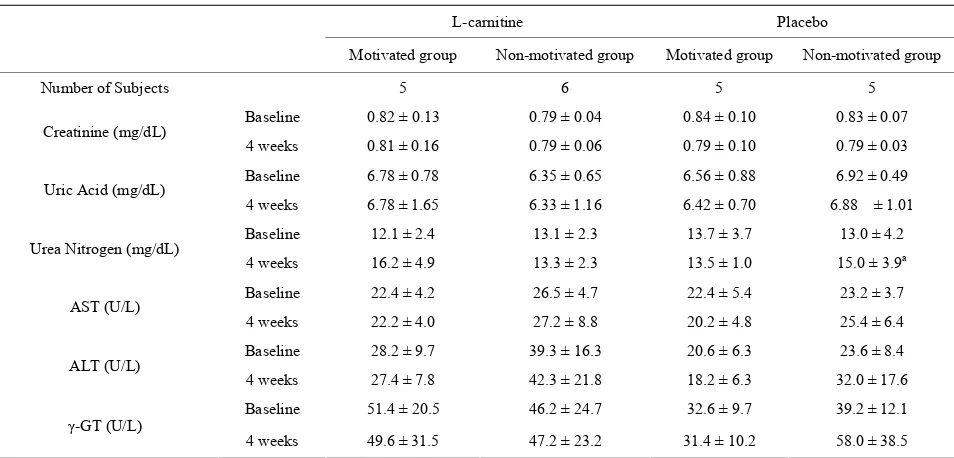
[image:6.595.67.540.257.436.2]Slight changes were observed in white blood cell count, MCV, MCH, platelet count and plasma urea nitrogen. However, these changes were not clinically relevant and were not confined to a certain treatment group. The re- sults from the complete blood count are presented in Ta- ble 6. Markers of renal function and liver function are shown in Table 7. Both L-carnitine and placebo were well tolerated in all subjects.
Table 6. Complete blood count between the 4 groups at baseline and after 4 weeks (n = 21).
L-carnitine Placebo
Motivated group Non-motivated group Motivated group Non-motivated group
Number of subjects 5 6 5 5
Baseline 7458 ± 2261 6243 ± 1743 4784 ± 1020 5536 ± 1422
White blood cells (×100/μL)
4 weeks 5770 ± 1069 7027 ± 2818 4886 ± 1280 6032 ± 1256a
Baseline 498 ± 18 519 ± 19 513 ± 19 486 ± 20
Red blood cells (×104/μL)
4 weeks 509 ± 25 522 ± 31 512 ± 30 508 ± 14
Baseline 15.4 ± 0.8 15.4 ± 0.7 15.7 ± 0.4 14.8 ± 0.8
Hemoglobin (g/dL)
4 weeks 15.7 ± 0.9 15.5 ± 0.9 15.6 ± 1.1 15.7 ± 0.6
Baseline 45.6 ± 2.3 47.2 ± 2.2 46.8 ± 2.4 44.4 ± 1.6
Hematocrit (%)
4 weeks 46.1 ± 2.2 46.4 ± 2.3 46.2 ± 2.2 45.9 ± 1.0
Baseline 23.0 ± 4.8 24.6 ± 3.9 21.7 ± 4.9 25.2 ± 7.4
Platelet count (×104/μL)
4 weeks 25.3 ± 6.2 26.3 ± 3.1 23.4 ± 5.7b 25.3 ± 7.0
mean ± SD; a: p < 0.05, for change from baseline at 4 weeks; b: p < 0.05, for change from baseline at 4 weeks; Within each group, correlated t-test was applied at “baseline” and “after 4 weeks”; Tukey’s test was applied between every two group at “baseline”and “after 4 weeks”.
Table 7. Markers of liver and renal functions between the 4 groups at baseline and after 4 weeks (n = 21).
L-carnitine Placebo
Motivated group Non-motivated group Motivated group Non-motivated group
Number of Subjects 5 6 5 5
Baseline 0.82 ± 0.13 0.79 ± 0.04 0.84 ± 0.10 0.83 ± 0.07
Creatinine (mg/dL)
4 weeks 0.81 ± 0.16 0.79 ± 0.06 0.79 ± 0.10 0.79 ± 0.03
Baseline 6.78 ± 0.78 6.35 ± 0.65 6.56 ± 0.88 6.92 ± 0.49
Uric Acid (mg/dL)
4 weeks 6.78 ± 1.65 6.33 ± 1.16 6.42 ± 0.70 6.88 ± 1.01
Baseline 12.1 ± 2.4 13.1 ± 2.3 13.7 ± 3.7 13.0 ± 4.2
Urea Nitrogen (mg/dL)
4 weeks 16.2 ± 4.9 13.3 ± 2.3 13.5 ± 1.0 15.0 ± 3.9a
Baseline 22.4 ± 4.2 26.5 ± 4.7 22.4 ± 5.4 23.2 ± 3.7
AST (U/L)
4 weeks 22.2 ± 4.0 27.2 ± 8.8 20.2 ± 4.8 25.4 ± 6.4
Baseline 28.2 ± 9.7 39.3 ± 16.3 20.6 ± 6.3 23.6 ± 8.4
ALT (U/L)
4 weeks 27.4 ± 7.8 42.3 ± 21.8 18.2 ± 6.3 32.0 ± 17.6
Baseline 51.4 ± 20.5 46.2 ± 24.7 32.6 ± 9.7 39.2 ± 12.1
γ-GT (U/L)
4 weeks 49.6 ± 31.5 47.2 ± 23.2 31.4 ± 10.2 58.0 ± 38.5
mean ± SD; a: p < 0.05, for change from baseline at 4 weeks;Within each group, correlated t-test was applied at “baseline” and “after 4 weeks”;Tukey’s test as applied between every two group at “baseline” and “after 4 weeks”.
w
[image:6.595.61.538.483.712.2]4. Discussion
The primary purpose of this study was to examine the effect of supplementation with 500 mg of L-carnitine per day for 4 weeks on weight management and energy metabolism related parameters in healthy human sub- jects with and without supportive motivation training. Although several previous studies have examined L- carnitine supplementation, this is the first study to report in depth on the effect of low dosage L-carnitine ingestion in combination with motivation training on body weight.
The L-carnitine motivated group showed significant body weight loss of −1.10 kg compared to an increase in weight of +0.7 kg in the placebo non-motivated group (p = 0.0019; Figure 1). However, no statistically significant effect of L-carnitine supplementation was observed in the non-motivated group. This is in line with previous stu- dies. Villani et al. found no significant changes in body weight in moderately obese women after supplemen- tation with 4 g of L-carnitine over 8 weeks [24]. Supple- mentation with 2 g of L-carnitine for 3 months in slightly overweight diabetic patients did not affect BMI [25].
It should be noticed that the described study was per- formed during late fall and winter between September and December 2009. Ma et al. showed that caloric intake, physical activity and subsequently body weight vary seasonally, with mean body weight peaking in winter [26]. This might have also factored into the increase of body weight in the placebo non-motivated group. Despite this seasonal effect on body weight, subjects in the L- carnitine motivated group in our study showed signi- ficant weight loss.
Motivation training comprised information about the beneficial effects of weight loss on the risk of metabolic diseases in face-to-face meetings with the medical in- structor as well as instructions to monitor physical activity levels and dietary intake. Participation in the motivation training led to a significant increase of physical activity: In both the placebo motivated and the L-carnitine motivated group, the number of steps in- creased by +1673 steps and +2683 steps, respectively. Energy intake was not significantly affected by moti- vation training of the subjects. The administration of L-carnitine in combination with enhanced physical exercise may have led to the observed reduction of body weight by increasing the rate of fat oxidation. Previous studies on both normal and overweight subjects have shown that supplementation with L-carnitine increases fat oxidation [18,27]. Therefore, a reduction of body fat mass may be expected in the L-carnitine motivated group. Although a slight decrease of body fat mass was
observed, this change was not statistically significant. However, the short duration of the study may have pre- vented a significant effect.
Both the L-carnitine motivated group and the L- carnitine non-motivated group showed a significant drop in serum TG levels compared to the placebo non-mo- tivated group (Figure 3). Figure 5 demonstrates the beneficial effect of a combination of L-carnitine supple- mentation and motivation on serum TG, decreasing their level below 150 mg/dL in 3 out of 5 subjects eliminating, hence, a common risk factor for metabolic syndrome [28].
The beneficial effect of L-carnitine on plasma lipids has been documented in several studies [29]. Mala- guarnera et al. showed that supplementation with 2 g of L-carnitine for 3 months significantly reduced TG from 3.31 ± 0.35 to 2.30 ± 0.31 mmol/L in diabetic patients, which is equivalent to a drop about −88.4 mg/dL. This is in the same range as the TG change observed in our study.
Malaguarnera et al. also observed positive effects of L-carnitine supplementation on total cholesterol, LDL and HDL cholesterol levels [25]. This has not been demonstrated in our study, where cholesterol values did not change significantly. This may be due to the smaller number of the participating subjects, the lower utilized dose of L-carnitine, or the shorter duration of the trial (4 weeks). Also, in our study, no diet restriction was applied, in contrast to the low-fat and high-fiber diet in the com- parative study.
[image:7.595.333.514.561.677.2]In our study, adiponectin levels were increased in the L-carnitine motivated group at the end of the treatment period compared to baseline levels (+1.18 µg/ml; p = 0.04). A similar trend was observed in the L-carnitine non-motivated group (+0.61 µg/ml), however, this change was not statistically significant. Adiponectin is a peptide hormone produced in the adipocytes, and its levels are inversely related to the fat mass of the body[30]. Administration of adiponectin has been associated
with reduction of plasma glucose levels and increase of insulin sensitivity. Therefore, an increase of adiponectin levels is regarded as beneficial with respect to risk fac- tors of metabolic syndrome [30].
Several studies evaluating changes in adiponectin le- vels which occurred during weight reduction resulting from various treatments did not have consistent results [30,31]. Weight loss per se seems not to have an effect on adiponectin levels. In a study by Silva, de Almeida, and Feoli, weight loss achieved with a low-calorie diet plus exercise increased adiponectin levels in the range of 18% - 48% [32]. An increase in adiponectin levels oc- curred also in a study on the effects of acetyl-L-carnitine (a naturally occurring carnitine derivate, which is dea- cetylated to L-carnitine after ingestion) in subjects at in- creased cardiovascular risk [33]. Supplementation with 2 g/d acetyl-L-carnitine for 24 weeks (equivalent to 1.6 g L-carnitine) induced an increase of adiponectin by 27% compared to an increase about 15% observed in the L- carnitine motivated group in our study.
Elevated adiponectin serum levels could be explained by the hypothesis that an improved oxidation of free fatty acids might be associated with a secondary increase in adiponectin expression [34].
Insulin levels showed large variations in our study. The observed significant increases cannot be attributed to either L-carnitine supplementation or motivation training and may have been influenced by other non-controlled parameters.
Our study demonstrates that the efficacy of a weight loss program may be strongly influenced by motivation training. For all parameters that showed significant changes during the treatment (body weight, triglycerides, and adi- ponectin levels), stronger effects were observed in the L-carntine motivated group than in the L-carnitine non- motivated group. This is supported by the study of Unick
et al. who investigated the influence of a telephone motivation program on the achievement of weight loss in overweight and obese women [35]. It turned out that the number of telephone calls was a strong predictor of weight loss success.
Several countries have recently started health pro- grams to achieve lifestyle changes in order to support weight loss and prevent metabolic diseases [36,37]. Our results substantiate the beneficial effect of motivation training on the efficacy of weight loss programs. Also for the clinical examination of the efficacy of dietary supple- ments, which may be affected by inter-individual life style variability, the implementation of motivation train- ing may be advisable to obtain more pronounced effects of the intervention.
Supplementation of L-carnitine is considered safe for doses up to 15 g/d in healthy men [38]. Therefore,
markers of hepatic and renal function as well as blood hematology in Japanese men after daily ingestion of a dose of L-carnitine of 500 mg/d for 4 weeks showed no abnormalities as expected.
There were some limitations to this pilot study. The main limitation concerns the small number of subjects. This may be a crucial limitation that weakens the sig- nificance of the results, although the observed changes do signify a beneficial effect of L-carnitine supplemen- tation in combination with motivation training. We tried to equally allocate subjects to each group, but 3 subjects were excluded for violation of the inclusion criteria. Furthermore, the relatively short duration of this clinical trial (4 weeks) and the utilized low dose of L-carnitine may explain the lack of significance in the achieved changes in many of the assessed parameters. L-carnitine seems to induce a slow but consistent increase of muscle carnitine stores. A recent study by Wall et al. has shown, that an increase in muscle carnitine is observed after 12 weeks of supplementation, which reaches statistical sig- nificance only after 24 weeks [12]. Therefore, it can be assumed that the effect of L-carnitine on body weight and serum lipids will be more pronounced in a study of a longer duration.
Low dosage L-carnitine combined with motivation may have a beneficial effect on several metabolic syn- drome risk parameters, including TG and adiponectin, which could offer a safe, low cost, and easily applicable strategy targeting weight loss in overweight humans.
REFERENCES
[1] Organization for Economic Co-operation and Develop- ment, “Health at a Glance,” OECD Publishing, Paris, 2011.
[2] Ministry of Health, Labour and Welfare, “Outline for the Results of the National Health and Nutrition Survey Ja-pan,” Ministry of Health, Labour and Welfare, Tokoy, 2007.
[3] U. Pagotto, D. Vanuzzo, V. Vicennati and R. Pasquali, “Pharmacological Therapy of Obesity,” Giornale Italiano di Cardiologia (Rome), Vol. 9, No. 4, 2008, pp. 83S-93S. [4] D. S. Weigle, “Pharmacological Therapy of Obesity: Past,
Present, and Future,” The Journal of Clinical Endocrino- logy & Metabolism, Vol. 88, No. 6, 2003, pp. 2462-2469. doi:10.1210/jc.2003-030151
[5] W. P. James, I. D. Caterson, W. Coutinho, N. Finer, L. F. Van Gaal, A. P. Maggioni, C. Torp-Pedersen, A. M. Sharma, G. M. Shepherd, R. A. Rode and C. L. Renz, “Effect of Sibutramine on Cardiovascular Outcomes in Overweight and Obese Subjects,” The New England Jour- nal of Medicine, Vol. 363, No. 10, 2010, pp. 905-917. [6] A. J. Scheen, “Cardiovascular Risk-Benefit Profile of Sibu-
doi:10.2165/11584800-000000000-00000
[7] M. Li and B. M. Cheung, “Pharmacotherapy for Obesity,” British Journal of Clinical Pharmacology, Vol. 68, No. 6, 2009, pp. 804-810.
[8] M. R. Rubin, J. S. Volek, A. L. Gomez, N. A. Ratamess, D. N. French, M. J. Sharman and W. J. Kraemer, “Safety Measures of L-Carnitine L-Tartrate Supplementation in Healthy Men,” The Journal of Strength & Conditioning Research, Vol. 15, No. 4, 2001, pp. 486-490.
[9] V. S. Gulewitsch and G. R. Krimberg, “Information about Muscle Extracts,” Hoppe-Seyler’s Journal of Physio- logical Chemistry, Vol. 45, No. 3-4, 1905, pp. 326-330. [10] E. Strack, P. Wordehoff, E. Neubaur and H. Geissen-
dörfer, “Information about Muscle Contents of Choline, Acetylcholine and Carnitine,” Hoppe-Seyler’s Journal of Physiological Chemistry, Vol. 233, No. 5-6, 1935, pp. 189-203.
[11] K. Sahlin, “Boosting Fat Burning with Carnitine: An Old Friend Comes out from the Shadow,” The Journal of Phy- siology, Vol. 589, 2011, pp. 1509-1510.
doi:10.1113/jphysiol.2011.205815
[12] B. T. Wall, F. B. Stephens, D. Constantin-Teodosiu, K. Marimuthu, I. A. Macdonald and P. L. Greenhaff, “Chro- nic Oral Ingestion of L-Carnitine and Carbohydrate In-creases Muscle Carnitine Content and Alters Muscle Fuel Metabolism during Exercise in Humans,” The Journal of Physiology, Vol. 589 Pt 4, 2011, pp. 963-973.
[13] F. B. Stephens, D. Constantin-Teodosiu and P. L. Green- haff, “New Insights Concerning the Role of Carnitine in the Regulation of Fuel Metabolism in Skeletal Muscle,” The Journal of Physiology, Vol. 581, 2007, pp. 431-444. [14] D. W. Foster, “The Role of the Carnitine System in
Hu-man Metabolism,” Annals of the New York Academy of Sciences, Vol. 1033, No. 1, 2004, pp. 1-16.
doi:10.1196/annals.1320.001
[15] S. Abdel-Aleem, M. Sayed-Ahmed, M. A. Nada, S. C. Hendrickson, J. St. Louis and J. E. Lowe, “Stimulation of Non-Oxidative Glucose Utilization by L-Carnitine in Iso-lated Myocytes,” Journal of Molecular and Cellular Car-diology, Vol. 27, No. 11, 1995, pp. 2465-2472.
doi:10.1006/jmcc.1995.0234
[16] D. Monti, L. Troiano, F. Tropea, E. Grassilli, A. Cossa- rizza, D. Barozzi, M. C. Pelloni, M. G. Tamassia, G. Bel-lomo and C. Franceschi, “Apoptosis-Programmed Cell Death: A Role in the Aging Process?” The American Jour- nal of Clinical Nutrition, Vol. 55, No. 6, 1992, pp. 1208S- 1214S.
[17] J. Kolodziejczyk, J. Saluk-Juszczak and B. Wachowicz, “L-Carnitine Protects Plasma Components against Oxida-tive Alterations,” Nutrition, Vol. 27, No. 6, 2011, pp. 693-699. doi:10.1016/j.nut.2010.06.009
[18] K. D. Wutzke and H. Lorenz, “The Effect of L-Carnitine on Fat Oxidation, Protein Turnover, and Body Composi-tion in Slightly Overweight Subjects,” Metabolism, Vol. 53, No. 8, 2004, pp. 1002-1006.
doi:10.1016/j.metabol.2004.03.007
[19] J. Pekala, B. Patkowska-Sokola, R. Bodkowski, D. Jam-roz, P. Nowakowski, S. Lochynski and T. Librowski,
“L-Carnitine-Metabolic Functions and Meaning in Hu- mans Life,” Current Drug Metabolism, Vol. 12, No. 7, 2011, pp. 667-678. doi:10.2174/138920011796504536 [20] J. W. Anderson, L. R. Reynolds, H. M. Bush, J. L. Rinsky
and C. Washnock, “Effect of a Behavioral/Nutritional In-tervention Program on Weight Loss in Obese Adults: A Randomized Controlled Trial,” Postgraduate Medical, Vol. 123, No. 5, 2011, pp. 205-213.
[21] L. F. DeFina, L. G. Marcoux, S. M. Devers, J. P. Cleaver, and B. L. Willis, “Effects of Omega-3 Supplementation in Combination with Diet and Exercise on Weight Loss and Body Composition,” The American Journal of Clinical Nutrition, Vol. 93, No. 2, 2011, pp. 455-462.
doi:10.3945/ajcn.110.002741
[22] D. Laddu, C. Dow, M. Hingle, C. Thomson and S. Going, “A Review of Evidence-Based Strategies to Treat Obesity in Adults,” Nutrition in Clinical Practice, Vol. 26, No. 5, 2011, pp. 512-525. doi:10.1177/0884533611418335 [23] C. N. Poole, M. D. Roberts, V. J. Dalbo, P. S. Tucker, K.
L. Sunderland, N. D. DeBolt, B. W. Billbe and C. M. Kerksick, “The Combined Effects of Exercise and In- gestion of a Meal Replacement in Conjunction with a Weight Loss Supplement on Body Composition and Fit-ness Parameters in College-Aged Men and Women,” The Journal of Strength & Conditioning Research, Vol. 25, No. 1, 2011, pp. 51-60.
doi:10.1519/JSC.0b013e3181fee4aa
[24] R. G. Villani, J. Gannon, M. Self and P. A. Rich, “L-Car- nitine Supplementation Combined with Aerobic Training Does Not Promote Weight Loss in Moderately Obese Women,” International Journal of Sport Nutrition and Exercise Metabolism, Vol. 10, No. 2, 2000, pp. 199-207. [25] M. Malaguarnera, M. Vacante, T. Avitabile, L. Cammal-
leri and M. Motta, “L-Carnitine Supplementation Reduces Oxidized LDL Cholesterol in Patients with Diabetes,” The American Journal of Clinical Nutrition, Vol. 89, No. 1, 2009, pp. 71-76. doi:10.3945/ajcn.2008.26251
[26] Y. Ma, B. C. Olendzki, W. Li, A. R. Hafner, D. Chiriboga, J. R. Hebert, M. Campbell, M. Sarnie and I. S. Ockene, “Seasonal Variation in Food Intake, Physical Activity, and Body Weight in a Predominantly Overweight Popu- lation,” European Journal of Clinical Nutrition, Vol. 60, No. 4, 2006, pp. 519-528. doi:10.1038/sj.ejcn.1602346 [27] D. M. Muller, H. Seim, W. Kiess, H. Loster and T. Rich-
ter, “Effects of Oral L-Carnitine Supplementation on in Vivo Long-Chain Fatty Acid Oxidation in Healthy Adults,” Metabolism, Vol. 51, No. 11, 2002, pp. 1389-1391. [28] S. M. Grundy, J. I. Cleeman, S. R. Daniels, K. A. Donato,
R. H. Eckel, B. A. Franklin, D. J. Gordon, R. M. Krauss, P. J. Savage, S. C. Smith, J. A. Spertus and F. Costa, “Diag-nosis and Management of the Metabolic Syndrome,” Cir-culation, Vol. 112, No. 17, 2005, pp. e285-e290.
Metabolism and Beyond,” Hormone and Metabolic Re-search, Vol. 34, No. 9, 2002, pp. 469-474.
doi:10.1055/s-2002-34785
[31] M. R. Manigrasso, P. Ferroni, F. Santilli, T. Taraborelli, M. T. Guagnano, N. Michetti and G. Davi, “Association between Circulating Adiponectin and Interleukin-10 Lev-els in Android Obesity: Effects of Weight Loss,” The Journal of Clinical Endocrinology & Metabolism, Vol. 90, No. 10, 2005, pp. 5876-5879. doi:10.1210/jc.2005-0281 [32] F. M. Silva, J. C. de Almeida and A. M. Feoli, “Effect of
Diet on Adiponectin Levels in Blood,” Nutrition Reviews, Vol. 69, No. 10, 2011, pp. 599-612.
doi:10.1111/j.1753-4887.2011.00414.x
[33] P. Ruggenenti, D. Cattaneo, G. Loriga, F. Ledda, N. Mot-terlini, G. Gherardi, S. Orisio and G. Remuzzi, “Amelio-rating Hypertension and Insulin Resistance in Subjects at Increased Cardiovascular Risk: Effects of Acetyl-L-Car- nitine Therapy,” Hypertension, Vol. 54, No. 3, 2009, pp. 567-574.
doi:10.1161/HYPERTENSIONAHA.109.132522
[34] J. A. Paniagua, A. G. de la Sacristana, I. Romero, A. Vidal-Puig, J. M. Latre, E. Sanchez, P. Perez-Martinez, J. Lopez-Miranda and F. Perez-Jimenez, “Monounsaturated Fat-Rich Diet Prevents Central Body Fat Distribution and
Decreases Postprandial Adiponectin Expression Induced by a Carbohydrate-Rich Diet in Insulin-Resistant Sub- jects,” Diabetes Care, Vol. 30, No. 7, 2007, pp. 1717-1723. doi:10.2337/dc06-2220
[35] J. L. Unick, J. M. Jakicic and B. H. Marcus, “Contribu-tion of Behavior Interven“Contribu-tion Components to 24-Month Weight Loss,” Medicine & Science in Sports & Exercise, Vol. 4, No. 4, 2010, pp. 745-753.
doi:10.1249/MSS.0b013e3181bd1a57
[36] G. Boehm, N. Bracharz and R. Schoberberger, “Evalu- ation of the Sustainability of the Public Health Program Slim without Diet (Schlank Ohne Diat),” Wiener Kli- nische Wochenschrift, Vol. 123, No. 13-14, 2011, pp. 415-421.
[37] C. M. Swanson, S. Bersoux, M. H. Larson, R. T. Aponte- Furlow, S. S. Flatten, C. L. Olsen, C. Larosa, P. M. Ve-rona, K. A. Jameson and C. B. Cook, “An Outpatient- Based Clinical Program for Diabetes Prevention: An Up-date,” Endocrine Practice, Vol. 18, No. 2, 2012, pp. 200- 208.