Munich Personal RePEc Archive
The Effects of BRICS and MATIK
Countries on World Economy and
Cointegration Analysis The Long Term
Relation G-7 Growth Rates (1962-2012)
KARGI, Bilal
Aksaray University
March 2014
Online at
https://mpra.ub.uni-muenchen.de/55693/
262
Journal of Economics and Behavioral Studies
Vol. 6, No. 3, pp. 262-272, Mar 2014 (ISSN: 2220-6140)
The Effects of BRICS and MATIK Counties on world Economy and Cointegration Analysis the
Long Term relation With G-7 Growth Rates (1962-2012)
Bilal KARGI
Aksaray University, Ankara, Turkey [email protected]
Abstract: In this article, long term data is analyzed for the total growth of the world economy and the growth of developed (G7) and of the rapid developing economies. BRICS countries are known countries with their meetings since 2008. Rapidly developing countries such as Mexico, Argentina, Turkey, Indonesia and Korea are defined as MATIKin thisanalysisexceptthecountriesfor BRICS meeting. Especially, the basic hypotheses of this study is that BRICS+MATIK countries whose economic shares slowly increase were compared with G-7 and the global economy, i) Help of BRICS+MATIK economies rapidly increase for the growth rate of world
economy: ii)They’re the hypotheses that BRICS+MATIK economies are cointegrated with the growth of world economy in long term. In this way, it may be possible that the help of G-7 is compared with the help of BRICS+MATIK economies for the growth of world economy. The study uses the annual data of the 1962-2012 periods. Time series analysis is used to test the hypotheses. The most important finding is that BRICS+MATIK economies affect the growth rate of world economy, and it constantly increases as statistic according to the help of G-7.The result has been acquired that World, G-7, and BRICS+MATIK economies cointegrated in the long term.
Keywords: BRICS, MATIK, Economic growth, Developing countries, World economy, Cointegration
1. Introduction
Goldman Sachs has used the abbreviation of BRIC (Brazil, Russia, India, and China) for the first time to mean
“rapid developing economies” in 2001 (Singh, 2013). After the regional economic cooperation organization begin to increase in last 40 years, in the final period, BRIC economies became the main topic as structuring beyond the regional samples in 2006. These economies have partially become official with the meeting that was made by foreign affairs ministers of the 4 national rapid developing economies. Brazil, Russia, India and China leaders have reached a consensus for meeting once a year in order to discuss economical and political issues. So, some kind of unity that has formed with the initials (BRIC) of these 4 countries. In 2011, when South Africa was invited to the third meeting in China, the group had a new addition and have been called BRICS ever since. In 2006, from the first meeting at a level of Foreign affairs ministers to the present meetings were made about foreign affairs, finance and economy, trade, agriculture, and health. The meetings have continued about science, technology, trade rivalry and national security. In 2011, in the third meeting, it reached a consensus about playing a central role for the world economy (Schmalz and Ebenau, 2012). It expanded visions that BRICS economies probably will be the biggest economies of the world in by 2030 (Khan, 2011; Yao and Liu, 2011).
263
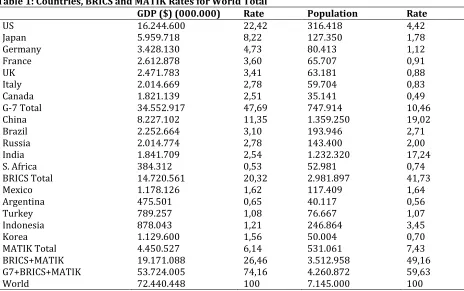
Table 1: Countries, BRICS and MATIK Rates for World Total
GDP ($) (000.000) Rate Population Rate
US 16.244.600 22,42 316.418 4,42 Japan 5.959.718 8,22 127.350 1,78 Germany 3.428.130 4,73 80.413 1,12 France 2.612.878 3,60 65.707 0,91 UK 2.471.783 3,41 63.181 0,88 Italy 2.014.669 2,78 59.704 0,83 Canada 1.821.139 2,51 35.141 0,49 G-7 Total 34.552.917 47,69 747.914 10,46 China 8.227.102 11,35 1.359.250 19,02 Brazil 2.252.664 3,10 193.946 2,71 Russia 2.014.774 2,78 143.400 2,00 India 1.841.709 2,54 1.232.320 17,24 S. Africa 384.312 0,53 52.981 0,74 BRICS Total 14.720.561 20,32 2.981.897 41,73 Mexico 1.178.126 1,62 117.409 1,64 Argentina 475.501 0,65 40.117 0,56 Turkey 789.257 1,08 76.667 1,07 Indonesia 878.043 1,21 246.864 3,45 Korea 1.129.600 1,56 50.004 0,70 MATIK Total 4.450.527 6,14 531.061 7,43 BRICS+MATIK 19.171.088 26,46 3.512.958 49,16 G7+BRICS+MATIK 53.724.005 74,16 4.260.872 59,63 World 72.440.448 100 7.145.000 100
Note: The data was taken from the World Bank. The population data belongs to January 2014, and GDP data is
belongs to 2012.
According to the data in Table-1, (G7+BRICS+MATIK. Shortly GBM) countries that are added to the analysis, generate 59,63%; generate 74,16% of world economy. According to 1962-2012 years, G-7 countries show the average 2,9%; BRICS countries show the average 3,7%, and MATIK countries show the average 4,8% for the growth performance. The average growth rate is 3,8% for GBM. In the same period, while world economy has the average growth 3,45%, the average growth rate of OECD has realized as 3,13%. The most distinct difference of the developing countries from G-7 economies is shown as that liberalization of market mechanism, excess of public sector activities, undercapitalization stock, and lowness of domestic saving isn’t enough. Economic liberalism policies gain wide currency to resolve these troubles. Strengthening the free market, and shortening of trade liberalization and of the state economic activities, has been adopted by the developing countries (Ban and Blyth, 2013). However, even if statism and patrimonialism continue their effects in BRICS economies (Becker, 2013), and it won’t be wrong that the same effects are also true for MATIK economies. These effects are the one of the basic hypotheses of economic theory that while articulation degree increases, they will be removed. Thus, the average growth rates of BM countries occur higher than G-7, OECD and World averages. Graph 1 shows the growth rates.
264
Graph 1: Average Growth Rates
Brazil China India Russian S.Africa BRICS Mexico Argentina Turkey Indonesia Korea MATIK
4.29 8.95 5.18 1.91 3.24 3.70 4.12 3.00 4.63 5.60 6.80 4.80
US Japan Germany France UK Italy Canada G-7 OECD World BM
3.12 3.79 2.05 2.82 2.39 2.54 3.33 2.90 3.13 3.45 4,25
2. Literature Review
The economists have strongly been interested in the developing country economies. Also, there are several studies that analyze this structuring after the BRICS meeting in 2008. These studies analyze the BRICS economies from the different majors, and conclude the general result that the cooperation between developing economies increase the activities of these economies. It is emphasized that the activities of the developing countries that don’t have activity by themselves, are increasing with their cooperation attempts (Keukeleire and Hooijmaaijers, 2013). On the other hand, BRICS structuring has cooperated and has begun to take more common position about their positions in international organizations (e.g. G20) (Luckhurst, 2013).
According to “rapid developing economies” category, even if there isn’t a formal cooperation between MATIK
countries, they follow closely BRICS economies. Therefore, it may be assumed that the definition of MATIK will represent the results of researches in question for BRICS economies. For rapid developing economies, literature is extremely gathered at main subjects such as FDI, NFL, technology transfer, labor force and sensibility against shocks. Generally, FDI make a positive result about developments for the economic development, globalization and science and technology in the developing economies (Das, 2013). This effect also shows a high level for the BRICS economies. Especially, it slowly increases in the field of innovation. Wang and Ying (2014) have concluded on patent applications. In addition, they state that foreign domination decreased in field of novelty, and especially China became prominent in this field. In the same time, particularly, these relations deeply affect and transform labor and marketing habits (Biggemann and Fam, 2010) at a level of firm in Russia and China. This effect also develops competitive advantages with developments in the field of technology, communication and infrastructure (Stone and Ranchhod,2006). When the development in human resources is added, it provides a basis that the growth performance of BRICS economies also continues in the future (Yao and Liu,2011). Moreover, Lotz et al. (2013) that test the causality relations between scientific research and economic growth, has confirmed the causality relation for
Brazil, 4.29 China, 8.95
India, 5.18
Russian, 1.91 S.Africa, 3.24
Mexico, 4.12 Turkey, 4.62
G-7, 2.90OECD, 3.13
World, 3.45BRICS, 3.70Canada, 3.33 France, 2.82
Germany, 2.05 Italy, 2.54
Japane, 3.79 Argentina , 3.00
Indonesia, 5.60
UK, 2.39 US, 3.12
MATIK, 4.80 Korea, 6.80
BM, 4.25
0.00 1.00 2.00 3.00 4.00 5.00 6.00 7.00 8.00 9.00 10.00
265
4 other economies except India. The BRICS economies and exchanges have the continuous increase trend for the mutual dependence on each other, and are also in a cointegration relation for long term (Gambhir and Bhandari, 2011). With the 2008 financial crisis, the relation between the BRICS economies and the stock market of developed economies has had a change. Correlation relation between India and China has grown stronger (Zhang and Yu, 2013). In the same time, the relation between the USA and BRICS slowly grew stronger (Aloui et al., 2011), and dependence increased. This dependence strengthened price-earning relation with growth rates with regards to developed countries (Bao,2009; Gambhir and Bhandari, 2011).
The banking system also had strengthened financial relations beside this interaction in exchanges, and this situation has provided that foreign direct capital investments increased between countries (Kaur et al. 2013). In the same time, the widest foreign investment was to Africa, India and China (Aggarwal, 2011). Also, the BRICS economies investee in low-income countries, and established commercial and financial ties (Samake and Yang, 2014; Holtbrügge and Kreppel, 2012), and these ties have growth potential for both sides. So, they have slowly began to play an important role on global growth (Schrooten, 2011), and the growth centered BRICS economies changed the traditional domination of USA, Europe and Japan (Pillania, 2009). In the same time, it strengthened the production relations of countries. For example, Vries et al. (2012) has analyzed productivity through 35 sectors, and has concluded that total productivity increased for 4 countries except Brazil in the study. Haq and Mailke (2010) concluded that import-demand elacticity of India is lower than the 4 other countries in trade relation between BRICS economies and high income economies. Jadhav (2012) has acquired statistical results about that the efficient factors of BRICS economies are market size, trade liberalization, accountability and foreign direct capital investment on economic growth. It is seen that applied monetary policies by the BRICS economies (Mallick and Sousa, 2013) are sensitive to shocks, and a monetary tightening is also efficient on total output growth with financial markets (Mallick and Sousa,2013). According to the effects of inflation for the growth, Manamperi (2014) has determined a unidirectional relation in other countries, while a positive and long term relation is a question in India. According to PPP data, while Chang et
al. (2010) couldn’t determine long term relations in E-G test, Enders and Siklon have determined that there is a relation in cointegration test. In another study, according to different cointegration tests, different results were reached (Chang et al., 2012).
3. Methodology
Current data in the study has been acquired by the annual data base of World Bank from 1962 to 2012. 1990 pre-data of Russian Federation belong to the USSR, and have been taken from Harrison (1993). German data is only from the Federal Republic Germany (West Germany) until 1990, before the re-unification with East Germany. Analysis has been realized in two stages. Principally, curvilineal trends have been acquired by using 6 degree polynomial functions of data sets. Moreover, correlation relation has been calculated between country groups. In the same time, regression estimates of country and country groups with world economy were acquired. In the last stage, regression equation estimates have been principally presented between the world economy and country groups. After that, Engle-Granger (EG) two-staged cointegration test and Johansen-Juselius (JJ) long termed cointegration test have been made to determine long term relations. Also, stability of preconditioned data sets have been tested with Dickey-Fuller (ADF), Phillips-Perron (PP) and KPSS unit root tests to make these tests.
4. Results
World, G-7, BRICS, and MATIK have been acquired for the first stage of analysis, and 6 degree polynomials have been acquired and have shown a curvilineal trend for the BM data. Polynomials are like that:
Table 2: 6 Degree Polynomial Functions.
Polinom R²
World -9E-09x6 + 2E-06x5 - 0.0001x4 + 0.0047x3 - 0.0766x2 + 0.335x + 5.3488 0.3796
G-7 -3E-09x6 + 1E-06x5 - 0.0001x4 + 0.0043x3 - 0.0728x2 + 0.2707x + 5.6745 0.5132
BRICS 7E-08x6 - 1E-05x5 + 0.0007x4 - 0.0198x3 + 0.2284x2 - 0.9047x + 6.0837 0.6016
MATIK -7E-08x6 + 1E-05x5 - 0.0008x4 + 0.0259x3 - 0.4114x2 + 2.8589x + 0.0856 0.1954
266
[image:6.612.73.540.117.190.2]Graphs have been given as No. 1 for polynomials. First coefficients in each polynomials inform the way and intensity of observed fluctuations in No.1 graph.
Table 3: Growth Data Correlations.
WORLD G7 BRICS MATIK
WORLD 1 0.96083 0.641922 0,502628 G7 0.960830 1 0.5417115 0,425025 BRICS 0.641922 0.541711 1 0,347878 MATIK 0,502628 0,425025 0,347878 1
[image:6.612.76.527.317.414.2]The relation of world economy growth and the strongest correlation are still between G-7 countries. However, BRICS and MATIK economies also have an important coefficient. The most remarkable and important subject is that the relation of the country groups can be explained between world economy and correlation with the level of development. The same relation form is also effective for country groups. For example, according to MATIK (0,34), BRICS have stronger correlation with the G-7 (0,54), and according to BRICS (0,54), G-7 show the stronger correlation with world economy (0,96). In the first continuing stage of analysis, regression models have been generated to can be informed that world economy is affected by which country or country groups. The acquired findings from these models are shown in Table 4-6.
Table 4: World Economy and country groups.
Coefficient Std. Error t Statistic Prob.
G7 0,691812 0,033406 20,70897 0,0000 BRICS 0,118283 0,029193 4,051754 0,0002 MATIK 0,069319 0,026978 2,569457 0,0134 c 0,634229 0,139824 4,535919 0,0000 R2 0,950954 Mean Dependent var 3,450980
Adj. R2 0,947823 F-statistic 303,7583
DW 0,944258 Prob (F-statistic) 0,000000
The acquired results from the regression model that the growth rates of world economy are the dependent variables, are shown in Table-4. Accordingly, while 1% rise of G-7 countries contributes 0,69% to the world economy, 1% growth of BRICS economies contribute 0,11% to the world economy, and MATIK economies contribute 0,06%. When BRICS and MATIK countries are discussed together, the acquired regression results have been shown in Table-5.
Table 5: World Economy, G-7 and BM.
Coefficient Std. Error t Statistic Prob.
G7 0,698130 0,032699 21,35023 0,0000 BRICSMATIK 0,184558 0,036094 5,113329 0,0000 c 0,605724 0,136357 4,442204 0,0000 R2 0,950279 Mean Dependent var 3,450980
Adj. R2 0,948207 F-statistic 458,6888
DW 0,877976 Prob (F-statistic) 0,000000
[image:6.612.74.529.505.591.2]267
Table 6: World Economy and countries
Coefficient Std. Error t Statistic
US 0,249737 0,053055 4,707167 Japan 0,077936 0,029342 2,656140 Germany 0,214027 0,040580 5,274180 France 0,003505 0,057305 0,061170 UK 0,149808 0,040216 3,725089 Italy 0,022673 0,047643 0,475892 Canada 0,036963 0,055483 0,666207 China -0,010273 0,020329 -0,505333 Brazil 0,045801 0,015440 2,966308 Russian 0,024992 0,008535 2,928272 India 0,038650 0,017188 2,248724 S. Africa 0,076757 0,032332 2,374048 Mexico -0,007301 0,017880 -0,408352 Argentina 0,007179 0,009885 0,726208 Turkey 0,021070 0,011618 1,813588 Indonesia 0,019735 0,021802 0,905189 Korea -0,017755 0,021780 -0,815202 c 0,561808 0,215313 2,609268
R2 0,983089 Mean Dependent var 3,035714
Adj. R2 0,971110 F-statistic 82,06994
DW 1,836960 Prob (F-statistic) 0,000000
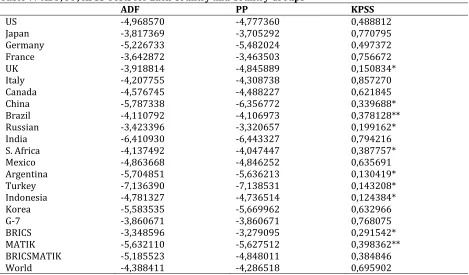
Table 7: ADF, PP, KPSS Tests for Each Country and Country Groups
ADF PP KPSS
US -4,968570 -4,777360 0,488812 Japan -3,817369 -3,705292 0,770795 Germany -5,226733 -5,482024 0,497372 France -3,642872 -3,463503 0,756672 UK -3,918814 -4,845889 0,150834* Italy -4,207755 -4,308738 0,857270 Canada -4,576745 -4,488227 0,621845 China -5,787338 -6,356772 0,339688* Brazil -4,110792 -4,106973 0,378128** Russian -3,423396 -3,320657 0,199162* India -6,410930 -6,443327 0,794216 S. Africa -4,137492 -4,047447 0,387757* Mexico -4,863668 -4,846252 0,635691 Argentina -5,704851 -5,636213 0,130419* Turkey -7,136390 -7,138531 0,143208* Indonesia -4,781327 -4,736514 0,124384* Korea -5,583535 -5,669962 0,632966 G-7 -3,860671 -3,860671 0,768075 BRICS -3,348596 -3,279095 0,291542* MATIK -5,632110 -5,627512 0,398362** BRICSMATIK -5,185523 -4,848011 0,384846 World -4,388411 -4,286518 0,695902
Note: MacKinnon Critical Values at 5% meaning level have been calculated as -2,921175 in ADF test for other
268
[image:8.612.74.534.212.455.2]According to regressions, the share and activity of G7 is still quite high for the world economy. However, the effect of developing country groups slowly increases. The most distinct reason of this originated from the average growth rates which are higher than the world average. As second and last stage of the time series analysis has been made. Principally, unit root test has been made for countries and country groups, and the acquired results have been given in Table-7 for three different tests. Series are constant from the same level, and according to their level values, they don’t include unit root. Therefore, they are useable for long termed analysis. Granger 2 staged cointegration test has been made for country groups. Accordingly, it is expected that the creating regressions are constant through the level values of error terms. If this hypothesis occurred, it may be concluded that two variables are cointegrated in the long term. The acquired results have been shown in Table-8.
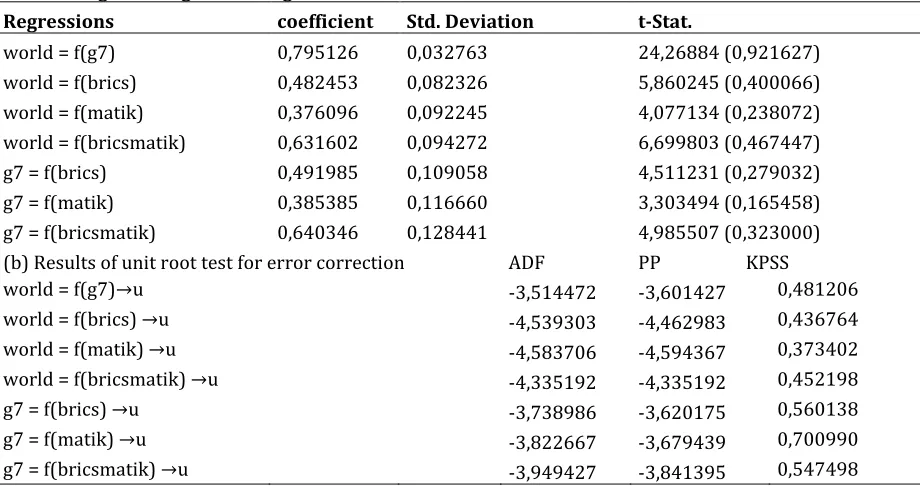
Table 8: Engle- Granger Co-Integration Test
(a) Regressions coefficient Std. Deviation t-Stat.
world = f(g7) 0,795126 0,032763 24,26884 (0,921627) world = f(brics) 0,482453 0,082326 5,860245 (0,400066) world = f(matik) 0,376096 0,092245 4,077134 (0,238072) world = f(bricsmatik) 0,631602 0,094272 6,699803 (0,467447) g7 = f(brics) 0,491985 0,109058 4,511231 (0,279032) g7 = f(matik) 0,385385 0,116660 3,303494 (0,165458) g7 = f(bricsmatik) 0,640346 0,128441 4,985507 (0,323000) (b) Results of unit root test for error correction ADF PP KPSS
world = f(g7)→u -3,514472 -3,601427 0,481206 world = f(brics) →u -4,539303 -4,462983 0,436764 world = f(matik) →u -4,583706 -4,594367 0,373402 world = f(bricsmatik) →u -4,335192 -4,335192 0,452198 g7 = f(brics) →u -3,738986 -3,620175 0,560138 g7 = f(matik) →u -3,822667 -3,679439 0,700990 g7 = f(bricsmatik) →u -3,949427 -3,841395 0,547498
Note: Critical Values at 5% meaning level in unit root tests are: MacKinnon critical value for ADF: 2,921175;
MacKinnon critical value for PP : -2,921175 and critical value for KPSS : 0,463000. Values at in brackets are critical values for 5% meaning level. T-stat in bracket beside fixed r2
The results belonging to unit root tests are presented for error terms of regressions in “a” panel for “b” panel of Table-8. Error terms are constant for each three unit root test, and include unit root. Therefore, it is concluded that there is a long term cointegrated between variable binaries for the regressions in “a” panel.
However, due to EG test isn’t enough for more than 2 variables, JJ test has been applied for more than 2
variables. While the world economy is a dependent variable, JJ test results that country groups are independent variables, are given in Table 9.
Table 9: The Results of Johansen- Juselius (JJ) Cointegration Test (5th Model)
H0 H1 Eigenvalue Trace Stat. 0,05 Max-Eigen Stat. 0,05
r = 0 r ≥ 1 0,474644 59,02384 55,24578 30,89663 30,81507 r = 1 r ≥ 2 0,264908 28,12721 35,01090 14,77245 24,25202 r = 2 r ≥ 3 0,206129 13,35476 18,39771 11,08006 17,14769
[image:8.612.73.540.596.659.2]269
hypothesis will be rejected for Max-Eigen Stat. > 0,05 meaningfulness critical value. Accordingly, it is concluded that H1 hypothesis will be accepted in the first line, and there is “maximal 1 cointegrated vector”.
5. Conclusion
Country and world economies have fluctuations that cannot mostly be doped and sometimes cause the structural changes. These fluctuations rise as domestic to economies on global scale like in 1929 and 1974, and it can also be raised from the noneconomic developments as World War 2. So, even if the fluctuations are domestic and external, they can leave the lasting impressions on economic structuring. In this study, it analyzed that depends on a political development on global scale created the differences in country economies in 1990, it affected world economy to what extent. These economies that are defined as the developing countries, and expand and make deep economic relations between each other, has begun quite effective in world economy. The most common known BRICS from these country groups have begun to be example for the developing countries.Forthisstudy, when MATIK countriesbeganto be integratedtoworldeconomy in 1990, theyhavesuccessedtocointegratewiththeworldeconomy in longterm.It has been seen that these country groups that shows a faster growth performance than the average growth rate of world economy, slowly increased their activities in the world economy growth rate. On the other hand, G7 countries have a lower average growth rate than neither the world economy or the growth rate of BRICS+MATIK countries. In the same time, it is seen that depth and width also increase in economic relations between G7 and BRICS+MATIK economies, and support the world economy. It is expected that developing countries have fast and effective growth process and integrated to world economy, it has reached that country group as G7 provide the help to the world economy in future years with its condition.Accordingtoregressions, theshareandactivity of G7 is stil quitehighforworldeconomy. However, the effect of developing country groups slowly increase. The most distinct reason of this arise originate that the average growth rates are higher than world average.
References
Aggarwal, R. (2011). Outward Foreign Direct Investments by The BRICS. Journal of Teaching in International Business, 22(4), 314-316. http://dx.doi.org/10.1080/08975930.2011.653912
Aggarwal, R. (2013). Adjusting to BRICs in Glass Houses: Replacing Obsolete Institutions and Business Models, Thunderbird International Business Review, 55(1), 37-54. http://dx.doi.org/10.1002/tie.21522
Aktan, B., Mandaci, P. E., Kopurlu, B. S. & Ersener, B. (2009). Behavior of Emerging Stock Markets in The Global Financial Meltdown: Evidence From BRIC-A. African Journal of Business Management, 3(7), 396-404. http://dx.doi.org/10.5897/AJBM09.121
Aloui, R., Aissa, M. S. B. & Nguyen, D. K. (2011). Global Financial Crisis, Extreme Interdependences, and Contagion Effects: The Role of Economic Structure? Journal of Banking & Finance, 35(1), 130-141. http://dx.doi.org/10.1016/j.jbankfin.2010.07.021
Ban, C. & Blyth, M. (2013). The BRICs and the Washington Consensus: An Introduction. Review of International Political Economy, 20(2), 241-255. http://dx.doi.org/10.1080/09692290.2013.779374
Bao, D. H. (2009). Usefulness of Financial Information in Evaluation of BRIC Firms. Advances in Accounting, Incorporating Advances in International Accounting, 25(2), 200-207. http://dx.doi.org/10.1016/j.adiac.2009.08.006
Becker, U. (2013). Measuring Change of Capitalist Varieties: Reflections and Method, Illustrations from the BRICs. New Political Economy, 18(4), 503-532. http://dx.doi.org/10.1080/13563467.2012.717611 Biggemann, S. & Fam, K. S. (2010). Business Marketing in BRIC Countries. Industrial Marketing Management,
40(1), 5-7. http://dx.doi.org/10.1016/j.indmarman.2010.09.004
Chang, H. L., Su, S. W., Zhu, M. N. & Liu, P. (2010). Long-Run Purchasing Power Parity and Asymmetric Adjustment in BRICSs. Applied Economics Letters, 17(11), 1083-1087. http://dx.doi.org/10.1080/00036840902817458
270
Das, K. C. (2013). Home Country Determinants of Outward FDI from Developing Countries. The Journal of Applied Economic Research, 7(1), 93-116. http://dx.doi.org/10.1177/0973801012466104
Gambhir, J. & Bhandari, J. (2011). Stock Markets: An Econometric Analysis. Asia pacific Business Review, 7(1), 102-110. http://dx.doi.org/10.1177/097324701100700107
Harrison, M. (1993). Soviet Economic Growth Since 1928: The Alternative Statistics of G. I. Khanin. Europe-Asia Studies, 45(1), 141-167.
Haq, Z. & Meilke, K. (2010). Do the BRICs and Emerging Markets Differ in their Agrifood Imports? Journal of Agricultural Economics, 61(1), 1-14. http://dx.doi.org/10.1111/j.1477-9552.2009.00229.x
Holtbrügge, D. & Kreppel, H. (2012). Determinants of Outward Foreign Direct Investment From BRICS Countries: An Explorative Study. International Journal of Emerging Markets, 7(1), 4-30. http://dx.doi.org/10.1108/17468801211197897
Jadhav, P. (2012). Determinants of Foreign Direct Investment in BRICS Economies: Analysis of Economic, Institutional and Political Factor. Social and Behavioral Sciences, 37, 5-14. http://dx.doi.org/10.1016/j.sbspro.2012.03.270
Khan, M. (2011). The Fall of The Wall, The Rise of The BRICs and The New Scramble for Africa. Foresight, 13(3), 38-49. http://dx.doi.org/10.1108/14636681111138758
Kaur, M., Yadav, S. S. & Gautam, V. (2013). Financial System development and Foreign Direct Investment: A Panel Data Study for BRIC Countries. Global Business Review, 14(4), 729-742. http://dx.doi.org/10.1177/0972150913501607
Keukeleire, S. & Hooijmaaijers, B. (2013).The BRICS and Other Emerging Power Alliances and Multilateral Organizations in the Asia-Pacific and the Global South: Challenges for the European Union and Its View on Multilateralism. Journal of Common Market Studies, 51, 1-18. http://dx.doi.org/10.1111/jcms.12102
Lotz, P., Chang, I. T. & Gupta, R. (2013). Causality Between Research Output and Economic Growth in BRICS.
Quality & Quantity, 47(6), http://dx.doi.org/10.1007/s11135-013-9980-8
Luckhurst, J. (2013). Building Cooperation Between the BRICS and Leading Industrialized States. Latin American Policy, 4(2), 251-268.
Mallick, S. K. & Sousa, R. M. (2013). Commodity Prices, Inflationary Pressures, and Monetary Policy: Evidence from BRICS Economies. Open Economies Review, 24(4), 677-694. http://dx.doi.org/ 10.1007/s11079-012-9261-5
Manamperi, N. (2014). The Short and Long-run Dynamics Between Inflation and Economic Growth in BRICS.
Applied Economics Letters, 21(2), 140-145. http://dx.doi.org/10.1080/13504851.2013.844318 Pillania, R. K. (2009).Competitiveness and Emerging Markets. Business Strategy Series, 10(2), 90-95.
http://dx.doi.org/10.1108/17515630910942214
Samake, I. & Yang, Y. (2014). Low-Income Countries’ Linkages to BRICS: Are There Growth Spillovers? Journal of Asian Economies, 30(1), 1-14. http://dx.doi.org/10.1016/j.asieco.2013.09.002
Schrooten, M. (2011). Brazil, Russia, India, China and South Africa: Strong Economic Growth-Major Challenges. DIW Economic Bulletin, 4, 18-22.
Schmalz, S. & Ebenau, M. (2012).After Neoliberalism? Brazil, India, and China in the Global Economic Crisis. Globalization, 9(4), 487-501. http://dx.doi.org/10.1080/14747731.2012.699917
Singh, S. (2013). Future of Golden BRICS, Strategic Analysis. 37(4), 393-397. http://dx.doi.org/10.1080/09700161.2013.802513
Stone, H. B. J. & Ranchhod, A. (2006). Competitive Advantage of a Nation in The Global Arena: A Quantitative
Advancement to Porter’s Diamond Applied to The UK, USA and BRIC Nations. Strategic Change, 15(6), 283-294. http://dx.doi.org/10.1002/jsc.770
Vries, G. J., Erumban, A. A., Timmer, M. P., Voskoboynikov, I. & Wu, H. X. (2012). Deconstructing the BRICs: Structural Transformation and Aggregate Productivity Growth. Journal of Comparative Economics, 40(2), 211-227. http://dx.doi.org/10.1016/j.jce.2012.02.004
Wang, Y. & Ying, J. L. (2014). How do the BRIC Countries Play Their Roles in the Global Innovation Arena? A Study Based on USPTO Patents During 1990-2009. Scientometrics, 98(2), 1065-1083. http://dx.doi.org/10.1007/s11192-013-1141-2
271
Zhang, B., Li, X. & Yu, H. (2013). Has Recent Financial Crisis Changed Permanently The Correlations Between BRICS and Developed Stock Markets? North American Journal of Economics and Finance, 26(1), 725-738. http://dx.doi.org/10.1016/j.najef.2013.05.003
Appendix
-4 -2 0 2 4 6 8
1962 1964 1966 1968 1970 1972 1974 1976 1978 1980 1982 1984 1986 1988 1990 1992 1994 1996 1998 2000 2002 2004 2006 2008 2010 2012
World
-6.0 -4.0 -2.0 0.0 2.0 4.0 6.0 8.0
1962 1964 1966 1968 1970 1972 1974 1976 1978 1980 1982 1984 1986 1988 1990 1992 1994 1996 1998 2000 2002 2004 2006 2008 2010 2012
G-7
-4.0 -2.0 0.0 2.0 4.0 6.0 8.0 10.0
1962 1964 1966 1968 1970 1972 1974 1976 1978 1980 1982 1984 1986 1988 1990 1992 1994 1996 1998 2000 2002 2004 2006 2008 2010 2012
2
7
2
-4.0 -2.0 0.0 2.0 4.0 6.0 8.0 10.0
1962 1964 1966 1968 1970 1972 1974 1976 1978 1980 1982 1984 1986 1988 1990 1992 1994 1996 1998 2000 2002 2004 2006 2008 2010 2012
M
A
T
IK
-2.00 0.00 2.00 4.00 6.00 8.00
1962 1964 1966 1968 1970 1972 1974 1976 1978 1980 1982 1984 1986 1988 1990 1992 1994 1996 1998 2000 2002 2004 2006 2008 2010 2012
BR
ICSM
A
T
IK
-6 -4 -2 0 2 4 6 8 10