Munich Personal RePEc Archive
Cost-effectiveness analysis in reducing
nutrient loading in Baltic and Black Seas:
A review
Halkos, George
University of Thessaly
November 2013
George Halkos and Georgia Galani
Laboratory of Operations Research
Department of Economics, University of Thessaly
Abstract
Eutrophication represents a global environmental pressure that necessitates international co operation and the diffusion of information to avoid information asymmetries, the construction of an appropriate legislative framework, the development of monitoring technologies and scientific research to provide the evidence base for any policy interventions. The health condition of the Baltic and Black Seas has deteriorated over a long period due to increases in nutrient inputs from anthropogenic and non anthropogenic sources. The current report aims at providing a review of the literature and defining the possible gaps concerning (1) the attempts at regulatory intervention to address the problem of eutrophication in the Baltic and Black Seas, (2) the methodological issues in constructing a cost effectiveness analysis, (3) the available applications of cost effectiveness studies conducted and (4) the uncertainties and risks entailed in the cost effectiveness studies.
: Eutrophication; cost effectiveness analysis; abatement measures; nutrient loading; Baltic Sea; Black Sea.
: Q00; Q01; Q25; Q50; Q53.
This review was carried out in the framework of ODEMM project, which was funded by a grant from the EU under the 7th Framework Programme.
1. Introduction
Nutrient loading corresponds to the amount of nitrogen (N) or phosphorus (P) coming into the water in a specific time period from groundwater or from the air as wet (rain, or snow) or dry depositions. Although some level of nutrient loading can be beneficial to the health of natural ecosystems (for primary production), excess amounts adversely affect ecosystem state and potentially can affect public health (van Buuren et al., 2002). Nutrient enrichment contributes to oxygen depletion and increases the population blooms of toxic algae (Wulff et al., 2001). Camargo and Alonso (2006) and Smith (2003) summarise the ecological and toxicological effects of eutrophication in aquatic systems which include the deterioration of water transparency and light availability, the sedimentation of organic matter and oxygen depletion in bottom waters. Nutrient loading also affects productivity and species composition.
Anthropogenic sources of nutrient loading mainly derive from various agricultural, industrial and urban activities. Pollution can be categorized as point and non point source pollution. The latter can include runoff into water bodies from a range of agricultural land and construction sites, as well as atmospheric deposition. The outflow of nutrients from a catchment depends on specific water discharge, soil type, land use, catchment slope, population density, (Meybeck, 1993). The major nitrogen input contributor has been estimated to be the agricultural sector diffusing about 80% of the total load (HELCOM 2004, 2009).
result it has been suggested that US States adopt numeric nutrient standards relying on three basic features (USEPA, 2012):
(i) the uses of water bodies for activities such as fishing, recreation, ;
(ii) the specific level of pollutants that cumulatively do not affect the assimilative capacity of the water bodies (i.e. a threshold constraint); and
(iii) the defined measures and policies that provide protection and sustainable management of the quality of waters.
The structure of the current report is the following. First, the methodological issues to construct a cost effectiveness analysis are addressed. Next, a review of the existing relevant literature concerning the regulatory intervention to address the problem of eutrophication in the Baltic and Black Seas is presented. Moreover, the available cost effectiveness studies conducted are summarized and finally the potential uncertainties and risks entailed in the cost effectiveness studies are discussed.
2. Methodological issues in applying cost-effectiveness analysis
Cost effectiveness analysis can be applied both as ex ante and ex post evaluation tools. As an ex ante tool, it focuses on the investigation of the most cost effective solution for a given resource reduction target. Policy makers try to introduce and implement a concrete and consistent policy to achieve the desirable emission reduction. After determining an objective quantified in physical terms, a CEA finds the least cost measure (or series of measures) for achieving the resource reduction targets. If applied as an ex post valuation tool, policy makers can address the question of how far objectives have been achieved and at what cost.
In general terms the fundamental building blocks required to apply the CEA methodology include a comprehensive review of the potential impacts of the abatement options (expressed in non monetary units), a prediction of the likely effectiveness of measures and an assessment of the costs of alternative options that are measured in monetary terms (Balana et al., 2011).
2.1 Applications
Different approaches are used to conduct a cost effectiveness analysis. Most of these approaches rely on basic types of mathematical programming like linear programming (LP), non linear programming (NLP) and integer programming (IP) model formulations. Optimization is one of the common features that mathematical programming models involve. The basic elements of the mathematical programming model include the decision variables, the constraint function(s), the bounds such as non negativity and the objective function. Ιt is important to build the objective function that includes the quantity that we wish to maximize or minimize (Williams, 2013). Specifically CEA can be based either on minimization of costs given a determined environmental target or on maximization of benefits given a specific budget frame (Balana et al., 2011).
environmental sustainability of certain irrigated farming systems in Italy. Fröschl et al. (2008) using a linear optimization model evaluated selected measures in agricultural production to reduce nitrogen loads in the water bodies of Austria, Bulgaria, Hungary and Romania.
Concerning integer programming (IP) models, Messer (2006) used a binary linear programming where the integers are limited to zero or one in order to estimate the maximum conservation benefits for a land acquisition effort. Börjesson & Ahlgren (2012) applied a bottom up partial equilibrium optimization model based on MARKAL. The techno economic features of the study are represented by a mixed integer linear programming (MILP) model. The study focuses on investigating the least cost utilization levels to tackle with the increased use of biogas. Moreover, in Europe several tools for sustainable management of water resources have been applied. The Environmental Costing Model (EnCM) is designed to find the most cost effective measures under the Water Framework Directive (WFD) by means of mixed integer programming. Surface water target pollutants include chemical oxygen, nitrogen and phosphorus (Wustenberghs et al., 2008).
reduce nonpoint source and water pollution resulting from agricultural activities. Panagopoulos et al. (2011) investigated the most cost effective solutions to reduce sediments such as nitrates, nitrogen and phosphorus to surface waters using SWAT model. Lescot et al. (2013) proposed a methodological framework for spatially distributed cost effectiveness analysis to compare various agro environmental measures to control pesticide pollution in surface waters. Various other studies use SWAT for impact assessment (Chaplot et al., 2004; Arabi et al., 2006; Bracmort et al., 2006; Gassman et al., 2006; Santhi et al., 2006; Tong and Naramngam 2007; Nendel, 2009; Pandey et al., 2009; Sahu and Gu 2009; Volk et al., 2009; Douglas Mankin et al., 2010; Glavan et al., 2011; Rabotyagov et al., 2010; Rossi et al., 2012; Kaini et al., 2012; Baker & Miller, 2013).
include hydro economic modeling (Gómez Limón and Riesgo, 2004; Pulido Velázquez et al., 2008; Volk et al., 2008; Brouwer et al. 2008; Maneta et al., 2009; Varela Ortega et al., 2011; Blanco Gutiérrez et al., 2013).
The stochastic nature of many factors such as temperature, climate, soil, nitrogen cycle and generally the complexity of interactions between economic, agronomic and hydrologic systemς, suggest that management policies cannot be accurate and well predicted. However, if we do not take into consideration the uncertainty in a model, this could lead to unreliable results. McSweeny and Shortle (1990) applied cost effectiveness analysis to include uncertainty by the alternative policies. Bystrom et al. (2000) tried to take into account uncertainty of controlling nitrate pollution in wetlands. Lacroix et al. (2005) used a bio physical model to evaluate the probabilistic cost effectiveness of farm management practices to reduce nitrate pollution. Berbel et al. (2011) proposed a methodological approach including uncertainty for cost effective measures in the context of the EU Water Framework Directive (WFD). Other studies incorporating uncertainty in the structure of the model is the ones of Elofsson (2003) and Gren et al. (2000, 2002).
various other methods like Monte Carlo (MC), bootstrap, discrete Bayes, neural network and fuzzy mathematical technique (Qin et al., 2007; Savic & Walters, 1997; Wen & Lee, 1998; Barton et al., 2008; Brouwer & De Blois, 2008; Wu et al., 2006).
As concerns the non linear nature of cost effectiveness analysis there are numerous studies that have been applied in the field of environmental economics. Bio economic modelling combines biophysical and economic processes. Semaan et al. (2007) used an approach that combines a biophysical model and a mathematical programming model in order to develop a bio economic model to analyze the effects of agricultural policies on farmer’s profits and nitrate leaching system. Mouratiadou et al. (2010), by selecting cost effective measures to regulate agricultural water pollution to conform to the Water Framework Directive, applied a bio economic modelling approach to explore the water quality and economic effects of the 2003 Common Agricultural Policy Reform. Schou et al. (2000) integrated economic and environmental modelling to analyze policies in terms of their cost effectiveness for Danish agriculture. Brady (2003) has evaluated the relative cost efficiency of agricultural policy using a spatially distributed nonlinear programming model. Yang et al. (2003) under the framework of a program to reduce sediment loading in the Illinois River investigated the cost effective alternatives using a non linear programming model. Schuler and Sattler (2010) showed how a bio economic model can be applied to estimate the cost effective solutions on agriculture and the risk of soil erosion.
stakeholders to contribute in establishing the environmental and socio economic criteria of the optimisation (Bouraoui & Grizzetti, 2013).
2.2 Marginal Abatement Cost Curves
Marginal Abatement Cost (MAC) curves represent a standard policy tool to assess the economics of complex environmental issues (Kesicki and Strachan, 2011). MAC curves have been developed to illustrate the costs associated with emissions abatement like in the case of sulphur or carbon dioxide emissions and to determine the optimal level of pollution control. The construction of abatement cost curves increases the environmental awareness of firms in terms of giving insight into the most cost efficient measures to abate emissions (Beaumont and Tinch, 2004; McKintrick, 1999).
MAC curves adopt various shapes as a result of variations in inter and intra sectoral options for mitigation and also on the time horizon which is selected (Kesicki, 2010). There are various methods to construct an abatement cost curve. Initially a simplified method is to construct a supply abatement curve or else a “savings curve”. According to Jackson (1991), Naucler and Enkvist (2009) and Kesicki (2010) a supply curve combines the supply side options for meeting the pollutants’ reduction target. The most cost effective options appear at the far left of the MAC curve and vice versa as it can be seen in Figure 1. Each step of this stepwise curve represents one option being applied in isolation (for details see Halkos 1993, 1995, 1996a, b, 2010).
The height of each bar represents the cost in $ per unit of pollutant abated (e.g. 1 tonne CO2 equivalent) and the width refers to the magnitude of the possible abatement
include positive costs but also negative costs. The abatement options with negative costs are defined in the literature as ‘no regrets’ mitigation options (Metz, 2007).
Cost effective options in a MACC curve
Source: Kesicki and Strachan (2011)
The existence of negative costs means that society would benefit from the specified mitigation actions even if there was no benefit from the abatement (in terms of reductions in morbidity/mortality, ). In a the value to society of the benefit of (in this case) reducing emissions by one Mt CO2 would be put
side by side with the marginal abatement costs. If the estimates of these social benefits were (say) $100/t CO2 then all measures that had a marginal abatement cost of $100/t
CO2 would satisfy the cost benefit criterion of efficiency, i.e. broadly speaking it would
be optimal in economic terms to adopt such measures. The same principle can be carried forward to the economic analysis of nutrient loading reductions.
Ideally, data is available on total costs of alternative reductions levels where total cost includes the net abatement cost at the source and the distribution of impacts on the economy. A more thorough analysis can be carried out when there are several abatement options and different locations with different social, economic and environmental characteristics.
3. Regulation to reduce nutrient loading
Eutrophication is one of the key pressures on the health of estuarine, coastal and marine ecosystems all over the world. According to OSPAR (2008, p. 107) and to European Community (1991) legislation, marine eutrophication is defined as ‘‘the enrichment of water by nutrients causing an accelerated growth of algae and higher forms of plant life to produce an undesirable disturbance to the balance of organisms present in the water and to the quality of the water concerned, and therefore refers to the undesirable effects resulting from anthropogenic enrichment by nutrients”.
There is a host of regulations that pertain to reduce nutrient loading. For the purposes of the current review, the focus is on the Baltic Sea (section 3.1) and the Black Sea (section 3.2). These sections do not focus on the specific regulations per se but rather on the or legislative framework that supports the application of legislative interventions in these two specific regional seas.
3.1 Baltic Sea legislative framework
water passage through the narrow Danish Straits and Sound areas linking the Baltic to the North Sea is a key reason for the sensitivity of the Baltic Sea to eutrophication because of the slow renewal of oxygen in deeper basins (Bendtsen et al., 2009).
Moreover, we have vertical stratification that averts oxygenation of the bottom waters and sediments of the water masses which is a consequence of the large inflow of freshwater from the catchment area surrounding the Baltic, including many rivers. As a result, significant quantities of phosphorus are accumulating in the aquatic area (HELCOM, 2009). Between 1955 1990 the annual atmospheric deposition of dissolved inorganic nitrogen doubled and now represents about a quarter of the total N input to the Baltic Sea which has contributed to an increase of water nutrients input (Danielsson et al., 2008). There is a well developed agricultural sector and other human activities including fossil fuel combustion from energy production and transport that contribute to significant nutrient loading (HELCOM, 2009).
As it is depicted in Figure 2, the Bothnian Bay and the Swedish parts of the north eastern Kattegat do not face the problem of eutrophication; the open waters of all other basins are classified as ‘affected by eutrophication’. This is related to the increase in chlorophyll concentrations1. Neva, the largest river in the Baltic Sea, significantly affects the Gulf of Finland; the Gulf of Riga is strongly affected by the river Daugava and the city of Riga.
1
: Classification of eutrophication status
Source: HELCOM (2009)
reduce pollution from human activities. In 1992 a new Convention was signed by all the states bordering the Baltic Sea. The recommendations of the Convention include those affecting both inland and marine waters. The Helsinki Convention came into force in January 2000 and the latest amendments came into force in November 2008.
HELCOM achieved noticeable improvements in abating pollution and protecting the marine environment for instance a 40% reduction in nitrogen and phosphorus discharges in total since the late 1980s (HELCOM, 2008). There still remain many environmental problems to be solved. Regarding inputs of nutrients which are responsible for eutrophication, one of the main objectives of the HELCOM Baltic Sea Action Plan is to reduce phosphorous discharges by around 42% and nitrogen discharges by around 18% by 2021. The Baltic Sea Action Plan was adopted in 2007 and its priority is to re establish the good ecological status of the Baltic marine environment by 2021 and to combat the continuing deterioration of the marine environment resulting from human activities (HELCOM, 2008).
Plan establishes, targets for ‘good ecological statuses are being set and the exact actions needed in order to attain the targets (HELCOM, 2013).
Politicians at various forums and regions have already supported the HELCOM Baltic Sea Action Plan as it is a contribution to the successful implementation of the proposed plans in the region. Specifically, the EU Marine Strategy Directive expects the realization of such a plan by each and every Member State, so the HELCOM innovative action plan serves as a model example to be adopted by the Regional Seas Conventions and Action Plans, given the support of the United Nations Environment Programme. However, the European Union lately has turned into the most central institutional framework for addressing several cross border policy issues including the eutrophication in the Baltic Sea region (Kern and Löffelsend 2008).
The transnational character of eutrophication in the Baltic Sea has led to the adoption of a European strategy for the Baltic Sea Region (EUSBSR) in 2009. The top priority is to address the problem and act in cooperation with all Member States. Specifically EUSBSR aims at organizing new projects and initiatives, creating a sense of common responsibility (European Commission, 2010).
The PURE project aims at the enhancement of phosphorus removal at selected municipal wastewater treatment plants in the Baltic Sea region, assessing cost effectiveness while PRESTO is a flagship project based on the finding of the PURE project, focusing on improving the waste water treatment of plants in Belarus. Aquaculture is another domain that poses a threat to water quality in terms of increasing nutrient loads. The AQUABEST project develops spatial planning guidelines to contribute to the creation of sustainable aquaculture.
There are also more projects related directly or indirectly with the eutrophication in the Baltic Sea such as the Assessment of Implication of Different Policy Scenarios on Nutrient Inputs (2005 2006) and the BALTHAZAR project (2009 2012) that promoted the protection of the Baltic Sea from hazardous waste and agricultural nutrient loadings. The HELCOM EUTRO developed assessment tools for the harmonization of eutrophication criteria and measures including the establishment of reference conditions for different parts of the Baltic Sea (HELCOM, 2011).
3.2 Black Sea Legislative Framework
!: Eutrophication levels in the Black Sea
Source: Borysova et al. (2005)
Enrichment of the water bodies by nitrogen and phosphorus discharges come from municipal, industrial and agricultural sources that represent the most significant sources of ecological degradation of the Black Sea (Glibert & Burkholder, 2006). The total nitrogen inputs in the 1990s are approximately more than six times higher than the nitrogen input to the Baltic Sea and more than twice the inputs to the North Sea (Artioli et al., 2008). Moreover, pollution of water bodies, and particularly the Danube, has caused significant damage to riparian regions through reduced profits from tourism and fisheries, loss of biodiversity and increased water borne diseases.
Russia, 1% from Georgia, 12% from Turkey and 26% from the remaining countries; this is presented in Figure 5.
There have been some attempts at regional cooperation that have had a limited effect on the ground. These include Varna Fisheries Agreement signed in 1959 by Bulgaria, Romania and the former USSR; Bulgaria, Romania and Turkey cooperated in the General Fisheries Council for the Mediterranean Sea. Another attempt aiming at environmental protection was the MARPOL Convention of 1973 (Aydin, 2005). It was designed to reduce pollution of the seas and to preserve the marine environment and the minimization of accidental discharge of hazardous substances.
": Proportion of nitrogen flows
#: Proportion of phosphorous flows
Source: Authors’ calculation following Topping et al. (1998)
and (iv) The Black Sea Biodiversity and Landscape Conservation Protocol. The main objective of the Contracting Parties is to prevent pollution by hazardous substances, land based sources, wastes from vessels and emergency situations. Another objective is to prevent the pollution from the atmosphere and generally to provide framework for scientific and technical co operation and monitoring activities (Borysova et. al., 2005; BSC 2009; EEA 2005; EEA 2006; Artioli et. al., 2008)
In 1996 the Strategic Action Plan for the Rehabilitation and Protection of the Black Sea was adopted. The target of the Strategic Action Plan is to achieve sustainable development in the Black Sea region. Specifically, it aims at enhancing the environmental health of the Black Sea and sustainable activities such as fishing, aquaculture and tourism in all the Black Sea countries. The Transboundary Diagnostic Analysis (TDA), which is a technical annex to this Strategic Action Plan, concludes that the Danube River is responsible for most of the nutrient input to the Black Sea.
In 2010, the European Union launched the Black Sea Environmental Partnership in order to develop sustainable regional measures needed to preserve biodiversity, marine and coastal ecosystems, to promote river basin management, to tackle pollution sources and promote environmental integration, monitoring, research and eco innovation (EEA, 2010).
countries. The GEF funds various projects related to biodiversity, climate change, international waters, land degradation, the ozone layer and persistent organic pollutants to improve the global environment. Additionally, ‘GEF River Danube Pollution Reduction Programme (GEF RDPRP)’ aims at developing new strategies for reducing pollution, including nutrients in the entire Danube Basin (Topping et al., 1998).
Another approach towards international cooperation concerning environmental issues is the International Commission for the Protection of the Danube River (ICPDR) that consists of 14 cooperating states and the European Union. It was established in 1998 to deal with the whole Danube River Basin, which includes its tributaries and ground water resources. Water quality is one of the issues that ICPDR addresses and as regards eutrophication is in charge of nutrient load allocation (ICPDR ICPBS, 1999). Moreover, the TransNational Monitoring Network (TNMN) was developed to assess trends in water quality and to monitor physical, chemical and biological conditions in the Danube and its major tributaries.
automated systems for monitoring eutrophication in the Black Sea region (DiMento & Hickman, 2012).
Lately, the 2012 Blueprint to Safeguard Europe’s Water Resources under the European Commission was adopted. The sectors of main priorities for the preservation of water quality are agriculture and energy. This conclusion for Europe follows the findings of the 2009 River Basin Management Plan for the Danube, where hydropower generation, overexploitation of water bodies and diffuse pollution from the agricultural sector have been noted as being serious pressures. Moreover, the preservation of water quality has been addressed by the Scientific Support to the European Union Strategy for the Danube Region (European Commission, 2012).
4. Review of cost-effectiveness analysis studies
4.1 Baltic Sea
regions and 15 different types of abatement measures for nitrogen and phosphorus emissions in the domain of agriculture, sewage treatment plants, energy and transportation.
Generally, the nutrient loads abatement measures include three types of measures: (i) measures aimed at reducing the nutrient emissions transported by water streams, (ii) Land use change and
(iii) Measures reducing the extent of nutrient contamination of coastal waters by increasing the nutrient retention on land.
50% in a cost effective way. Simultaneously, measures for phosphorus at wastewater treatment plants account for two thirds of the reductions (Gren et al., 1997).
Gren (2008) analyses and compares the costs of two strategies against transboundary water pollution mitigation and adaptation measures using a chance constrained programming. The comparison of the two international policies such as cooperation and national uniform standards shows that mitigation under non cooperative uniform national standards can be increased when considering stochastic pollution and linkage in risk between mitigation and adaptation measures.
HELCOM and NEFCO (2007) report addresses the costs and effects of abatement measures against eutrophication in the Baltic Sea and the impact of these measures for policy scenarios recommended by the BSAP. The study includes all countries adjacent to the sea and measures for nitrogen and phosphorus reduction are related to waste water treatment, livestock reductions, improved manure management, conversion of agricultural land into grassland, catch crops, reduced fertilizer use and NOx reductions for stationary combustion sources, heavy vehicles and ships. Calculations demonstrate that the scenario that would reduce nitrogen loads by 106 kton and phosphorus loads by 13 ktons costs nearly €3.42 billion per year. The study sheds light into the most cost effective measures that are reductions of NOx emissions from shipping, catch crops, fertilizer reductions and a ban on phosphate detergents.
to the achievement of abatement measure which is significantly more cost effective than it would be without the stochasticity.
Updating the data used in the study of Elofsson (2003), Schou et al. (2006) develop a similar cost effectiveness model for 24 regions adjacent to the Baltic Sea. The measures incorporated in the revised model include wetland restoration measures, reduced fertilizer use, introduction of catch crops and livestock reduction in agriculture, sewage treatment measures, NOX reduction and blank measures that are applied in the
model to enable updates of the model by insertion of more measures. All measures are assumed to be independent concerning the environmental impact on the Baltic Sea. The total cost of reducing nitrogen pollution to the Baltic Sea by approximately 160 kton is estimated at €940.68 million.
emissions. Meeting the BSAP emission reduction targets for Sweden would require higher total costs compared to the current cost effective national target. It is obvious that the BSAP target cannot be achieved with the current annual budget for nitrogen and phosphorus emission abatement measures in Sweden.
As far as the benefits of the abatement of the eutrophication, Ahtiainen et al. (2012) in a sample of 10564 respondents inquired the willingness to pay (WTP) for reducing eutrophication in the Baltic Sea. They found that the shares of respondents willing to pay for two eutrophication reduction programs were highest in Sweden and Finland and lowest in Russia. These percentages are presented in Table 1. Specifically, willingness to pay was calculated first over half of Baltic Sea Action Plan (BSAP) targets, then altogether and then either of the two programs with the number of respondents per country shown in the last column.
$ % : Percentages of respondents’ WTP Share WTP
for ½ BSAP (%)
Share WTP for BSAP (%)
Share WTP for either of both programs (%)
N of respondents
Denmark 54 53.7 54.9 1061
Estonia 53.9 56.4 58 505
Finland 62.1 63 63.4 1645
Germany 54.7 56.2 56.5 1495
Latvia 49.1 49.8 50.1 701
Lithuania 54.1 55.1 55.1 617
Poland 54.3 55 55.6 2029
Sweden 74.1 74.6 75.4 1003
Russia 31.1 32.2 32.4 1508
Overall
average 53.7 54.6 55.2 10564
The total WTP for attaining the ½BSAP and BSAP scenarios equals to €3090 m and €4120 m respectively. It is worth mentioning that large differences between WTP in the countries considered is observed, with mean WTP per person in Sweden to be the highest and the one corresponding to Latvia to be the lowest. Comparing these findings with previous estimates of the benefits of reduced eutrophication in the Baltic Sea (e.g. SEPA 2008), the current findings show a lower total WTP is justified mainly from the use of primary valuation instead of benefit transfer.
Moreover, there are differences in the valuation scenarios. In Ahtiainen et al. (2012) the enhancement of the environmental status in the Baltic Sea differs from the sea basins and good status is not attained everywhere; whereas in the Baltic Drainage Basin Project (BDBP) the eutrophication level was expected to be reduced to a sustainable level (Söderqvist, 1996; Gren et al., 1997b; Turner et al., 1999; Markowska & Zylicz, 1999). At the same time, the time frame to achieve environmental changes differs from 40 years in Ahtiainen et al. (2012) to 20 years in the BDBP study.
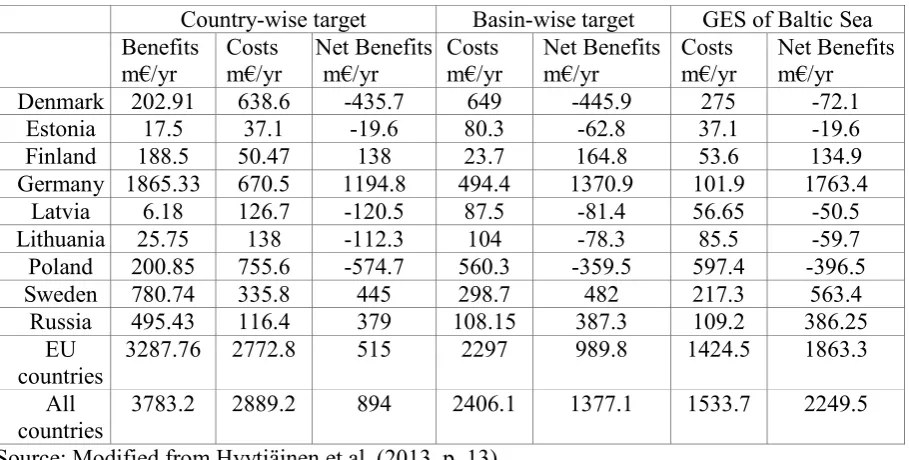
BSAP should be continued. Table 2 presents the costs and benefits of attaining BSAP nutrient load reduction targets for each riparian EU country as well as Russia and in terms of country wise and basin wise constraints for nutrient loads as well as the setting as constraint of the Good Environment Status (GES) of the Baltic Sea.
[image:30.595.90.545.466.696.2]Taking into account that the abatement measures are planned cost effectively Table 2 depicts that the net benefits in million € (in 2012 constant prices) per annum are equal to 894, 1377.1 and 2249.5 in terms of country wise, basin wise and the Good Environment Status (GES) of the Baltic Sea constraints respectively. According to Hyytiäinen et al. (2008) important factors influencing the profitability of investment in control measures are the costs of the best nutrient abatement actions, the effectiveness of nutrient control of seawater quality as well as the proportion of the population benefitting from the improved environment in terms of ecosystem and recreational activities.
$ % : Costs and benefits of attaining BSAP nutrient load reduction
Country wise target Basin wise target GES of Baltic Sea Benefits m€/yr Costs m€/yr Net Benefits m€/yr Costs m€/yr Net Benefits m€/yr Costs m€/yr Net Benefits m€/yr Denmark 202.91 638.6 435.7 649 445.9 275 72.1
Estonia 17.5 37.1 19.6 80.3 62.8 37.1 19.6 Finland 188.5 50.47 138 23.7 164.8 53.6 134.9 Germany 1865.33 670.5 1194.8 494.4 1370.9 101.9 1763.4
Latvia 6.18 126.7 120.5 87.5 81.4 56.65 50.5 Lithuania 25.75 138 112.3 104 78.3 85.5 59.7 Poland 200.85 755.6 574.7 560.3 359.5 597.4 396.5 Sweden 780.74 335.8 445 298.7 482 217.3 563.4
Russia 495.43 116.4 379 108.15 387.3 109.2 386.25 EU
countries
3287.76 2772.8 515 2297 989.8 1424.5 1863.3 All
countries
Ahlvik et al. (2013) and Hasler et al. (2012) investigated the costs of a reduced eutrophication in the Baltic Sea under the BSAP targets using different data sources. The results are still comparable and reveal that if all measures included in Ahlvik et al. (2013) were implemented to their full capacity, the annual amount of load reduction in the Baltic Sea would be 248,377 tons of nitrogen and 16,731 tons of phosphorus. Similarly, if all measures in Hasler et al. (2012) were implemented to their full capacity the annual load reduction to the Baltic Sea would be 214,292 tons of nitrogen and 12,500 tons of phosphorus. That variation can, partially, be explained by the application of the measures adopted in wetland, fertilizer and livestock reduction.
Studies investigating cost effectiveness of agricultural nutrient reductions in the Baltic basin include Ollikainen and Honkatukia (2001), Gren (2001) and Eloffson (1997) who compare cost effective policies with the target of 50% reduction in nitrogen and phosphorus to the Baltic Sea. The aforementioned studies include all countries adjacent to the sea. The results show that a nitrogen reduction by 429 kton would amount to €152,550 million provided that reductions are comparable to all countries. Similarly phosphorus reduction by 35 kton would cost almost €12.15 billion. However, cost effective measures correspond to €20,520 million for nitrogen and €1,215 million for phosphorus.
Iho (2005) develops a model to investigate the cost effective allocation of three measures to reduce phosphorus load. In the Southwestern Finland, Helin et al. (2008) studied abatement costs for agricultural nitrogen and phosphorus loads from agriculture. Nutrient reduction costs are evaluated under the Common Agricultural Policy reform (CAP) in the Uusimaa and Varsinais Suomi provinces in Southern Finland. Results show that a 50% reduction in agricultural nitrogen load would cost €27.4 to €30.7 million or €2188.5 to €2410 per farm. Hyytiäinen et al. (2008) introduce a stochastic simulation model that integrates nutrient dynamics of nitrogen and phosphorus in arable land of Finland. The results indicate that investments in reducing the nutrient load from arable land in Finland would become profitable only if the neighbouring countries in the northern Baltic committed themselves to similar reductions.
nitrogen and phosphorus was considered. The results show that advisory service should be taken into account as a low cost measure. That cost effectiveness solution is of great importance for policymakers with the objective to reach agreed reduction targets at minimal costs.
4.2 Black Sea
Borysova et al. (2005) provide the first economic assessment of the damage caused by eutrophication in the catchment of Ukraine. The study tried to investigate the costs of legislation compliance due to nutrient enrichment. The results show that the total value of the economic damage resulting from eutrophication, for the 5 studied regions in Ukraine is €14.88 million per year and there is a need to tackle the problem on a national, regional and/or international level.
Fröschl et al. (2008) carried out a cost effectiveness study to rank the alternative policies that reduce emissions derived mainly from the agricultural sector of the Danube River. Countries involved in the study were Austria, Bulgaria, Hungary and Romania. The four alternative measures to be implemented include the reduction in fertilizer use by 10%, the reduction of ammonia emissions from manure by 25%, increase plant productivity in Austria by 10% and in the other three countries by 20%, a reduction of erosion by 75% and surface run off by 20%. The reference scenario was to accomplish the reduction targets by 2015. The measures are assessed empirically using a linear optimization model to find the best combination of measures that minimize the total costs of nitrogen pollution.
maximum nitrogen emission reduction of the four countries amounts to 18,000 tonnes per annum and costs €1,107.97 million yearly. The cost effective solution in Austria and Hungary is the increasement in plant productivity by applying capital intensive production techniques, in Austria by 10% and in the other three countries by 20%. These techniques include irrigation systems that are tailored to different zone’s climate and soil consistency, plant protection against various insects and weeds and improvements in plant nutrition. The most cost effective measure for Bulgaria and Romania is the reduction of ammonia emissions from manure by 25%. In the case of effective international cooperation the total cost of the reduction target of 14,809.5 tonnes per year was negative and equal to 98.73 million € (Behrendt et al., 2002).
One of the tasks of UNDP GEF Black Sea Ecosystem Recovery Project is to investigate cost effective measures to minimize nutrient pollution. Dworak et al. (2008) established the methodological framework of the task aiming at introducing policy makers in the Black Sea countries to basic cost effectiveness assessment approaches along with identifying the vital data required to carry out the assessment of measures for monitoring and controlling sources of nutrient pollution. The approach includes three sectors that provide the major contribution of nutrient pollution in the Black Sea agricultural, municipal and industrial. Bonham (2006) conducted an indirect study related to the nutrient pollution in the Black Sea. Specifically, Bonham addresses cost effective measures to reduce groundwater nitrate N pollution from agriculture sector using an integrated biophysical simulation model and farm economic optimization.
$ % ! Summary of cost effectiveness studies Allocation of costs of abatement measures and nutrients reduction in Baltic and Black Seas
& ' ()
*
+ & , +
$ -' . /( $ , ' . /( $ ' -( $ ' ,( *
Sewage treatment plants
< 417.6 835.2 109 200 12 950
Agricultural deposition of
fertilizers and manure < 417.6 < 208.8 109 200 1 850 1 Gren et al.
(1997a) 14 drainage basins surrounding the Baltic Sea Linear cost functions Nitrogen and Phosphorus loads
Restoration of wetlands < 417,6 208.8 109 200 3 700
0 50% reduction of nitrogen and
phosphorus
Improvement in sewage
treatment 346.8 346.8 158 527 12 833 Reduction in agricultural
deposition of nutrients 522.45 n.a 178 982 n.a 2 Turner et al.,
(1999) Baltic drainage basin Linear cost functions Nitrogen and Phosphorus loads
Restoration of wetlands <346.8 174.5 143 186 6 611
50% reduction of nitrogen and
phosphorus
Coordinated solution where overall costs are minimised
462.5
190 400
3 Gren (2008)
9 Countries surrounding the Baltic Sea Chance constrained programming Nitrogen loads
National solutions where countries disregards impacts on total covariance with unadjusted target 1 294 n.a 199 920 n.a
0 40% reduction of nitrogen and
phosphorus
Improved wastewater
treatment 2 737 35 000 12 900
40% of the total N loads and 30% of
the P loads 4
HELCOM and NEFCO
(2007)
Baltic Sea Bottom up analysis
Nitrogen and Phosphorus
loads
Reduction of 55% of the NOx emissions from shipping
Reduction of agricultural
land 880.65 61 000 n.a
50% of the total N loads and 35% of
the P loads Reduction in livestock
holdings and changes in land use
<145.4 n.a 7 000 8 000 n.a
Reduction of fertilizers 436.4 <145.4 63 000 64 000 9 000
Changes in manure
handlings <145.4 n.a 30 000 n.a
Reduction in livestock
holdings n.a <145.4 n.a 600 700 kg Changes in land use n.a <145.4 n.a 2 000 5 Elofsson
(2003) Baltic Sea
Non linear programming model Nitrogen and Phosphorus loads
Reductions in point
source load of N/P 291.3 <145.4 60 000 5 800
50% reduction of nitrogen and phosphorous
Wetland restoration 57.8 n.a n.a n.a
Reduced fertiliser use 367.3 n.a n.a n.a Introduction of catch
crops in agriculture 246.9 n.a n.a n.a Livestock reduction in
agriculture 237.2 n.a n.a n.a
Improved treatment of
sewage 11.1 n.a n.a n.a
6 Schou et al.,
(2006) Baltic Sea
Non linear programming model Nitrogen and Phosphorus loads
NOX reduction 0.468 n.a n.a n.a
20% reduction of nitrogen
20% reduction of phosphorus, 30% reduction of
nitrogen
Wastewater sector 2.4 20.4 107 198
NOx emissions 100.8 n.a 3 611 n.a
Agricultural sector 62.4 7.2 13 173 152
, &.
20% reduction of phosphorus, 30% reduction of
nitrogen 7 Elofsson
(2012) Sweden
Empirical programming model Nitrogen and Phosphorus loads
NOx emissions 91.2 n.a 3 204 n.a Agricultural sector 7.2 4.8 16 074 89
8 Iho (2005) River Yläne basin
Numerical model
Phosphorus loss from fields
Reduced use of fertilizer, buffer strips and constructed wetlands
n.a 0.169 n.a 0.745 10% reduction of phosphorous
9 Helin et al.,
(2008) Finland
Integrated agri environment al model Agricultural nitrogen loads
Reduced fertilizer use and
buffer strips 25 28 n.a n.a n.a
50% reduction of nitrogen
Advisory service 7.5 7.5 1 606 38.2
Conversion of arable
land on sandy soil 22.6 22.6 1 645 44.9 Re establishment of
wetlands on marshy soil 8.2 8.2 204 18 10 Mewes (2012) Germany
semi empirical, conceptual model (Modelling Nutrient Emissions in River Systems model MONERIS model) Nitrogen and Phosphorus loads
Buffer strips 0.932 1.7 15 1.1
25% reduction nitrogen and
phosphorus
Reduced fertilization
118 684 1 672
Catch Crops 17 429 99
Reduction in cattle
numbers 32 986 472
Reduction in number of
poultry 6 402 108
Reduction in number of
pigs 13 938 369
Restoring wetlands 75 521 907
11 Ahlvik et al.
(2013) Baltic Sea
non linear optimization model Nitrogen and Phosphorus loads Constructing phosphorus ponds
n.a n.a
n.a 1 773
Objective 1: Country and sea
basin specific targets Objective 2: Sea basin specific target Objective 3:
Improving wastewater
treatment 42 926 9 772
Banning Phosphorus in
detergents n.a 3 324
Reductions in fertilizer applications to arable crops
72 875 n.a
Catch crops under spring
sown cereals 38 440 n.a
Reduction in cattle
numbers 35 765 1 031
Reduction in number of
pigs (poultry and pigs) 6489 373
Restoring wetlands on
agricultural soils 78 803 959
12 Hasler et al.
(2012). Baltic Sea
non linear optimization model Nitrogen and Phosphorus loads Improving wastewater treatment
n.a n.a
50 245 16 693
Objective 2: Sea basin specific
target
0%12 0%12 0%12 !
Reduced inorganic
fertilizers 927 721 206 n.a n.a
Reduced animal holding 515 412 <72.1 n.a n.a Improved wastewater
treatment 721 721 721 n.a n.a
Wetlands 515 309 309 n.a n.a
Catch crops 103 72.1 <72.1 n.a n.a Reduced detergents
154.5 <72.1 103 n.a n.a 13 Hyytiäinen et
al., (2013) 9 Countries surrounding the Baltic Sea non linear optimization model Nitrogen and Phosphorus loads
Sedirnentation ponds 72.1 72.1 103 n.a n.a
Objective 1: 37% reduction of P and
19% reduction of N Objective 2: 36% reduction of P and
19% reduction of N Objective3: 38% reduction of
* )
+ & , +
$ -' . /( $ , ' . /( $ ' -( $ ' ,( *
Reduction of fertilizer use
by 10% 55.9 n.a 19 857 n.a
Reduction of ammonia emissions from manure by 25%
1 127 n.a 2 762 n.a
Reduction of direct nitrogen emissions into the hydrosphere
128.3 n.a 8 130 n.a
14 Frosch et al., (2008) Austria, Bulgaria, Hungary and Romania semi empirical, conceptual model (Modelling Nutrient Emissions in River Systems model MONERIS model) Nitrogen loads
Increase of plant productivity by application of capital intensive production techniques
132.8 n.a 5 443 n.a
10% reduction of fertilizer use, 25%
reduction of nitrogen emissions from
manure, 75% reduction of erosion and 20%
5. Uncertainty and Risks
Cost effectiveness analysis is related directly to the abatement measures as it investigates the most cost effective way to combine them. The abatement measures though, can be characterized by some kind of uncertainty regarding their effects and costs. Those uncertainties can be grouped into three different categories such as natural, economic and technological uncertainties.
is caused by temporal and spatial variations of the biochemical and physical processes. As a result, the creation of a reliable model will depend on natural variations such as precipitation and temperature and therefore it will lead to variations in total costs of the presumed reductions targets. Some studies have tried to incorporate stochastic pollutant transports in their cost effectiveness models to account for uncertainty (Gren et al. 2000, 2002). Similarly, Gren (2008) examined the impact of risk linkages between mitigation measures on cost effectiveness solutions to given pollution reductions under conditions of stochastic loads to water recipients. Elofsson (2003) took into account stochastic relationships between abatement measures and nutrient loads and tried to examine the relations using chance constrained programming models.
and failure to reach assigned targets. Bio physical models that can include climatic variables are appropriate for examining the cost effectiveness of management practices. Lacroix et al. (2005) proposed the use of bio physical models in assessing the cost effectiveness of the farm management practices, allowing for climate variability. Concerning the Baltic Sea, Lindkvist et al. (2013) calculate cost effective solutions to reductions of nutrient loads under different scenarios with respect to impacts of climate change on nutrient loads.
is related to the real cost of alternative management practices. Asymmetric information can partially explain a part of the abatement cost uncertainty in the sense that those who implement the measures (e.g. farmers) usually have more information concerning the abatement costs. Berbel et al. (2011) conduct a sensitivity analysis to consider uncertainty in both costs and effects estimates using a simulation tool. As the non linear nature of effectiveness and costs of measures were recognized in a number of CEA studies, nonlinear bio economic optimization models have been developed by integrating the bio physical process and the economic behavioural models (Balana et al., 2011).
evaluated results and uncertainties of the nutrient pollution and the cost effectiveness analysis.
Another source of uncertainty is the discount rate used for the optimization. Discount rates affect investment costs of abatement measures if costs and benefits are included as annual values.
Finally, relates to the actual abatement capacity of a specific technology. Technological progress would minimize the cost of alternative technologies over time. This obviously would make it more cost effective to abate environmental pollution including the increased nutrient inputs in marine environments. However, technological change is not simply an autonomous process that takes place regardless of policies chosen but it is the result of a complex web of factors involving prevailing and expected prices, consumer values, taxes and regulations, and technology policies. According to Lindqvist and Gren (2013) an important source of technological change is learning by doing The results of the study show that the impact of learning by doing on the costs of abatement can be significant depending on the learning rate. As a result technological change could lead to substantial cost decreases of pollution.
6. Summary - Main points
One of the major environmental problems of the Baltic and Black Seas is eutrophication. Over time both Seas have been affected by a variety of human activities that result in species and habitats degradation arising from enrichment with nutrients. In the Baltic Sea anthropogenic pressures are exacerbated by the morphological characteristics of the region.
Τhe efficiency of the actions to reduce nutrient loads requires careful investigation using a cost effectiveness analysis. The term cost effectiveness can be referred to as a situation where the cost to effect ratio is minimized with specified restrictions. The definition of an efficient total cost curve requires three basic steps. The first step includes the specification of the objective that describes and reflects the problem. The second step requires the estimation of the effect of abatement measures with respect to the specific target. Lastly, the cost of abatement measures has to be assessed.
In the Baltic Sea there are few studies to address the least cost strategy reducing nitrogen and phosphorus loadings such as Gren et al. (1997), Gren (2008). Studies investigating cost effectiveness of agricultural nutrient reductions in the Baltic basin include Ollikainen and Honkatukia (2001), Gren (2001), Eloffson (1997), Helin et al. (2008), Mewes (2012).
The abatement measures of CEA though can be characterized by uncertainty regarding their effects and costs. These uncertainties can be grouped into different categories. Natural uncertainty is caused by temporal and spatial variations in biochemical and physical processes. Climate change is an important factor in uncertainty analysis and as a result water management is directly affected by climate variations as it is difficult to set efficient and viable targets. Economic uncertainty is related to the real cost of alternative management and technological uncertainty relates to the actual abatement capacity of a specific technology. Technological change is not simply an autonomous process that takes place regardless of policies chosen but is the result of a complex web of factors.
Although there are some attempts to describe the uncertainties, the literature is limited and there is a need to define the factors of uncertainty in order to construct efficient and reliable management measures and policies.
Finally, it is worth mentioning that areas may also differ in terms of socio economic, environmental and urban planning levels and these differences have to be taken into consideration in any environmental policy planning (Halkos and Salamouris, 2003).
.
References
Ahlvik, L., Pitkänen, H., Ekholm, P., Hyytiäinen, K. (2013). An economic ecological modelling framework to evaluate the impacts of nutrient abatement measures in the Baltic Sea. 27 p. Submitted manuscript.
Ahtiainen, H., Hasselström, L., Artell, J.. Angeli, D., Czajkowski, M., Meyerhoff, J., Alemu, M., Dahlbo, K., Fleming Lehtinen, V., Hasler, B., Hyytiäinen, K., Karlõseva, A., Khaleeva, Y., Maar, M., Martinsen, L., Nõmmann, T., Oskolokaite, I., Pakalniete, K., Semeniene, D., Smart, J. and Söderqvist, T. (2012). Benefits of meeting the Baltic Sea nutrient reduction targets Combining ecological modelling and contingent valuation in the nine littoral states. MTT Discussion Papers 1/2012. Online: rhttp://www.mtt.fi/dp/DP 2012_1.pdf
Arabi, M., Govindaraju, R.S., Hantush, M.M., (2006). Cost effective allocation of watershed management practices using a genetic algorithm.
42, W10429, doi:10.1029/2006WR004931.
Artioli Y, Friedrich J, Gilbert JA, McQuatters Gollop A, Mee DL, Vermaat EJ, Wulff F, Humborg C, Palmeri L, Pollehne F., (2008). Nutrient budgets for European seas: a measure of the effectiveness of nutrient reduction policies. 56, 1609–1617.
Aydin, M., (2005). Regional cooperation in the Black Sea and the role of institutions.
! " # $
% & ' ( 10, 57 83.
Azzaino, Z., Conrad, J. M., & Ferraro, P. J. (2002). Optimizing the Riparian Buffer: Harold Brook in the Skaneateles Lake Watershed, New York. ) * 78(4), 501 514.
Balana, B.B., Vinten, A., Slee, B., (2011). A review on costeffectiveness analysis of agri environmental measures related to the EU WFD: key issues, methods, and applications.
70(6), 1021– 1031.
Balana, B.B., Lago, M., Baggaley, N., Castellazzi, M., Sample, J., Stutter, M., Slee, B., Vinten, A., (2012). Integrating Economic and Biophysical Data in Assessing Cost Effectiveness of Buffer Strip Placement. 41, 380 388. Baker, T. J., & Miller, S. N., (2013). Using the Soil and Water Assessment Tool (SWAT) to assess land use impact on water resources in an East African watershed.
+ * 486, 100 111.
Bartolini, F., Bazzani, G. M., Gallerani, V., Raggi, M., & Viaggi, D., (2007). The impact of water and agriculture policy scenarios on irrigated farming systems in Italy: An analysis based on farm level multi attribute linear programming models. %
Barton,D. N., Saloranta, T., Moe, S.J., Eggestad, H.O., Vagstad, N., Solheim, A.L. and Selvik, J.L. (2006). Using belief networks in pollution abatement planning. Example from Morsa catchment, South Eastern Norway. NIVA Report SNo.5213, Norwegian Institute for Water Research (NIVA).
Barton, D.N., Saloranta, T., Moe, S.J., Eggestad, H.O., Huikka, S., (2008). Bayesian belief networks as a meta modelling tool in integrated river basin management — pros and cons in evaluating nutrient abatement decisions under uncertainty in Norwegian river basin. 66, 91–104.
Beaumont, N and Tinch, R., (2004). Abatement cost curves: a viable management tool for enabling the achievement of win–win waste reduction strategies?.
71, 207 215.
Behrendt, H., Kornmilch, M., Opitz, D., Schmoll, O., & Scholz, G. (2002). Estimation of the nutrient inputs into river systems–experiences from German rivers.
! 3, 107 117.
Bendtsen, J., Gustafsson, K. E., Söderkvist, J., & Hansen, J. L. (2009). Ventilation of bottom water in the North Sea–Baltic Sea transition zone "
75(1), 138 149.
Berbel, J., Martin Ortega, J., & Mesa, P., (2011). A cost effectiveness analysis of water saving measures for the water framework directive: the case of the Guadalquivir River Basin in Southern Spain. 25, 623 640.
Blanco Gutiérrez, I., Varela Ortega, C., & Purkey, D. R., (2013). Integrated assessment of policy interventions for promoting sustainable irrigation in semi arid environments: A hydro economic modeling approach. 128, 144 160.
Bonham J. G, Bosch D, Pease J. W. (2006). Cost effectiveness of nutrient management and buffers:Comparisons of two spatial scenarios. % * % *
38 (1), 17 32.
Börjesson, M., & Ahlgren, E. O. (2012). Cost effective biogas utilisation–A modelling assessment of gas infrastructural options in a regional energy system. 48, 212 226.
Borysova, O., Kondakov, A., Paleari, S., Rautalahti Miettinen, E., Stolberg, F., & Daler, D., (2005). Eutrophication in the Black Sea region; Impact assessment and Causal chain analysis. University of Kalmar, Sweden. 62 pages, ISBN 91 89584 50 3.
Bracmort, K.S., Arabi, M., Frankenberger, J.R., Engel, B.A., Arnold, J.G., (2006). Modeling long term water quality impact of structural BMPs. ' %"%
49 (2), 367 374.
Brady, M., (2003). The relative cost efficiency of arable nitrogen management in Sweden. 47(1), 53–70.
Brouwer, R., & De Blois, C., (2008). Integrated modelling of risk and uncertainty underlying the cost and effectiveness of water quality measures.
* , " - 23(7), 922 937.
Brouwer, R., & Hofkes, M., (2008). Integrated hydro economic modelling: Approaches, key issues and future research directions. 66 (1), 16 22.
Brouwer, R., Hofkes, M., & Linderhof, V. (2008). General equilibrium modelling of the direct and indirect economic impacts of water quality improvements in the Netherlands at national and river basin scale. 66 (1), 127 140.
BSC (2008) State of the Environment of the Black Sea (2001–2006/7). Edited by Temel Oguz. Publications of the Commission on the Protection of the Black Sea Against Pollution (BSC) 2008 3, Istanbul, Turkey. http://www.blacksea commission.org/.
BSC (2009) Implementation of the Strategic Action Plan for the Rehabilitation and Protection of the Black Sea (2002–2007). Publications of the Commission on the Protection of the Black Sea Against Pollution (BSC), 2009 1, Istanbul, Turkey.
http://www.blacksea commission.org/
Bystrom, O., Andersson, H., Gren, I.M., (2000). Economic criteria for using wetlands ass nitrogen sinks under uncertainty. 35, 35 – 45.
Camargo, J. A., & Alonso, Á., (2006). Ecological and toxicological effects of inorganic nitrogen pollution in aquatic ecosystems: a global assessment. .
32, 831 849.
Chaplot, V., Saleh, A., Jaynes, D.B., Arnold, J., (2004). Predicting water, sediment and NO3 N loads under scenarios of land use and management practices in a flat watershed.
% * " 154, 271 293.
Cools, J., Broekx, S., Vandenberghe, V., Sels, H., Meynaerts, E., Vercaemst, P.,
Seuntjens, P., Van Hulle, S., Wustenberghs, H/, Bauwens, W., Huygens, Marc.
Cools, J., Broekx, S., Vandenberghe, V., Sels, H., Meynaerts, E., Vercaemst, P.,
up a cost effective emission reduction scenario for nitrogen. * , " - 26 (1), 44 51.
Cuttle, S. P., Macleod, C. J. A., Chadwick, D. R., Scholefield, D., Haygarth, P. M., Newell Price, P., Harris, D., Shepherd, M. A., Chambers, B. J., Humphrey, R., (2007). An inventory of measures to control diffuse water pollution from agriculture. Report to Defra, produced by ADAS and IGER, London.
Danielsson, Å., Papush, L., & Rahm, L., (2008). Alterations in nutrient limitations—
Scenarios of a changing Baltic Sea. " 73 (3): 263 283.
DiMento, J. F., & Hickman, A. J.. (2012). / / " 0
) - * . Edward Elgar Publishing.
Douglas Mankin, K.R., Srinivasan, R., & Arnold, J.G., (2010). Soil and Water Assessment Tool (SWAT) model: Current developments and applications. '
%"% , 53 (5), 1423 1431.
Dworak, T., Kampa, E., Windhofer, G., Schilling, C., Zessner, M., & Lampert, C., (2008). Cost Effective Measures to Minimise Nutrient Pollution. Methodology for selecting cost effective measures to tackle nutrient pollution from the agricultural, municipal and industrial sectors in the Black Sea. Ecologic gGmbH, Institute for International and European Environmental Policy, Berlin.
Ebbesson, J., (1996). 1992 Baltic Convention; Transition or standstill? In R. Hjorth (ed.): Baltic Environmental Cooperation – A Regime in Transition. Linköping University, Water and Environmental Studies, Tema V Report 23.
EEA, (2005). Source apportionment of nitrogen and phosphorus inputs into the aquatic environment, European Environmental Agency EEA Report No 7, Copenhagen.
EEA, (2006). Integration of environment into EU agriculture policy the IRENA indicator based assessment report, European Environment Agency EEA Report No 2, Copenhagen.
EEA, (2010). The European environment – state and outlook 2010: synthesis, European Environment Agency, Copenhagen.
Elofsson, K. (1997). Cost Effective Abatement in the Agricultural Load of Nitrogen to the Baltic Sea. Dissertations, 28. Uppsala, Sweden: Dept of Economics, Swedish University of Agricultural Sciences.
Elofsson, K., (2007). Cost uncertainty and unilateral abatement.
* 36 (2), 143 162.
Elofsson, K., (2012). Swedish nutrient reduction policies: an evaluation of cost effectiveness. ! 12, 225 235.
European Commission (2009b). Flash Eurobarometer on water, Analytical report, Flash Eurobarometer 261 – The Gallup Organisation.
European Commission (2010). Report on the Application by Member States of the EU of the Commission 2009/384/EC Recommendation on Remuneration Policies in the Financial Services Sector: (2009 Recommendation on Remuneration Policies in the Financial Services Sector): Report from the Commission to the European Parliament, the Council, the European Economic and Social Committee and the Committee of the Regions. Publications Office.
European Commission. (2012). IMPACT ASSESSMENT Accompanying The Document Communication from the Commission to the European Parliament, the Council, the European Economic and Social Committee and the Committee of the Regions. A Blueprint to Safeguard Europe's Water Resources {COM (2012) 673 final}{SWD (2012) 381 final}.
European Community (1991). Council directive of 21 May 1991 concerning urban waste water treatment (91/271/ EEC). 1 ! " )
135/40 52.
Fezzi, C., Rigby, D., Bateman, I. J., Hadley, D., & Posen, P., (2008). Estimating the range of economic impacts on farms of nutrient leaching reduction policies. %
39(2), 197 205.
Fröschl, L., Pierrard, R., & Schönbäck, W., (2008). Cost efficient choice of measures in agriculture to reduce the nitrogen load flowing from the Danube River into the Black Sea: An analysis for Austria, Bulgaria, Hungary and Romania. 68, 96 105.
Gassman, P.W., Osei, E., Saleh, A., Hauck, L.M., (2002). Application of an environmentalvand economic modeling system for watershed assessments.
% % 38 (2), 423 438.
Glavan, M., White, S., & Holman, I. P., (2011). Evaluation of river water quality simulations at a daily time step–Experience with SWAT in the Axe Catchment, UK.
Glibert, P. M., & Burkholder, J. M., (2006). The complex relationships between increases in fertilization of the earth, coastal eutrophication and proliferation of harmful algal blooms. In: Granèli, E., Turner, J. (Eds.), The Ecology of Harmful Algae. Springer Verlag, New York, 341–354.
Gómez Limón, J.A., Riesgo, L., (2004). Irrigation water pricing: Differential impacts on irrigated farms. % 31, 47 66.
Gren, M., P. Jannke and Elofsson K., (1997a). Cost Effective Nutrient Reductions to the
Baltic Sea, * 10 (4), 341–362.
Gren, M., T. Söderqvist and Wulff F., (1997b). Nutrient Reductions to the Baltic Sea:
Ecology and Economics, 51, 123–143.
Gren, M., Destouni, G., Scharin, H., (2000). Cost effective management of stochastic coastal water pollution. * * % 5, 193–203.
Gren, M., (2001). International versus national actions against pollution of the
Baltic Sea. * 20 (1), 41 59.
Gren, M., Destouni, G., Tempone, R., (2002). Cost effective policies for alternative distributions of stochastic water pollution. 66, 145 157.
Gren, M., (2008). Adaptation and mitigation strategies for controlling stochastic water pollution: An application to the Baltic Sea. 66, 337 347.
Halkos, G.E.. (1993). An evaluation of the direct costs of abatement under the main desulphurisation technologies, MPRA Paper 32588, University Library of Munich, Germany.
Halkos. G.E.. (1995). Evaluation of the direct cost of sulphur abatement under the main desulfurization technologies, " 17, 391 412.
Halkos, G.E.. (1996a). Evaluating the direct costs of controlling NOX emissions in
Europe, " 20 (3), 223 239,
Halkos, G.E.. (1996b). Evaluating the direct costs of controlling NOx emissions in Europe, MPRA Paper 33253, University Library of Munich, Germany.
Halkos G.E. and Salamouris D.. (2003). Socio economic integration of ethnic Greeks from the former USSR: obstacles to entry into the Greek labour market,
* " * 29(3), 519 534.
Harou, J. J., Pulido Velazquez, M., Rosenberg, D. E., Medellín Azuara, J., Lund, J. R., & Howitt, R. E. (2009). Hydro economic models: Concepts, design, applications, and future prospects. + * 375(3), 627 643.
Hasler B., Smart J.C.R., Fonnesbech Wulff A. (2012): Deliverable 8.1. RECOCA. Structure of BALTCOST Drainage Basin scale abatement cost minimisation model for nutrient reductions in Baltic Sea regions.
Heinz, I., Pulido Velazquez, M., Lund, J. R., & Andreu, J., (2007). Hydro economic modeling in river basin management: implications and applications for the European water framework directive. 21(7), 1103 1125.
HELCOM (2004). The Fourth Baltic Sea Pollution Load Compilation (PLC 4), Baltic Sea Environment Proceedings, No. 93.
HELCOM (2008). Activities 2007 Overview, Baltic Sea Environment Proceedings, No. 114.
HELCOM (2009). Eutrophication in the Baltic Sea – An integrated thematic assessment of the effects of nutrient enrichment and eutrophication in the Baltic Sea region: Executive Summary. Baltic Sea Environment Proceedings. No. 115B.
HELCOM, (2011). The Fifth Baltic Sea Pollution Load Compilation (PLC 5), Baltic Sea Environment Proceedings No. 128.
HELCOM, (2013). Approaches and methods for eutrophication target setting in the Baltic Sea region. Baltic Sea Environment Proceedings, No. 133.
HELCOM and NEFCO (2007). Economics analysis of the BSAP with focus on eutrophication. Final report. HELCOM, Helsinki.
Helin, J., Laukkanen, M., & Koikkalainen, K., (2008). Abatement costs for agricultural nitrogen and phosphorus loads: a case study of crop farming in south western Finland.
% * $ * " 15 (4), 351 374.
Hyytiäinen, K., Ahtiainen, H., & Heikkilä, J. (2008). An integrated simulation model to evaluate national measures for the abatement of agricultural nutrients in the Baltic Sea.
% * $ * " 18, 440 459.