Munich Personal RePEc Archive
Multinationals and Corruption: Business
as Usual?
Ayca, Tekin-Koru
TED University
August 2013
Online at
https://mpra.ub.uni-muenchen.de/49348/
Multinationals and Corruption
:
Business as Usual?
Ayça Tekin-Koru
August, 2013
Abstract
This paper disentangles the e¤ects of corruption on entry mode decision by car-rying out an empirical analysis with rich, …rm-level data on the activities of Swedish MNCs around the globe in manufacturing sectors from 1987 to 1998. A number of propositions emerge from a simple theoretical framework. The panorama of the re-sults from the empirical part supports most of these propositions: (i). Corruption has a direct negative impact on green…eld investments and a weak positive impact on M&As. (ii). There are complex, asymmetric, secondary e¤ects of corruption on the mode of entry. (iii). International experience dampens the e¤ect of corruption on the mode of entry.(iv). The results are robust to di¤erences in measures of corruption.
JEL Classi…cation: F23
Keywords: Corruption; Foreign direct investment, Multinational …rms; M&As, Green…eld investments
1
Introduction
While foreign direct investment (FDI) ‡ows have the potential to make signi…cant con-tributions to economic and social development, there exist widespread perception and anecdotal evidence that these ‡ows are often restricted by corrupt practices of local or national government o¢cials in di¤erent countries around the globe. In e¤ect corruption acts as a barrier to entry by multinational corporations (MNCs) into new markets.
Corruption is often de…ned as the misuse of public power for private bene…t which includes bribing of the public o¢cials, kickbacks in public procurement and the misap-propriation of public funds. Corruption need not involve money changing hands; it may be observed in the form of "trading in‡uences" or granting favors. Thelevel of corruption has two dimensions: The frequency of corrupt undertakings and the total value of bribes paid -or the magnitude of in‡uences traded- which go hand in hand, i.e. in countries where bribery is the rule of the game, more than a tri‡ing proportion of …rm revenues tends to represent the bribes paid.
In 2012, Transparency International conducted a survey on 105 MNCs which are worth more than $11 trillion. These …rms touch the lives of millions of people across the globe. Of the 105 companies surveyed in the TI report, 50 do not disclose revenue/sales in any country of foreign operations, 85 do not disclose income tax in any country of foreign operations and 39 do not disclose any …nancial data (tax, revenue, sales, pre-tax income, capital investment, community contributions) in their countries of operation. Under these circumstances, it becomes absolutely necessary to rethink the e¤ects of corruption not only on the national …rms, but also on the FDI ‡ows channeled through di¤erent modes of entry with mode-speci…c consequences for the countries hosting considerable amounts of FDI.
MNCs undertake foreign direct investment in di¤erent ways: Cross-border M&As, green…eld investments, joint ventures, partial acquisitions, and di¤erent forms of low-equity commitment such as sales o¢ces, licensing, research centers, etc.1 Except for a few recent studies, trade literature has considered the e¤ects of corruption mainly in the context of whether or not to produce overseas, but has not di¤erentiated speci…c types of FDI and therefore treated the di¤erent entry modes as perfect substitutes. However, for most …rms seeking foreign market access, cross-border acquisitions and green…eld investments represent unlikely candidates for perfect substitution. While acquisitions provide rapid access to a foreign market with increased market power and a means of exploiting synergies -derived from the non-mobile skills such as knowledge of the local conditions- between buyer and seller …rms, green…eld investments o¤er the most pro…table internal utilization of mobile …rm-speci…c assets (R&D, marketing expenditures, scienti…c and technical workers, product newness and complexity and product di¤erentiation) for reasons including moral hazard and technology di¤usion.
There has been a systematic work on the e¤ects of corruption on FDI ‡ows using
1Due to lack of data, the middle ground between wholly owned operations and no entry could not be
aggregate data as explained in the next section. However, exploration of corruption’s e¤ect on FDI using …rm level data is much rarer due to the lack of systematic data on corruption and scarcity and con…dentiality of …rm-level data on FDI until recently.
The objective of this paper is to add to this newly developing literature by o¤ering a theoretical analysis that takes into consideration not just how corruption may restrict FDI ‡ows, but also how corruption may facilitate these ‡ows and then testing the …ndings of the theory on-site in Sweden by employing rich, …rm-level data on the activities of Swedish MNCs around the globe in manufacturing sectors from 1987 to 1998.
First, I o¤er a simple theoretical framework to motivate the empirical analysis. Six propositions are generated. The …rst two are related to the direct (primary) e¤ect of corruption on the mode of foreign expansion: (i) Higher levels of corruption discourage green…eld investments and (ii) under certain circumstances encourage cross-border M&As. The last four propositions and their corollaries address the indirect (secondary) e¤ects: (iii) MNCs with higher endowments of mobile skills are more likely to invest in the host country. This likelihood is dampened the higher the degree of corruption in the host country. The dampening e¤ect is stronger for M&As than green…eld investments. (iv) MNCs with higher endowments of non-mobile skills are more likely to invest in the host country. This likelihood is magni…ed the higher the degree of corruption in the host country. The magni…cation is stronger for M&As than green…eld investments.
Main innovations present in the empirical part are as follows: First, I include both foreign access strategies (cross-border M&As and green…eld investments) in the analysis, which di¤ers from many studies that include one of the strategies at a time. Second, I consider not only the direct e¤ects of corruption on the modes of foreign expansion but also the indirect e¤ects by allowing the corruption tolerance of a MNC vary with its skill set. Third, I apply the bivariate probit model to account for the correlation between di¤erent entry strategies, which reduces the inconsistency of the estimators signi…cantly. Results of the empirical analysis show that corruption reduces the likelihood of foreign entry as conjectured by recent studies. Entry mode decision of an MNC is a complex one and there are many asymmetries involved when it comes to the impact of corruption on this decision. First, green…eld investments are always discouraged by higher levels of corruption. This is more so for …rms with high levels of mobile skills. Second, M&As are encouraged by moderate levels of corruption. For …rms with high levels of non-mobile skills this e¤ect is stronger. However, when corruption levels are beyond a certain threshold, M&As are deterred as well. Third, …rms with a wider network of foreign a¢liates are more immune to the e¤ects of corruption, whereas small, single a¢liate …rms are severely a¤ected. These results con…rm the …ndings of the recent literature and add to it by testing a number of extensions of this view.
2
The recent literature
There are two strands of literature that are relevant to the analysis of corruption and entry modes of multinational corporations. The …rst one is the literature on foreign direct investment, too vast to be addressed here at length (Markusen (2002) and citations therein). The second line of literature relevant for this paper is voluminous as well and considers the causes and consequences of corruption in general. The work spans many di¤erent areas such as the impact of corruption on regulatory discretion, existence of rents and opportunities for rent-seeking, and civil service wage policy. There are also studies that consider the impact of corruption on various aspects of economic systems such as growth, military expenditure and procurement, delivery of public services, and inequality. Excellent surveys of this literature are provided by Jain (2001) and Aidt (2003).
There is a fast growing literature on corruption and FDI connection. The existing work is mostly empirical and can be summarized under two headings: (i). Corruption acting as the "grabbing hand" in FDI: Corruption in a host country introduces additional direct or indirect costs for the foreign investor and therefore makes FDI less likely. This argument …nds support in the works of Hines (1995), Wei (2000a, 2000b), Hellman et al. (2002), Habib and Zurawicki (2002), Busse and Hefeker (2007), Hakkala et al. (2008) and Javorcik and Wei (2009). (ii). Corruption acting as the "helping hand" in FDI: By greasing squeaky wheels of an ine¢cient bureaucracy and softening rigid regulations, corruption can reduce the obstacles in front of FDI and thus will not necessarily discourage it. The works of Lui (1985), Wheeler and Mody (1992), Saha (2001), Egger and Winner (2005), Bjorvatn and Soreide (2005), Wu (2006), Tekin-Koru (2006) and Barassi and Zhou (2012) are examples of this line of study.
The current paper builds on this earlier empirical work examining the e¤ects of cor-ruption on FDI. Many of these studies use aggregate cross-country data. The fewer ones using …rm-level data usually take steps beyond investigating the e¤ect of corruption on FDI. Some concentrate of the ownership structure of the …rm and some on the di¤erent types of a¢liate activity in host country and how they are a¤ected by corruption in the host country or by the corruption distance between the parent and host countries. Two such recent studies which are more relevant for the current paper are contributions made by Javorcik and Wei (2009) and Hakkala, Norbäck and Svaleryd (2008).
The most relevant work for the current paper is by Hakkala et al. (2008) who consider the impact of corruption on FDI in two dimensions: (i) corruption may in‡uence the probability that a …rm chooses to invest in a foreign market but not the size of the a¢liate activities once the investment is undertaken, and (ii) corruption may have di¤erent e¤ects on di¤erent types of a¢liate activities such as horizontal, vertical or export platform sales. Using Swedish …rm-level data, Hakkala et al. …nd that Swedish MNCs are less likely to invest in corrupt countries. In their detailed analysis, horizontal investments are deterred by high levels of corruption, however, there is no robust e¤ect of corruption on vertical or export platform sales. This asymmetry is explained by greater costs incurred by the …rm in case of production for local sales rather than production for exporting to other markets. They also …nd that R&D intensive or large …rms weather corruption better compared to less technical or smaller …rms. The current paper complements Hakkala et al. (2008) by using the same Swedish multinational …rm data to examine another aspect of FDI, namely the e¤ect of corruption on M&As and green…eld investments.
3
Corruption and foreign entry - A theoretical framework
This section presents a model of the e¤ects of corruption in countries on the choice of FDI, the mode-selection of FDI, and on the levels of FDI. Section 3.1 lays out the assumptions, followed by a sequential entry game involving Nash-Bargaining in Section 3.2. Finally, the complex e¤ects of host country corruption levels on FDI decisions of the MNCs are explored in Section 3.3.
3.1 Assumptions
A MNC from the parent country (P) considers entering the host country market, (H). It can choose between building its own establishment (green…eld investments, g) or to acquire an already existing indigenous …rm (mergers and acquisition (M&A), m). The outside alternative for the MNC is not to enter at all (n). Thus, =fm; g; ngrepresents the set of possible entry strategies (s). I assume, for the sake of simplicity, that exporting toH is not a feasible option due to transport cost reasons.2
Preferences. There exist two …nal goods sectors; X (increasing returns, imperfect competition) and Y (constant returns, perfect competition). Good Y is produced from a single factor L (Labor), where one unit ofL produces one unit of Y. Good X, on the other hand, is produced using …rm speci…c assets and factorL, both in …xed proportions. The linear demand functions are derived from the quasi-linear utility function maximized subject to a budget constraint. Income is derived from labor and pro…ts.
maxU = X
2 X
2+Y (1)
subject to L+ = Y +pX
2The model could be broadened in such a way that the …rm’s choice extends to serving country H by
whereLand Y are numéraires. The inverse demand function for good X is as follows:
P = X (2)
Firms. I assume that there are two (potential) …rms producing X in country H, one from parent countrypand one indigenous to host country h.
Firms di¤er in their skills. As in Nocke and Yeaple (2004) there are two types of …rm-speci…c skills: mobile ( ) and non-mobile ( ). The e¢ciency of a …rm’s production technology is assumed to travel internationally at little to no cost. On the other hand, the degree of familiarity with the local business conditions is assumed immobile. These non-mobile skills, including but not limited to the degree of in‡uence on political process and of the strength of ties with local bureaucracy, marketing strategies geared towards the expectations of the host country and greater access to distribution channels a¤ect both marginal production costs and the …xed entry costs as does the level of corruption ( ) in countryH. Variable production costs of …rms pand h are given by cp and ch:
cp(s) =
c( p; p; ) ifs=g
c( p; h; ) ifs=m
(3)
ch(s) =c( h; h; ) for all s (4)
Due to investment in R&D and long term diverse experience in managerial practice, which are internationally mobile, …rmpis endowed with an alternative technology which allows it to have greater cost advantages in producing goodxcompared to …rmhin cases of both M&As and green…eld investments. On the other hand, if green…eld investment is the chosen mode of entry, then …rm h enjoys greater cost savings due to being better acquainted with the local business conditions. Since …rmp has access to the non-mobile skills of the indigenous …rm ( h) in an M&A regime, the size of the cost savings is as
big as the ones enjoyed by …rm h in green…eld and no entry regimes. Higher levels of corruption ( ) in countryH will increase the variable costs of production at an increasing rate. In countries with widespread corruption, for example, the variable costs may reach prohibitively high levels.3
I also consider the interactions of …rm-speci…c skills with the level of corruption in countryH. I assume that high degrees of mobile skills make the MNCs less corruption tolerant. Thursby and Thursby (2006) in their study of more than 200 multinational companies across 15 industries, mostly headquartered in the United States and Western Europe, …nd that only 22 percent of the R&D e¤ort in emerging countries is for new science. In other words, companies keep their most cutting-edge research in developed countries where intellectual property protection is the strongest. Therefore, one can argue that mobile skills get less bene…cial for the …rm as corruption increases.4
3The variable productions costs are concave in both mobile ( ) and immobile skills ( ) and convex in
the level of corruption ( ): @c @ p <
@c @ h <
0; @c @ h <
@c @ p <0;
@c
@ >0and @2c @ 2p =
@2c @ 2 h
<0; @2c @ 2 h
= @2c
@ 2p <0; @2c
@ 2 >0
Moreover, the variable production costs are assumed to be submodular in their arguments.
On the other hand, …rms may adopt a "when in Rome, do as Romans do" strategy in their foreign operations. This can translate into non-mobile skills, such as local con-nections, becoming much more valuable in the existence of corruption. There are many anecdotes to the e¤ect. When Candy, the Italian home appliances manufacturer, decided to expand into Russia in 2005 and open the company’s …rst plant there, the company had to deal with extreme di¢culties for the company’s trucks to even make it across the border. After struggling with the problem for weeks, Candy decided to set up a division of the company in Moscow that would have the sole responsibility of dealing with customs clearance. The problem was solved in days. Another high-pro…le example is the recent scandal of GlaxoSmithKline, the British drug giant, which involves using bribes, kickbacks and other fraudulent means by the Chinese executives of the company to bolster drug sales in China over 2007-2013 period. Therefore, in the light of these anecdotal evidence, it may not be wrong to assume that high degrees of non-mobile skills make the MNCs more corruption tolerant.5
In addition to the variable costs, the multinational …rm incurs …xed entry costs as well. First, there is a …xed green…eld establishment cost (F(g)). Second, there is an M&A cost (F(m)) if the indigenous …rm is acquired.
Last but not least, there is a bureaucratic cost of entry (Fb(s) = Fb( i; ) for i =
fh; pg) in the host country, H. This cost, Fb essentially measures the procedures, time,
cost and paid-in minimum capital required for a …rm to start-up and formally operate in the host country. The regulation of entry enables the regulators to collect bribes from the potential entrants and serves no social purpose. Therefore, in the model, it is assumed thatFb increases in corruption. More extensive regulation should be associated with socially inferior outcomes, particularly corruption. Djankov et. al. (2002) …nds evidence supporting the public choice view that entry regulation bene…ts politicians and bureaucrats. Since it is possible to avoid some if not all of these barriers, a higher degree of familiarity with the local business/governance conditions will help reducing these costs by itself and will do even more so in more corrupt environments.6
3.2 The game
Firmpmaximizes its pro…ts in the host country through its choice of entry mode and the quantity supplied.7 In the …rst stage, the MNC chooses its entry mode and in the second stage makes its quantity decision in a usual Cournot setting by taking the entry mode from the previous stage as given.
follows: @2c @ p@ >0;
@2c @ h@ >0:
5The cross derivatives of cost functions with respect to non-mobile skills and the level of corruption
are as follows: @2c @ h@ <0;
@2c @ p@ <
0:
6The o¢cial costs of entry are concave in immobile skills ( ) and convex in the level of corruption ( ):
@Fb @ h <
@Fb @ p <
0; @Fb
@ >0and @2Fb
@ 2 h
= @2Fb
@ 2p >0; @2Fb
@ 2 >0:The cross derivatives @2Fb
@ h@ and
@2Fb @ p@ are
negative by the same logic used in variable costs.
7This paper explores the pro…t maximization of …rm pin the host country in isolation and does not
A strategy for …rmphas two elements: (i):the …rm’s entry mode choice,s2 where
=fm; g; ng is the set of all possible entry nodes and (ii): the …rm’s quantity choice,
xp(s) where xp(s) > 0 indicates that …rm p is active in the host country; xp(s) = 0
indicates that …rmp choosesnand thus not to produce in countryH.
Aggregate supply to the consumers by …rms i=fh; pg in the host country given the entry mode choices; is:
X(s) =X
i
xi(s); i=fh; pg (5)
and the aggregate pro…ts generated under each entry strategy s for …rms p and h in countryH are given by
p(s; xp(s)) = [(P cp(s))xp(s)] F(s) Fb(s) = p(s; xp(s)) F(s) Fb(s)(6) h(s; xh(s)) = [(P ch(s))xh(s)] = h(s; xh(s))
wherexi(s); ci(s); F(s)andFb(s) are the quantity choice, variable cost of production for
each …rmi, …xed costs associated with each entry modesand bureaucratic costs of entry.
i signi…es the operating pro…ts of …rm i=fh; pg. The M&A cost F(m) is endogenized
through a simple bilateral Nash bargaining process.
Bargaining. In this game, the acquiring …rm (…rm p) and the target …rm (…rm h) seek to split a total value p(m) Fb(m)which they can achieve if and only if they agree
on a speci…c division. If there is no agreement between …rmh and …rmp, the latter opts for the next best alternative among no entry and green…eld investment. The following payo¤s, thus, can be called backstop payo¤s and be signi…ed by a tilda:
ep = maxf p(g); p(n)g (7)
eh = maxn h(g)jep= p(g); h(n)jep= p(n) o
For the solution of this bargaining procedure, it should be assumed that there is a positive surplus ( p(m) Fb(m) ep eh >0) from agreement. If this were not the
case, the whole bargaining process would be unlikely because each side would just take up its outside opportunity and receives its backstop payo¤. Next, consider the following rule coming from the solution of bilateral Nash-bargaining process.
Criterion 1 Given 2[0;1] each party is to be given its backstop payo¤ plus a share of the surplus, a fraction for …rm p and a fraction(1 ) for …rm h.
The above stated criterion formalizes these two issues to have a solution to the Nash’s cooperative game approach to bargaining.
Writing p(m) and h(m) for the amounts that …rmp and …rmh receive, the above
stated bargaining criterion can be translated as
p(m) = ep+ ( p(m) Fb(m) ep eh) = p(m) Fb(m) F(m) (8) h(m) = eh+ (1 )( p(m) Fb(m) ep eh) =F(m)
Next, de…ne the reservation price of the buying party as Rp = p(m) Fb(m) ep
and that of the selling party as Rh = eh. The reservation price of the multinational is
the pro…ts of the multinational after the M&A minus its next best alternative, i.e. the maximum of its green…eld or no entry. The reservation price of the local …rm is the local …rm’s pro…ts if no agreement is reached. Then, one can arrive at the cost of M&A by solving the equations in (7) forF(m):
F(m) = (1 )Rp+ Rh (9)
When = 1; …rm p has all the bargaining power implying that F(m) = Rh: When
= 0;on the other hand …rmp has no bargaining power and thus the cross-border M&A price is the same as its reservation price, i.e. F(m) =Rp:
Equilibrium. The game is solved in the usual logic of backward induction. I seek the subgame perfect equilibrium of this game. The second stage of the game involves the product market where …rms compete á la Cournot. The equilibrium output levels and total pro…ts of all …rms are reported in the Appendix. Production and sales take place with …rms moving simultaneously. The game is solved for Nash equilibria in pure strategies. Each equilibrium point is assumed to have equal probability.
Criterion 2 Denote by Xp(s) the set of possible quantity choices for form p in the host
country market given entry mode choice s: The Nash equilibrium for the second-stage quantity sub-game for anys is the quantity choicexp(s) such that:
p(s; xp(s)) h(s; xp(s); xp (s)) for allxp(s)2Xp(s) (10)
Denote by p(s ) the pro…t to …rm p from the Nash equilibrium quantity choice
corresponding to the entry mode choices:An equilibrium for the …rst-stage entry game is an entry strategy s such that:
p(s ) p(s; s ) for alls2 (11)
if the payo¤ from M&A is higher than that from green…eld investment. The …nal decision in regard to entry mode, henceforth, will be the outcome of the relative magnitudes of and the interrelations among country size, level of corruption in the country, …rms’ relative endowments of mobile and immobile skills, and the relative bargaining power of the parties.
Considering the current setup of the model, it would be natural to expect a negative impact of host country corruption on the FDI modes of entry. In other words, as the corruption level of the host country increases both the variable production costs and initial start-up costs will get higher and thus discourage the MNC from investing in the host country all together. However, this argument ignores both the changes in the acquisition price -which is endogenized in this model- with respect to changes in corruption and the importance of the MNC’s relative endowment of mobile and non-mobile skills. The corruption tolerance -how well the …rm copes with the potential negative impact of corruption on pro…tability- of a MNC with high levels of mobile skills will be quiet low compared to a MNC endowed with not to so strong mobile skills but with impressive levels of non-mobile skills. Therefore, to formalize this discussion I use comparative statics in the next section.
3.3 Comparative statics
In this section, I analyze the e¤ects of corruption on the entry mode decision of a multi-national …rm to generate testable hypotheses.
3.3.1 Corruption
What is the impact of host country corruption on the equilibrium patterns of green…eld investments, M&As and no entry at all? To answer this question, I compare the e¤ects of corruption level ( ) in countryH on the payo¤s of …rm pfrom di¤erent entry strategies. For notational convenience I will henceforth use p(s) for p(s; xp(s)). Before the
total derivative of p(s) for 8s 2 with respect to is calculated two cases should
be di¤erentiated: The case where green…eld investment is the next best alternative to M&A and the case where no entry is the next best. The latter is trivial as both variable production costs and bureaucratic costs of entry will be higher for higher corruption levels. Therefore, I continue with the more complex case where green…eld investment is the next best alternative to M&A.
Proposition 1 More corruption in the host country reduces the likelihood of green…eld investments.
Proof. The payo¤ from green…eld investment to …rm pis
p(g) = p(m) Fb(g) F(g) (12)
First, take the total derivative of p(g) with respect to and then substitute the explicit
applying the assumption that @cp
@ = @ch
@ ;arrive at
d p(g)
d =
2 3
@cp
@
@Fb(g)
@ (13)
Given that @F@b(s) >0 and @cp
@ >0fors2 fm; gg the above derivative is negative.
In this model, green…eld investments are a¤ected by host country corruption through operating costs and bureaucratic costs of entry. As the level of corruption in the host country increases, MNC’s pro…ts from a green…eld investment project decline due to rising operating costs (e.g., costs of dealing with red-tape in day-to-day activities) and rising start-up costs (e.g., long waiting times for permits). This in turn reduces the payo¤ and eventually the likelihood of green…eld investments in corrupt host countries. This result is in line with the existing literature on the e¤ects of corruption on FDI. Next, consider the M&A case.
Proposition 2 More corruption in the host country (i) reduces the likelihood of M&As when the degree of corruption is low; (ii) increases the likelihood of M&As when the degree of corruption is high.
Proof. The payo¤ from M&A to …rm pis given by
p(m) = p(m) Fb(m) F(m) (14)
where F(m) = (1 )[ p(m) Fb(m) p(g)] + h(g)
Notice that the cost of acquisition is determined by the other parameters of the model. Take the total derivative of p(m) with respect to
d p(m)
d =
d p(m)
d + (1 )
d p(g)
d
d h(g)
d
@Fb(m)
@ (15)
Given the Cournot pro…ts from the Appendix, it is trivial to …nd thatd p(m)
d =
xp(m)@cp
@ <
0 since @cp(m)
@ > 0. The second term, d p(g)
d < 0 as proven above. The third term, d h(g)
d =
2xh(m)
3 @ch
@ <0 since @ch(g)
@ >0. The last term,
@Fb(m)
@ >0:
(i). If d h(g)
d is su¢ciently small, then the derivative in equation (15) becomes
negative.
(ii.) If d h(g)
d is su¢ciently large, then the derivative in equation (15) becomes
positive.
…rm is high and this translates into a large price reduction in M&A negotiations. This price reduction then becomes the dominant factor and corruption increases the likelihood of M&As compared to the green…eld investments.
3.3.2 Corruption and mobile skills
I now turn to the issue that how the corruption tolerance of …rmpchanges as the level of mobile skills ( p) change. Speci…cally, how does the equilibrium pattern changes when the interaction of the mobile skills with the level of corruption is considered? As stated earlier, mobile skills provide production cost advantages to the MNC. However, the marginal impact of these skills gets lower in the existence of rising corruption levels for reasons such as poor intellectual property right (IPR) protection.
Proposition 3 MNCs with higher endowments of mobile skills are more likely to conduct green…eld investments. This likelihood is dampened the higher the degree of corruption in the host country.
Proof. From the assumption that@@c
p <0, the proof of the …rst part of the proposition
is trivial.
For the second statement, consider the cross derivative of p(g)given in equation (12)
with respect to p and :
d2 p(g)
d pd =
4 9 2
@cp
@ p @cp
@
4 3 xp(g)
@2cp
@ p@ (16)
Given that @cp
@ p <0 and
@cp
@ >0and @2c
p
@ p@ >0;the above derivative is negative.
Higher endowment of mobile skills give the MNC an advantage over local …rms and thus guarantees a higher market share. Therefore, independent of the degree of cor-ruption, mobile skills such as technological know-how or managerial ability increase the pro…ts of the MNC in the host country. However, as the degree of corruption in the host country increases the usefulness of such skills deteriorate due to poor IPR protection or bureaucratic red-tape. Therefore, it is likely that MNCs with high levels of mobile skills may avoid investing in highly corrupt environments in the form of green…eld investments.
Proposition 4 MNCs with higher endowments of mobile skills are more likely to conduct M&As. This likelihood is dampened the higher the degree of corruption in the host country.
Proof. From the assumption that @c @ p <
@c
@ h < 0, the proof of the …rst part of the
proposition is trivial.
For the second statement, consider the derivative of d p(m)
d given in equation (15)
with respect to p. To derive an expression for it, consider the components of equation
(15) one by one. The derivative of the …rst component d p(m)
d with respect to p is
d2 p(m)
d pd =
2 3 2
@cp
@ p @cp
@
1
xp(m)
@2cp
which is negative as @cp
@ p < 0,
@cp
@ > 0 and @2c
p
@ p@ > 0. The derivative of the second
component is already given in equation (16) which is proven to be negative. Next, consider the derivative of d h(g)
d with respect to p
d2 h(g)
d pd =
2 9 2 @cp @ p @cp @ + 2 3 xh(g)
@2cp
@ p@ (18)
which is positive as @cp
@ p <0,
@cp
@ >0 and @2c
p
@ p@ >0. When all of the components are put
together
d2 p(m)
d pd =
4 9 2
@cp
@ p @cp
@ (1 + )
1 @2cp
@ p@ xp(m) +
2
3 xh(g) + (1 )xp(g) (19)
Given that @cp
@ p <0and @cp
@ >0and @2c
p
@ p@ >0;the derivative in equation (19) is negative.
Corollary 1 The dampening e¤ect is stronger for M&As than green…eld investments as long as the MNC has less bargaining power.
Using the payo¤ functions in the Appendix, one can easily prove that d2 p(m)
d pd <
d2 p(g)
d pd
if < 12 and xi(s) wherei= (p; hg.
In more corrupt environments, increases in both green…eld and M&A pro…ts due to higher endowments of mobile skills will be lower than what they would be for lesser amounts of corruption. While mobile skills provide variable cost savings for …rm p; in-creasing levels of corruption dampens the e¤ectiveness of these cost savings. This in turn implies an advantage for the indigenous …rm, which will exploit it at the negotiation table by demanding a higher acquisition price. Therefore, in case of an M&A, …rm p will be hurt due to reduced e¤ectiveness of its mobile skills coupled with an increase in the M&A entry cost. Moreover, if the MNC has a lower bargaining strength than the local …rm, then this e¤ect gets ampli…ed.
3.3.3 Corruption and non-mobile skills
The analysis so far has highlighted the importance of increasing levels of corruption and the cross e¤ects with mobile skills. I now investigate how the degree of non-mobile skills endowment with increasing levels of corruption a¤ect the equilibrium mode of entry.
Proposition 5 MNCs with higher endowments of non-mobile skills are more likely to conduct green…eld investments. This likelihood is magni…ed the higher the degree of cor-ruption in the host country.
Proof. From the assumption that@@c
p <0, the proof of the …rst part of the proposition
For the second statement, consider the cross derivative of p(g)given in equation (12)
with respect to p and :
d2 p(g)
d pd
= 4 9 2 @cp @ p @cp @ 4 3 xp(g)
@2cp
@ p@
@2Fb(g)
@ p@
(20)
Note that @cp
@ p <0and
@cp
@ >0and @2c
p
@ p@ <0 and
@2Fb(g)
@ p@ <0. Sincecp is assumed to be
submodular in its arguments, @2cp
@ p@ >
@cp
@ p
@cp
@ , the above derivative is positive.
Submodularity here means that the bene…cial e¤ect of non-mobile skills in corrupt environments is magni…ed compared to the direct positive e¤ect of non-mobile skills or direct negative impact of corruption on …rm pro…ts. Higher endowment of non-mobile skills, in other words familiarity with local business conditions, increases the pro…ts of the MNC in the host country. However, as the degree of corruption in the host country increases, such skills become more valuable because …rms adopt a "when in Rome, do as Romans do" strategy in their foreign operations. Therefore, it is likely that MNCs with high levels of non-mobile skills may avoid investing in highly corrupt environments in the form of green…eld investments.
Proposition 6 MNCs with higher endowments of non-mobile skills are more likely to conduct M&As. This likelihood is magni…ed the higher the degree of corruption in the host country.
Proof. From the assumption that @c @ p <
@c
@ h < 0, the proof of the …rst part of the
proposition is trivial.
For the second statement, consider the derivative of d p(m)
d given in equation (15)
with respect to p= h. Since …rmp buys …rmh, it adopts …rmh’s superior non-mobile
skills. To derive an expression for it, examine the components of equation (15) one by one. The derivative of the …rst component d p(m)
d with respect to p is
d2 p(m)
d pd p= h
= 2 3 2 @cp @ h @cp @ 1
xp(m)
@2cp
@ h@
(21)
As long as cp in its arguments the above derivative is positive. The derivative of the
second component is already given in equation (20) which is proven to be negative. Next, consider the derivative of d h(g)
d
d2 h(g)
d pd p= h
= 2 9 2 @cp @ p @cp @ + 2 3 xh(g)
@2cp
@ p@
(22)
As long ascpin its arguments the above derivative is positive. When all of the components
are put together
d2 p(m)
d pd p= h
= 4 9 2
@cp
@ h
@cp
@ (1 + )
1 @2cp
@ h@
xp(m) +
2
3 xh(g) + (1 )xp(g)
Note that @cp
@ h <0 and
@cp
@ >0 and @2c
p
@ h@ <0. Sincecp is assumed to be submodular in
its arguments, @2cp
@ p@ >
@cp
@ p
@cp
@ , the derivative in equation (23) is positive.
Corollary 2 The magni…cation is stronger for M&As than green…eld investments as long as the MNC has more bargaining power.
Using the payo¤ functions in the Appendix, one can easily prove that d2 p(m)
d hd >
d2 p(g)
d hd
if > 12 and xi(s) wherei= (p; hg.
In an M&A what …rm p buys is the non-mobile skills ( ) of the indigenous …rm as well. These skills a¤ect both marginal production costs and the …xed entry costs as does the level of corruption ( ) in country H. These skills become more valuable in corrupt environments. If the discrepancy between the non-mobile skills of the MNC and that of the indigenous …rm is very high, then the acquisition price will be higher, too. Therefore, if the bargaining strength of the MNC is high, then the multinational can negotiate a price lower than the reservation price of the indigenous …rm and at the same time can make higher pro…ts by using the newly earned superior non–mobile skills in an M&A scenario.
In a way, it is the relative rates of corruption tolerance between these …rms which determines the equilibrium mode of entry. For instance, if the corruption tolerance of …rm p is very high due to superior mobile skills and if it couples with low levels of non-mobile skill endowments, then the indigenous …rm can enjoy a greater advantage. It might as well be the case that the indigenous …rm has all the "right" contacts with the local bureaucracy and it is going to be costly for the MNC to buy these non-mobile skills. If the indigenous …rm happen to have a high bargaining strength then it might prevent the entry of the MNC all together and stay as the national monopoly.
In summary, as corruption increases multinational entry gets discouraged. However, passed a certain threshold, corruption may induce more M&As. Moreover, when the importance of skill endowments is considered, multinational …rms with rich mobile and non-mobile skills would prefer green…eld investments in corrupt environments. MNCs with low levels of mobile and non-mobile skills would prefer no entry. Multinationals with high levels of mobile, but low levels of non-mobile skills would prefer M&A if the bargaining strength is high. Otherwise, they would go with the green…eld choice or no entry.
The results of this section lend themselves to empirical testing and I now turn to a discussion of the empirical analysis and the data set.
4
Econometric analysis
4.1 Econometric model
Propositions 1 and 2 in the previous section state that corruption in the host country has asymmetric e¤ects on a multinational’s mode of foreign expansion. While green…eld in-vestments decline with higher levels of corruption, cross-border M&As can be encouraged under certain circumstances. I use the following speci…cation to test these predictions:
yikt;s = 0;s+ 1;s kt+ 02;sxit+ 03;sxkt+"ikt;s (24)
whereyikt;s is a binary indicator if …rm i’s entry into countryk during time period t in
the form ofs2 fm; g; ng, kt denotes corruption,xit is a vector of …rm-speci…c variables
(including mobile skills it; non-mobile skills it; bargaining strength it) and xkt is a
vector of country-speci…c variables (including variable production costs ckt;market size kt). I also include time and industry …xed e¤ects in all speci…cations to account for the
e¤ect of unobservables. Due to data limitations of industry-speci…c variables for di¤erent countries, the regressions have no such variables.
Propositions 3 through 6 and their corollaries involve more complex, secondary e¤ects of corruption on mode of foreign entry decision which act through mobile and non-mobile skill endowments of the multinational …rm. To test the predictions of the model I use marginal e¤ects calculations, which will be discussed in detail below.
The most appropriate econometric method to use would be the nested logit model since the MNC …rst …gures out the next best alternative to a negotiated agreement and then enters. However, due to lack of choice speci…c attributes in the data, the nested logit model becomes useless. Therefore, the empirical part of the paper adopts the most general setting where the …rm decides if and how to enter.
In this paper, the bivariate probit model is the main method used. This model is useful in providing the marginal e¤ects for each entry strategy. First, I estimate e¤ects of corruption on FDI (M&A and green…eld together) versus no entry, because it would provide a useful comparison to some of the existing literature that does not take di¤erent entry modes into account. When the bivariate probit is used for the choice between FDI and no entry, there are two equations (one for FDI and one for no entry) and two binary dependent variables,yikt;f di (1 if there is FDI and 0 otherwise) andyikt;n(1 if there is no
entry and 0 otherwise). If the MNC chooses FDI, thenyikt;f di = 1 and yikt;n = 0. If the
MNC chooses not to enter the host market, thenyikt;f di = 0 and yikt;n= 1.
Then, bivariate probit estimates of e¤ects of corruption on new entry by Swedish multi-nationals through cross-border M&As and green…eld investments are estimated. Once more, there are two equations (one for M&As and one for green…eld investments) and two binary dependent variables, yikt;m (1 if there is an M&A and 0 otherwise) and yikt;g.(1
if there is a green…eld investment and 0 otherwise). If the MNC chooses M&A, then
yikt;m = 1and yikt;g = 0. If the MNC chooses green…eld investment, then yikt;m = 0and
yikt;g = 1.
Error terms "ikt;s are distributed as bivariate normal, each with a mean of zero, and
corre-lations as o¤-diagonal elements. The bivariate probit model shows structural similarities to a seemingly unrelated regression model, except that the dependent variables are binary indicators.
The LR test is used to test the independence of residuals to explore the existence of nesting possibilities if any.
4.2 The dependent variable
This section provides detailed information on the dependent variable. The data set used in the paper covers information on the cross-border activities of Swedish MNCs in 42 countries during three distinct time periods: 1987-90, 1991-94 and 1995-98. The country coverage is determined by the availability of the corruption measure and control variables. The …rm-level data used in this paper is the product of a questionnaire sent to Swedish MNCs by the Research Institute of Industrial Economics (RIIE) in Stockholm, Sweden about every fourth year since 1960s. The data include all Swedish MNCs in manufacturing industry and contain detailed information on employment, production, R&D and entry modes of each majority owned foreign manufacturing a¢liate. Only the period between 1987 and 1998 is used in this paper due to pronounced changes in the survey questions over time and the low response rate in the 2003 survey.
The degree of multinationality varies signi…cantly in the data. More than half of the …rms are single a¢liate multinationals. An overwhelming majority of …rms have foreign operations in just a few countries. When a new opportunity to serve a host country arises, this chance may come to a multinational active in another market.
The de…nitions of cross-border M&As and green…eld investments are taken from the RIIE survey. The RIIE asks the following four questions to each foreign a¢liate: (1) From what year has the a¢liate been a production company of the group? (2) Was the a¢liate a sales company of the group before the year mentioned above? (3) Did the a¢liate operate as a production company of another group before the year mentioned above? (4) Was the a¢liate a state-owned company before the year mentioned above? If the answers to last three questions are all negative, then the investment is classi…ed as a green…eld investment. If the answer to question 3 is a¢rmative, then the mode of entry is a cross-border M&A. The frequency of new a¢liates transformed from sales companies of the group and the state-owned enterprise acquisitions is low.
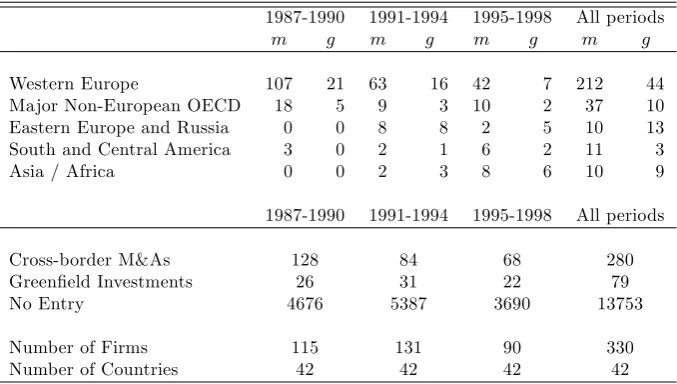
Table 1 summarizes the foreign expansion transactions by Swedish MNCs between 1987 and 1998. The numbers of cross-border M&As and green…eld investments as well as the location of these investments in broad regional categories are reported. When examining this table, several remarks can be made. First, as can be observed in the bottom half of Table 1, in each time period foreign entry is small when compared to no entry, which is true for an overwhelming majority of MNCs around the globe. However, among the two entry modes the total number of M&As is substantially higher than that of green…eld investment in all three time periods.
and green…eld investments in these two regions are higher than all the other regions together. The common denominator of all these countries is their level of development. FDI goes predominantly to advanced countries where corruption is relatively low, even though the share of developing countries has been rising. Apart from lower corruption levels, developed countries o¤er a large and growing demand coupled with ease of …nding sub-contractors and distribution channels all of which favor entry.
Third and last, developed countries supply a higher number of high quality acquisition targets. Table 1 shows that Swedish MNCs have considerably higher M&As in Western Europe and major non-European OECD countries. The preferred mode of entry in devel-oping countries is not as clear, however. The share of green…eld investments in all entry modes (calculated by using the last two columns of the top half of Table 1) in developing countries is 45%, whereas it is only 18% in developed countries.
4.3 Measuring corruption
In this paper, I use corruption indices constructed from survey responses. Whether per-ceptions of corruption as enunciated by survey responses indeed re‡ect the reality is a commonly discussed issue. This paper is partial to the idea that although perceptions may deviate from reality at the margin, there will not be wide divergences.
There is a plethora of corruption indices made available by di¤erent institutions through surveys conducted. In this paper, I use two di¤erent corruption indices: One is the Worldwide Governance Indicators (WGI), a long-standing World Bank research project to develop cross-country indicators of governance and the other one is the Cor-ruption Perception Index (CPI) annually published by Transparency International (TI). Both are essentially polls of polls. I rescaled the values between 1 and 100 for comparison purposes, where higher values indicate higher levels of corruption in the host country.
The more widely known of the two is the CPI which collates results of up to twelve individual surveys conducted by the World Bank (World Business Environment Survey), the European Intelligence Unit, the World Economic Forum (Global Competitiveness Re-port), the Institute of Management Development, Political and Economic Risk Constancy in Hong Kong, etc. Many of the same sources used by the WGI are used by the CPI as well, and thus, not surprisingly, the WGI and the CPI are highly correlated.
between two groups: (i) business people and/or residents of a country, and (ii) experts (who are asked to rank countries on various dimensions). A composite index for each dimension of governance is constructed using these individual surveys through an unob-served components model.
In this paper, I use the Control of Corruption,CC from the WGI as the main corrup-tion indicator. It captures percepcorrup-tions of the extent to which public power is exercised for private gain, including both petty and grand forms of corruption, as well as "capture" of the state by elites and private interests. The CPI is also used as a robustness check. In the following robustness exercises, I also consider another very relevant dimension of governance, namely the Rule of Law,RL. It captures perceptions of the extent to which agents have con…dence in and abide by the rules of society, and in particular the quality of contract enforcement, property rights, the police, and the courts, as well as the likelihood of crime and violence.
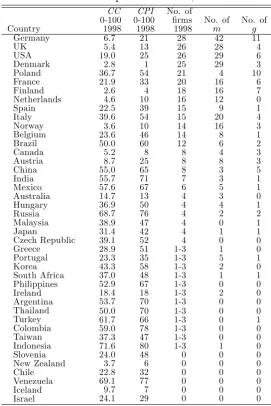
Table 2 lists all countries included in the sample, the Control of Corruption Index in 1998, the Corruption Perception Index in 1998, the number of …rms producing there in 1998, and the sum of all Swedish M&As and green…eld investments in the sample period. Table 2 does not reveal much about the relationship between corruption and form of FDI. The bottom of table shows many countries with very high corruption levels and low levels of Swedish entry. The top part shows low corruption levels coupled with high degrees of M&As and green…eld investments. However, this may simply re‡ect that Swedish multinationals mainly invest in developed European countries which also have lower corruption levels.
4.4 Firm characteristics
The model presented in Section 3 is a highly stylized one written to provide a framework for the empirical analysis. The controls used in the regressions hereafter are inspired both from this simple model and the broader FDI literature.
Firm-speci…c skills. As Markusen (2002) points out, multinationals arise from the use of knowledge capital, a broad term that includes human capital of employees, patents, blueprints and procedures, which are called …rm speci…c skills.
Multinationals can reduce their production costs through extensive use of these skills some of which can be provided to additional plants without reducing their value in existing plants. I use R&D intensity as a proxy for mobile-skills. Mobile is the MNC’s total R&D expenditures divided by total sales at the end of each time period. High-tech …rms are more dependent on their own technology creation and production technology, and as a result are more likely to enter by green…eld investments. Thus, I expect R&D to a¤ect green…eld investments positively -pointed out by the theory in Section 3 as well.
culture. Note that Non-mobile may also represent competitive e¤ects of the bargaining strength. If the MNC already has a¢liates in the host country, it may not want to hurt itself by increasing the competition through a new venture and thus may incline more towards M&As which eliminate rivals. There is a well-established international business literature drawing attention to the di¤erential impact of this variable on entry modes. Previous experience increases the local knowledge and connections of the MNC and thus may foster green…eld investments over cross-border M&As. On the other hand, it may also promote M&As because experienced MNCs are able to monitor their partners more e¤ectively. Therefore, the expected sign is positive for both entry strategies yet the strength of this e¤ect on each entry mode is ambiguous.
Bargaining strength. Market share of the …rm is the most widely used bargaining power measure in the empirical industrial organization literature. There is a lack of data with broad industry and country coverage for the market share of a multinational in industry
j in country k in time t. The next best alternative is using the market concentration in industryj in country kin time t. OECD STAN database o¤ers concentration measures for a limited number of countries and sectors from 1980 to 2000. I used these in my early regressions without much success due to many missing observations and small sample sizes.
Starting back with Anderson and Gatignon (1986), in the international business and management strategy literatures, international experience has been cited as an indicator of low levels of internal uncertainty and greater con…dence in business dealings and thus stronger bargaining positions around the negotiation table. Therefore, in this paper, I assume that multinationals with more international experience are stronger bargainers. A¤world is the number of the previous a¢liates of the MNC all around the world and represents a broad international experience that fosters FDI by MNCs (Caves, 2007). The expected sign for this variable for both entry modes is positive. However, I expect a stronger positive for cross-border M&As since international experience is anticipated to boost the bargaining strength and thus the probability of M&As. I also use …rm size measured by total employment or sales of the …rm as an indicator of the bargaining strength (results not reported in the paper due to brevity but available upon request), since larger …rms with deep pockets are considered to be more experienced and stronger bargainers (See Caves, 2007).
4.5 Country characteristics
Guidance from Blonigen and Piger (2011) is followed to motivate the use of country level controls that are not directly suggested by the model. I include almost all variables with high inclusion probabilities (above 50 percent) for cross-border M&As reported in their worldwide sample.8
8Parent level variables such as parent GDP, parent GDP per capita and parent education level are
Market size (measured by GDP), infrastructure (measured by telephone mainlines per one million people,Tel), skill level of the labor force in the host country (measured by the share of university graduates in the population, Skill), trade openness of the host country (share of trade volume in GDP, Open) and distance (measured by using the great circle formula that calculates the minimum distance along the surface of the earth between Sweden and the host country, Distance) are widely used determinants of entry and are expected to favor both kinds of entry (Brainard (1997), Carr, Markusen and Maskus (2001)). In addition, host country tax rate (measured by corporate tax rate, Tax), double taxation treaties (measured by bilateral tax treaties in e¤ect between Sweden and the host country,DTT), bilateral investment treaties (denoted asBIT) and regional trade agreement (RTA) dummies are included as suggested by Blonigen and Piger (2011). GDP per capita is used to account for the availability of acquisition targets in the host country because it is a broad measure of general level of development. Even though it is easier to …nd sub-contractors and distribution channels in developed countries, which in fact favors entry, another important issue is that a developed country supplies a bigger number of more high quality acquisition targets. It is harder to …nd suitable acquisi-tion targets in less developed countries. Therefore, acquisiacquisi-tions are expected to be more favorable in countries with highGDP/capita.
Direct costs of entry into the host country are not available in the RIIE data set. I use the o¢cial time it takes to start-up a new …rm in the host country as presented in Djankov et al. (2002),Time, as proxy for …xed entry costs.
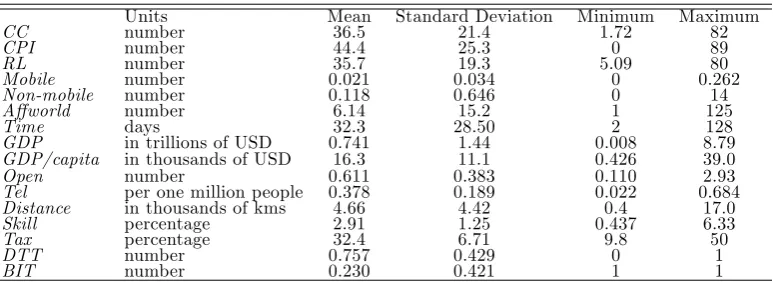
The country-level data are collected from the International Financial Statistics of IMF and the World Development Indicators Database of the World Bank. More information about variables is provided in Table 3.
5
Results
This section presents the results of econometric analysis in three subsections. Due to reasons explained in the previous section, rather than a nested qualitative choice model, I adopt the most general setting where the …rm decides if and how to enter a host country market. Considering the structure of the theoretical model the next best econometric model is a multivariate probit because it allows a ‡exible pattern of conditional covariance among the latent utilities of alternatives.
5.1 FDI decision alone
Other than a few exceptions, an overwhelming majority of the existing work on the e¤ects of corruption on foreign direct investment makes no distinction between the modes of foreign entry. Therefore, in this subsection I begin with the bivariate probit estimates of the e¤ects of corruption on both types of FDI by the Swedish multinational corporations to put the results in perspective with the existing literature.
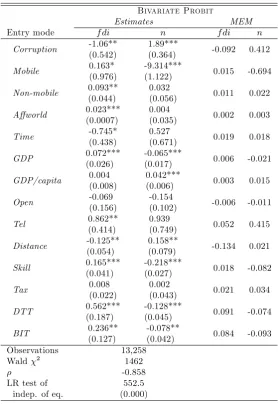
The …rst two columns in Table 4 present the coe¢cient estimates while the last two columns report the marginal e¤ects of explanatory variables on the success probability of each strategy. Marginal e¤ects from the bivariate probit model are obtaind using the method proposed by Greene (1996) where both direct and indirect partial e¤ects (as common in models with multiple equations such as this one) are calculated and added at the means of the explanatory variables. Since the sample size is su¢ciently large, marginal e¤ects at means (MEM) and average marginal e¤ects (AME) are similar. Therefore, only MEMs are reported.9
All regressions in Table 4 include a constant as well as time, industry and RTA …xed e¤ects. Wald 2 is 1462 indicating a good …t. Correlation coe¢cient is signi…cant revealing thatf diandnare not independent from each other as foreign expansion strate-gies.
Corruption proxied by the Control of Corruption measure from the WGI database is signi…cantly negative in equationf di(column 1) and positive and signi…cant in equation
n (column 2), revealing that higher levels of corruption in a host country discourage FDI by Swedish multinationals. This is in line with Hakkala et al. (2008) and Javorcik and Wei (2009) as well as the previous literature where researchers generally have found a signi…cant negative e¤ect of corruption on multinational entry without di¤erentiating between di¤erent entry modes using aggregate data.
Turning to economic size of the estimated parameters, calculations of marginal e¤ects show that a small increase inCorruptionreduce the probability of FDI by 9.2%. Although this is not large in absolute magnitude, compared to the probability evaluated at the sample mean of 2.7% (the success probability of FDI in the sample), this is nevertheless economically meaningful.
Mobile skills of the multinational increase the likelihood off diwith a small marginal e¤ect but reduces the odds fornwith a marginal e¤ect of -69.4%. Experience in the host country (Non-mobile) measured as the number of previous a¢liates in the host country has no e¤ect on probability of no entry, however, it increases the likelihood of FDI. The marginal e¤ect is rather small.
International experience (A¤world), infrastructure (Tel), market size (GDP), labor skill in the host country (Skill) and double taxation and bilateral investment treaties (DTT andBIT) increase the likelihood of FDI as expected while FDI declines in distance (Distance). Trade openness of the host country(Open), time that its takes to start a new
9No standard error or signi…cance indicators are given for marginal e¤ects because Greene (2010) argues
business (Time) and corporate tax rate in the host country (Tax) are not signi…cant.
5.2 M&As versus green…eld investments
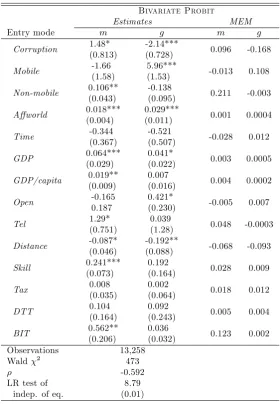
I now turn to the bivariate probit estimates of e¤ects of corruption on new entry by Swedish multinationals. The …rst two columns in Table 5 present the coe¢cient estimates whereas the last two columns report the marginal e¤ects of explanatory variables on the success probability of M&As and green…eld investments. All regressions include a constant as well as time, industry and RTA …xed e¤ects. Wald 2 is 473 indicating a good …t. Correlation coe¢cient is signi…cant revealing that A and G are not independent from each other as strategies.
Corruption is positive and signi…cant at 10% in equation m (column 1) and negative and highly signi…cant in equationg(column 2), revealing that higher levels of corruption in the host country may grease the squeaky wheels in case of M&As while discouraging green…eld investments conducted by Swedish multinationals.
When compared with the recent literature -apart from the fact that none of the recent studies concentrates on M&As at the …rm level- Javorcik and Wei (2009) …nd that in highly corrupt environments, conditional on entry, joint ventures will be the chosen mode of entry rather than wholly owned subsidiaries. The initial result here is consistent with their …nding.
Calculating the marginal e¤ects shows that an in…nitesimal increase in Corruption increases the probability of an M&A by 9.6%. Again, although this seems small in absolute magnitude, compared to the probability evaluated at the sample mean of 2% (the success probability of M&As in the sample), this is economically meaningful. The same marginal e¤ect for a green…eld investment is -16.8%. In other words, a small increase in corruption reduces the likelihood of a green…eld project by about 17%.
Proposition 1 from the theoretical model presented in Section 3 predicts an inverse relationship between corruption and green…eld investments and the empirical …nding here con…rms it. Proposition 2 points to a nonlinear relationship between corruption and M&As. The positive and weakly signi…cant corruption e¤ect on M&As reported in Table 5 is a new result and further investigated in the next subsection.
Swedish MNCs with high Mobile skills favor green…eld investments with a marginal e¤ect of 10.8%. On the other hand,Non-mobile skills always favors cross-border M&As with a large marginal e¤ect of only 21.1% and reduces to odds against green…eld invest-ments, which suggests that Swedish MNCs endowed with stronger connections to local bureaucracy or knowledge of local business culture prefer cross-border M&As to green-…eld FDI. This may also be interpreted as Swedish MNCs with more bargaining power derived from their previous experience in the host market acquire local …rms rather than establishing wholly owned subsidiaries.
only. All of these have relatively small marginal e¤ects on the mode of entry except for BIT. The existence of a bilateral investment treaty between Sweden and the host country increases the probability of having an M&A by 12.3%. Trade openness of the host country(Open), host country infrastructure (Tel), corporate tax rate (Tax), double taxation treaties (DTT) time that its takes to start a new business (Time) are mostly insigni…cant for both types of entry.
5.3 More marginal e¤ects
In the previous section, the e¤ect of corruption on green…eld investments is signi…cant and negative as expected by the FDI literature. The same variable has quite a di¤erent e¤ect on cross-border M&As; it is signi…cant only at 10% nonetheless positive. On the one hand, it is highly preferable to overtake a local …rm with all its knowledge about the host country conditions particularly in countries with high levels of corruption. On the other hand, if the MNC is endowed with high levels of mobile skills such as technological sophistication then a local partner may open the door for leakage of these valuable mobile skills when corruption is high.
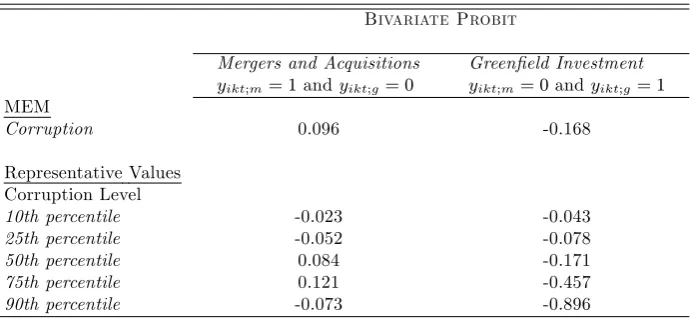
The theoretical model in this paper weighs heavily on such nonlinear interactions. Interaction terms are used extensively in applied econometrics to account for such non-linearities. However, in nonlinear models such as the bivariate probit used here, the magnitude of the interaction e¤ect does not equal the marginal e¤ect of the interaction term. Therefore, to test Propositions 2–6 in the model, I estimate changes in marginal e¤ects for ranges of values (10th, 25th, 50th, 75th and 90th percentiles) for Corruption and evaluate how the marginal e¤ects di¤er across these ranges.
Table 6 shows the marginal e¤ect of Corruption as the corruption level in the host country changes. The marginal e¤ect estimation is executed using the Greene (1996) method. For brevity only the corruption terms are reported. The top part of the table shows the marginal e¤ects at means (MEM) from Table 5 for easier comparison. The bottom part reports how the marginal e¤ect changes across 5 di¤erent ranges reported in the table.
Adding strength to Proposition 1, as corruption in the host country increases the partial e¤ect of corruption on the probability of green…eld investments decline. In other words, in more corrupt environments Swedish multinationals reduce their green…eld in-vestments at increasing rates. In the least corrupt host countries (10th percentile) the marginal e¤ect of corruption on green…eld probability is -4.3% while it reaches almost -90% in the most corrupt host countries (90th percentile).
and internalize the local knowledge of the acquired local …rm as well. The result obtained for the 90th percentile is noteworthy because in the most corrupt countries increasing corruption levels reduce the M&A probability. In other words, as corruption levels pass a certain threshold the multinational’s likelihood of both kinds of entry declines. This result is in line with Javorcik and Wei (2009).
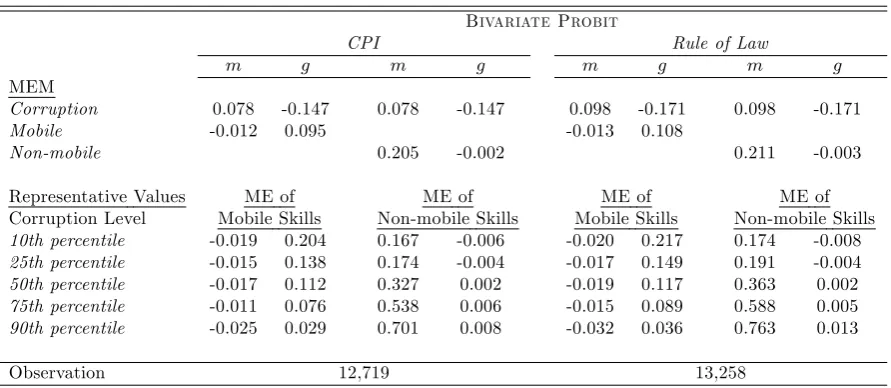
Next, I investigate the change in the marginal e¤ect ofMobile skills for varying corrup-tion levels and report the results in Table 7. Proposicorrup-tions 3 and 4 state that multinacorrup-tionals that are endowed with higher levels of mobile skills are more likely to engage in foreign direct investment. However, this likelihood is dampened in more corrupt host countries, particularly for M&As.
The bottom part of Table 7 shows that the negative impact of corruption on green-…eld investments gets stronger with higher levels of mobile skills. In other words, a multinational with sophisticated technology or novel marketing ideas is a¤ected severely by corruption. While higher levels of mobile skills increases the likelihood of green…eld investment by 21.6% in the least corrupt countries, this rate declines to 3.1% in the most corrupt countries. This result is in line with Proposition 3. The results in Table 7 do not show strong support for Proposition 4. Mobile skills are not strongly relevant for M&As. Neither the direct nor the indirect e¤ects are signi…cant economically.
Finally, I investigate how the usefulness ofNon-mobileskills change as level of corrup-tion changes. Table 8 reports the marginal e¤ect results for non-mobile skills at di¤erent percentiles of Corruption. Propositions 5 and 6 state that multinationals that are en-dowed with higher levels of non-mobile skills are more likely to engage in foreign direct investment. However, this likelihood is higher in more corrupt host countries, particularly for M&As.
The bottom part of Table 8 presents thatNon-mobileskills are almost irrelevant for the probability of conducting green…eld investments, showing little support for Proposition 5. On the other hand, Swedish multinationals increase their M&As by 21.1% on average as their non-mobile skills improve. In the least countries the impact of these skills on M&A probability is 17.1% while it reaches 75.8% in the most corrupt countries. In other words, if the multinational has rich knowledge of local conditions through its previous a¢liates in the host country then its non-mobile skills get even more useful for this …rm. This result is in line with Proposition 6.
5.4 Robustness
Table 9 reports the marginal e¤ects of Mobile and Non-mobile at di¤erent Corruption levels using di¤erent measures of corruption. The …rst four columns report the results with widely used CPI of Transparency International. The next four columns present the results with the Rule of Law measure again from WGI. Results are very similar to the ones in Tables 7 and 8.
di¤erent from the bulk of countries that Swedish MNCs mainly invest.10
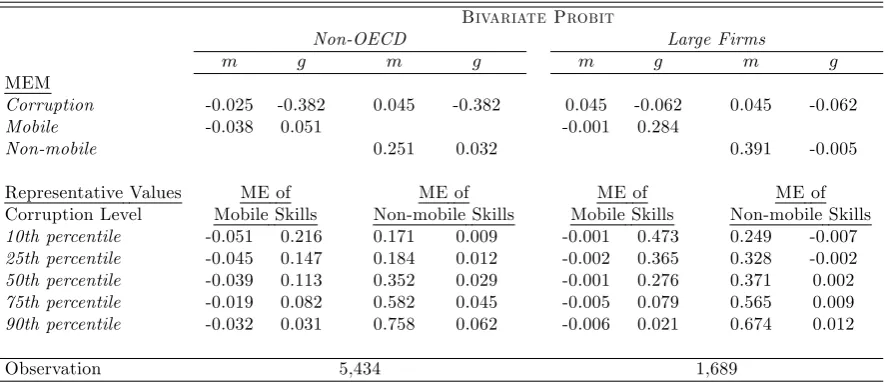
In Table 10, direct e¤ects of corruption are observed for all entry strategies while secondary e¤ects realized through mobile and non-mobile skills remain important. One very notable change in this set of marginal e¤ects is the ‡ip in the sign of Corruption in themequation (Column 1) which suggests that higher levels of corruption reduce the likelihood of M&As in the non-OECD countries. In other words, as corruption levels get very high, the tolerance of the MNCs even with high levels of non-mobile skills diminishes. The very …nal exercise is restricting the sample to large …rms only, although this limits a lot of the time series variation in the sample. For the purposes of this exercise, a large …rm is de…ned as a …rm with 10 or more a¢liates around the globe.11 The results
are reported in the last four columns of Table 10. The direct e¤ect of corruption is smaller in size. Secondary e¤ects are still strong. Multi-a¢liate MNCs have better and wider distribution networks around the globe and most importantly more international experience. Therefore, the M&As and green…eld investments conducted by these …rms might be less prone to changes in corruption. In short, endowment of mobile and non-mobile skills as well as the degree of multinationality matter for how profound the e¤ect of corruption will be on the mode of entry.
6
Conclusion
In the last decade, corruption has become an eminent item on the agenda of the in-ternational institutions. The UN Convention against Corruption, adopted in Mexico in December 2003 is the …rst global instrument embracing a comprehensive range of anti-corruption measures to be taken at the national level. According to the OECD Convention of Combating Bribery of Foreign Public O¢cials in International Business Transactions, which was signed in 1997, and went into e¤ect in 1999, bribery of foreign o¢cials by …rms from member countries is a crime. The 15th International Anti-Corruption Conference (IACC) was completed in November 2012 with record participation from 140 countries and the main message of the conference was ending impunity.
In this paper, I attempt to disentangle the e¤ects of corruption on entry mode deci-sion by carrying out an empirical analysis with rich, …rm-level data on the activities of Swedish MNCs around the globe in manufacturing sectors from 1987 to 1998. A number of propositions emerge from the theoretical framework. As corruption increases multina-tional entry gets discouraged. Corruption reduces the likelihood of green…eld investments while increasing the odds in favor of cross-border M&As. MNCs with higher endowments of mobile skills are more likely to invest in the host country. This likelihood is dampened the higher the degree of corruption in the host country. On the other hand, MNCs with
1 0Most of the countries that Swedish MNCs invest are developed countries which also have lower
cor-ruption levels than average country. Swedish MNCs invest in nearby developed countries because they have lots of potential M&A targets, and these countries just happen to have low levels of corruption cross-sectionally. Even though there are country-level regressors to control for level of development of a country in previous estimations, a more compelling experiment is to restrict the sample to these developed countries only to avoid potentially spurious results. The results are very similar to overall regressions.