ISSN Online: 2158-7086 ISSN Print: 2158-706X
Assessment of Changes in Ice Regime
Characteristics of Russian Lakes and Rivers
under Current Climate Conditions
Valery Vuglinsky
St. Petersburg State University, St. Petersburg, Russia
Abstract
This article deals with assessment of changes in ice cover duration and maximum ice cover thickness for the last three decades compared with the previous period by the example of observation data for 28 hydrometric stations on rivers and 10 hydrological stations on lakes. Estimations of homogeneity and trends of long term serious of above mentioned rivers and lakes ice regime characteristics for three time periods were carried out using Student and Fisher criteria. Assessment of changes in ice regime characteris- tics for the period 1980-2010 compared with the period of stationary climate (from the beginning of observations until 1979) using two methodological approaches was made. The results can be used for solving problems of economy branches adaptation in case of rivers and lakes used in winter con- ditions.
Keywords
Rivers, Lakes, Ice Cover Duration, Maximum Ice Cover Thickness, Assessment of Changes, Last Three Decades
1. Introduction
In recent decades, the issue of assessing changes in hydrological regime of sur-face water bodies in a non-stationary climate has become especially relevant. Over the past 100 years, average annual temperatures on the territory of the Russian Federation have risen by 1.2˚C, which resulted in noticeable changes in hydrological regime of many rivers and lakes of the country. Studies of these changes are mainly focused on water resources and water balance of rivers as these are two major factors shaping the dynamics of water use both annually and inter-annually, which is critically important in planning and implementation of How to cite this paper: Vuglinsky, V.
(2017) Assessment of Changes in Ice Re-gime Characteristics of Russian Lakes and Rivers under Current Climate Conditions. Natural Resources, 8, 416-431.
https://doi.org/10.4236/nr.2017.86027
Received: January 9, 2017 Accepted: June 17, 2017 Published: June 21, 2017
Copyright © 2017 by author and Scientific Research Publishing Inc. This work is licensed under the Creative Commons Attribution International License (CC BY 4.0).
http://creativecommons.org/licenses/by/4.0/
different water management projects in river basins. Very few studies are fo-cused on surface water bodies’ ice regime characteristics. However, it is known that such characteristics of river and lake ice regime as dates of ice-on and ice-off, duration of ice cover and ice thickness are highly important and some-times limiting factors in winter operation of these water bodies. The dates of ice-on and ice-off and duration of ice cover determine navigation, hydraulic construction in cold period, construction of ice roads and bridges. Ice thickness is a major factor in evaluating the bearing capacity and duration of river and lakes ice bridges and roads. It is for this reason that the issue of assessing changes in ice regime of lakes and rivers, both in current and possible future climate conditions, is of undoubted importance. This issue is not being ad-dressed; it will not be possible to maximize the efficiency of operation of rivers and lakes in cold and winter periods when ice phenomena are favorable for some economic activities and at the same time restrictive for others.
2. Status of Research
In the Russian Federation, research in the field of climate change impact on sur-face water bodies ice regime has begun relatively recently—since the early 1990s. Scientists from the Hydrometeorological centre of Russia (B.M. Ginzburg, I.I. Soldatova) who had studied long-term variations of freeze-up and break-up dates in different geographical zones of Russia in 1891-1985 and their relation-ship with air temperature fluctuations in the Northern Hemisphere revealed un-idirectional trends in variations of freeze-up and break-up dates with similar ice regime conditions [1].
Since the end of the 1990s, research in changes of ice regime of surface water bodies began at the State Hydrological Institute (St. Petersburg, Russia). Case studies of individual rivers and water bodies were used initially also with respect to freeze-up and break-up dates. In general, trends in long-term changes of the freeze-up and break-up dates over the past 50 - 100 years were analyzed [2]. Over the subsequent 10 years, the scope of characteristics to be analyzed was ex-tended to include changes in ice cover duration and maximum ice thickness. It was found that the period since the beginning of the 1980’s has seen the sharp rise in the degree of changes in water bodies ice regime [3] [4]. These changes are diverse for water bodies located in different natural zones. The main focus in these studies was on the Arctic rivers of Russia [5].
Outside Russia, since the end of the 1990s, the most extensive research was done in Canada, Finland and the USA [6] [7] [8]. In the last decade of the XX century, scientists from the USA initiated an international project on assessment of historical trends of freeze-up and break-up dates on rivers and lakes in the Northern Hemisphere. The project involved scientists from Canada and Finland and the outputs were published in the Science Journal [9]. Further studies in this field were mainly done in Canada (T. Prowse, B. R. Bonsal, C. R. Duguay).
auspices of АМАР (Arctic Monitoring and Assessment Programme). The find-ings of the project have been summarized in a fundamental monograph with a specific chapter Lake and river ice addressing changes in the ice regime of the Arctic surface water bodies [10] [11] [12]. The author of the present article was the co-author of the chapter. It should be noted that research conducted outside Russia mainly focus on freeze-up and break-up dates and assessment of their trends.
Looking at the Russian research activities, one can outline the following major findings:
1. Determined are the features of long-term changes in river and lake ice re-gime, both for separate natural regions and for individual water bodies.
2. Revealed is a clear trend towards strengthening of the gradient of changes in ice regime characteristics since the early 1980’s. The role of the climate com-ponent in these changes is not so clear.
3. There have been only general efforts to assess future changes in surface wa-ter bodies ice regime. The methodology for such assessment is currently at an early stage of development.
In view of the above, there is a need to enhance the research, first, in further development of methodologies to assess past and, especially, expected future changes in river and lake ice regime in close connection with climate indicators and their projected changes. Secondly, the scope of the research should be ex-tended to include more rivers and lakes of Russia for which such assessments are made, including for the next 15 - 20 years.
The present article describes the findings of the research in changes of the ice regime characteristics of rivers and lakes located in the main natural zones of Russia over the past three decades.
3. Methodology and Input Data
Long-term series of ice cover duration and maximum ice thickness from the Water Cadastre of Russia were used as input data. Ice cover duration is a period since the appearance of stationary ice on a river or lake in autumn until the start of ice drift in spring.
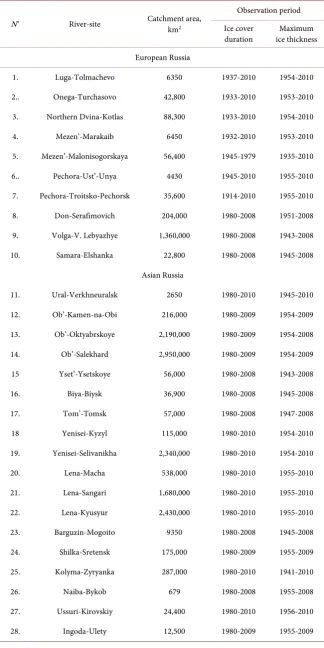
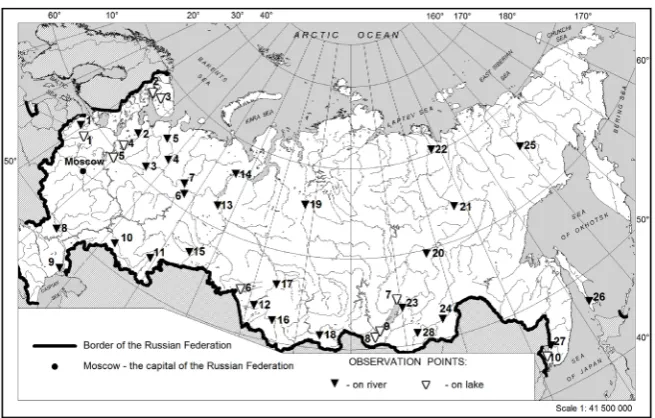
Data from 28 gauging sites on 21 river and 10 observing sites on 8 lakes in all major natural regions of Russia were used in the assessment. All input informa-tion and data were downloaded in a special electronic database. Figure 1 pro-vides a sketch map of observing sites on rivers and lakes used in the assessment.
The criteria for selection of sites was the length of time series which were gen-erally not shorter than 55 - 56 years ending in 2010 (in some cases in 2008 or 2009). Table 1 presents information on observing sites in rivers used for the as-sessment.
The information on lake sites used in the assessments is presented in the Ta-ble 2.
Table 1. Observing sites on rivers and length of observation periods.
N˚ River-site Catchment area, km2
Observation period Ice cover
duration ice thickness Maximum European Russia
1. Luga-Tolmachevo 6350 1937-2010 1954-2010
2.. Onega-Turchasovo 42,800 1933-2010 1953-2010
3. Northern Dvina-Kotlas 88,300 1933-2010 1954-2010
4. Mezen’-Marakaib 6450 1932-2010 1953-2010
5. Mezen’-Malonisogorskaya 56,400 1945-1979 1935-2010
6.. Pechora-Ust’-Unya 4430 1945-2010 1955-2010
7. Pechora-Troitsko-Pechorsk 35,600 1914-2010 1955-2010
8. Don-Serafimovich 204,000 1980-2008 1951-2008
9. Volga-V. Lebyazhye 1,360,000 1980-2008 1943-2008
10. Samara-Elshanka 22,800 1980-2008 1945-2008
Asian Russia
11. Ural-Verkhneuralsk 2650 1980-2010 1945-2010
12. Ob’-Kamen-na-Obi 216,000 1980-2009 1954-2009
13. Ob’-Oktyabrskoye 2,190,000 1980-2009 1954-2008
14. Ob’-Salekhard 2,950,000 1980-2009 1954-2009
15 Yset’-Ysetskoye 56,000 1980-2008 1943-2008
16. Biya-Biysk 36,900 1980-2008 1945-2008
17. Tom’-Tomsk 57,000 1980-2008 1947-2008
18 Yenisei-Kyzyl 115,000 1980-2010 1954-2010
19. Yenisei-Selivanikha 2,340,000 1980-2010 1954-2010
20. Lena-Macha 538,000 1980-2010 1955-2010
21. Lena-Sangari 1,680,000 1980-2010 1955-2010
22. Lena-Kyusyur 2,430,000 1980-2010 1955-2010
23. Barguzin-Mogoito 9350 1980-2008 1945-2008
24. Shilka-Sretensk 175,000 1980-2009 1955-2009
25. Kolyma-Zyryanka 287,000 1980-2010 1941-2010
26. Naiba-Bykob 679 1980-2008 1955-2008
27. Ussuri-Kirovskiy 24,400 1980-2010 1956-2010
Figure 1. Observing sites on rivers and lakes.
Table 2. Observing sites on lakes and length of observation periods.
N˚ Lake-site Area, km2
Observation period Ice cover
duration Maximum ice thickness
1. Ilmen’-Voitsy 982 1916-1980 1946-1980
2. Imandra-Zasheek 876 1945-2008 1945-2008
3. Lovozero-Lovozero 200 1946-2008 1946-2008
4. Lacha-Nokola 356 1918-2008 1940-2008
5. Kubenskoye-Korobovo 370 1931-2008 1932-2008
6. Chany-Kvashnino 1030 1933-2010 1943-2010
7. Baikal-Nizhneangarsk 31,500 1936-2008 1946-2008
8. Baikal-Baikal 31,500 1926-1980 1945-2009
9. Baikal-Peschanaya Bukhta 31,500 1931-2008 1945-2008
10. Khanka-Astrakhanka 4070 1936-2008 1945-2008
riod—since the beginning of observations until 2010, first stationary climate pe-riod—since the beginning of observations until 1979 and second non-stationary climate period—1980-2010).
4. Assessment of Homogeneity of Long-Term
Ice Regime Series
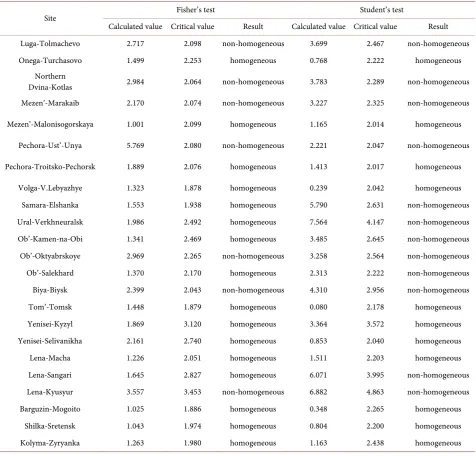
abovemen-tioned periods—from the beginning of observations until 1979 and from 1980 to 2010. Table 3 below provides the results of long-term series homogeneity as-sessments for maximum ice thickness on rivers.
[image:6.595.61.538.282.738.2]Analysis of data in Table 3 demonstrated that for maximum ice cover on riv-ers the homogeneity hypothesis has proved not to be true by both criteria for seven gauging sites (Luga-Tolmachevo, Northen Dvina-Kotlas, Mezen’-Mara- kaib, Pechora-Ust’-Unya, Ob’-Oktyabrskoye, Biya-Biysk and Lena-Kyusyur). Looking ahead, one can mention that for the above gauging sites the analysis of trends (to be discussed below) demonstrated either multidirectional trends in the first and second periods (Northen Dvina-Kotlas, Pechora-Ust’-Unya, Ob’- Oktyabrskoye, Biya-Biysk) or highly different trend gradients when comparing two periods (Luga-Tolmachevo, Mezen’-Marakaib, Lena-Kyusyur). The same
Table 3. Homogeneity tests for long-term series of maximum ice thickness on rivers.
Site Fisher’s test Student’s test
Calculated value Critical value Result Calculated value Critical value Result
Luga-Tolmachevo 2.717 2.098 non-homogeneous 3.699 2.467 non-homogeneous
Onega-Turchasovo 1.499 2.253 homogeneous 0.768 2.222 homogeneous
Northern
Dvina-Kotlas 2.984 2.064 non-homogeneous 3.783 2.289 non-homogeneous
Mezen’-Marakaib 2.170 2.074 non-homogeneous 3.227 2.325 non-homogeneous
Mezen’-Malonisogorskaya 1.001 2.099 homogeneous 1.165 2.014 homogeneous
Pechora-Ust’-Unya 5.769 2.080 non-homogeneous 2.221 2.047 non-homogeneous
Pechora-Troitsko-Pechorsk 1.889 2.076 homogeneous 1.413 2.017 homogeneous
Volga-V.Lebyazhye 1.323 1.878 homogeneous 0.239 2.042 homogeneous
Samara-Elshanka 1.553 1.938 homogeneous 5.790 2.631 non-homogeneous
Ural-Verkhneuralsk 1.986 2.492 homogeneous 7.564 4.147 non-homogeneous
Ob’-Kamen-na-Obi 1.341 2.469 homogeneous 3.485 2.645 non-homogeneous
Ob’-Oktyabrskoye 2.969 2.265 non-homogeneous 3.258 2.564 non-homogeneous
Ob’-Salekhard 1.370 2.170 homogeneous 2.313 2.222 non-homogeneous
Biya-Biysk 2.399 2.043 non-homogeneous 4.310 2.956 non-homogeneous
Tom’-Tomsk 1.448 1.879 homogeneous 0.080 2.178 homogeneous
Yenisei-Kyzyl 1.869 3.120 homogeneous 3.364 3.572 homogeneous
Yenisei-Selivanikha 2.161 2.740 homogeneous 0.853 2.040 homogeneous
Lena-Macha 1.226 2.051 homogeneous 1.511 2.203 homogeneous
Lena-Sangari 1.645 2.827 homogeneous 6.071 3.995 non-homogeneous
Lena-Kyusyur 3.557 3.453 non-homogeneous 6.882 4.863 non-homogeneous
Barguzin-Mogoito 1.025 1.886 homogeneous 0.348 2.265 homogeneous
Shilka-Sretensk 1.043 1.974 homogeneous 0.804 2.200 homogeneous
reasons lie behind cases when non-homogeneity is determined by one of the cri-teria. The homogeneity hypothesis by the Student’s test has proved not to be true for the cases when trend gradients vary greatly for two periods (Ob’-Kamen’- na-Obi, Ob’-Salekhard, Ural-Verkhneuralsk, Lena-Sangary), which can be ex-plained by differences in mean values for both periods.
In regard to the long-term series of ice cover duration on rivers, the homo-geneity hypothesis has proved not to be true by both criteria only for the Me-zen’-Marakaib gauging site (as well as for the maximum ice thickness).
Long-term series of ice thickness on lakes have proved to be homogeneous by both criteria for five gauging sites. It is only for one site (lake Kubenskoye-Ku- benskoye) that the hypothesis has proved not to be true by both criteria. The main reason for that are different trend gradients for both periods. The same reason lies behind non-homogeneity by Student’s test of maximum ice thickness long-term series of the lakes Lacha-Nokolo and Khanka-Astrakhanka.
Long-term series of ice cover duration for six lake observing sites have proved to be homogeneous by both criteria. It is only for two sites (lake Baikal-Baikal and lake Khanka-Astrakhanka) that the time series have proved non-homoge- neous by the Student’s t-test, which, judging by the trend analysis, can be ex-plained by differences in trend gradients for both periods and, accordingly, by differences in mean values for both periods.
Summarizing the results of the assessment, a very important trend can be ob-served: if time series of maximum ice thickness of an observing site are non-homogeneous by both criteria, the same is the case for the time series of duration of ice cover by both or only one criteria. The examples of such sites on rivers are Luga-Tolmachevo, Northen Dvina-Kotlas and Mezen’-Marakaib. This can be explained by the fact that sharp fluctuations of average ice cover duration for a long period are usually accompanied by changes in average maximum ice thickness for the same period. For example, if a series of harsh winters with pro-longed ice cover duration is observed, average maximum ice thickness increases for the same period and vice versa.
5. Assessment of Trends of Long-Term Series of Ice
Regime Characteristics
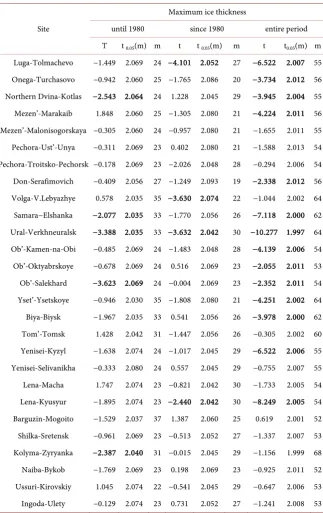
Trends of long-term series were assessed by the Student’s t-test for three time intervals. Table 4 provides the results of the assessment for maximum ice thick-ness.
The table provides the following values needed to check the trend significance (i.e. to test the hypothesis of the ice regime characteristics linear regression coef-ficient equal zero):
a t=a S
where a—the regression coefficient, Sa—its root-mean-square deviation, t0.05(m)—
Table 4. Assessment of trends of long-term series of maximum ice thickness on rivers.
Site
Maximum ice thickness
until 1980 since 1980 entire period
T t 0.05(m) m t t 0.05(m) m t t0.05(m) m Luga-Tolmachevo −1.449 2.069 24 −4.101 2.052 27 −6.522 2.007 55 Onega-Turchasovo −0.942 2.060 25 −1.765 2.086 20 −3.734 2.012 56 Northern Dvina-Kotlas −2.543 2.064 24 1.228 2.045 29 −3.945 2.004 55 Mezen’-Marakaib 1.848 2.060 25 −1.305 2.080 21 −4.224 2.011 56 Mezen’-Malonisogorskaya −0.305 2.060 24 −0.957 2.080 21 −1.655 2.011 55 Pechora-Ust’-Unya −0.311 2.069 23 0.402 2.080 21 −1.588 2.013 54 Pechora-Troitsko-Pechorsk −0.178 2.069 23 −2.026 2.048 28 −0.294 2.006 54 Don-Serafimovich −0.409 2.056 27 −1.249 2.093 19 −2.338 2.012 56 Volga-V.Lebyazhye 0.578 2.035 35 −3.630 2.074 22 −1.044 2.002 64 Samara−Elshanka −2.077 2.035 33 −1.770 2.056 26 −7.118 2.000 62 Ural-Verkhneuralsk −3.388 2.035 33 −3.632 2.042 30 −10.277 1.997 64 Ob’-Kamen-na-Obi −0.485 2.069 24 −1.483 2.048 28 −4.139 2.006 54 Ob’-Oktyabrskoye −0.678 2.069 24 0.516 2.069 23 −2.055 2.011 53 Ob’-Salekhard −3.623 2.069 24 −0.004 2.069 23 −2.352 2.011 54 Yset’-Ysetskoye −0.946 2.030 35 −1.808 2.080 21 −4.251 2.002 64 Biya-Biysk −1.967 2.035 33 0.541 2.056 26 −3.978 2.000 62 Tom’-Tomsk 1.428 2.042 31 −1.447 2.056 26 −0.305 2.002 60 Yenisei-Kyzyl −1.638 2.074 24 −1.017 2.045 29 −6.522 2.006 55 Yenisei-Selivanikha −0.333 2.080 24 0.557 2.045 29 −0.755 2.007 55 Lena-Macha 1.747 2.074 23 −0.821 2.042 30 −1.733 2.005 54 Lena-Kyusyur −1.895 2.074 23 −2.440 2.042 30 −8.249 2.005 54 Barguzin-Mogoito −1.529 2.037 37 1.387 2.060 25 0.619 2.001 52 Shilka-Sretensk −0.961 2.069 23 −0.513 2.052 27 −1.337 2.007 53 Kolyma-Zyryanka −2.387 2.040 31 −0.015 2.045 29 −1.156 1.999 68 Naiba-Bykob −1.769 2.069 23 0.198 2.069 23 −0.925 2.011 52 Ussuri-Kirovskiy 1.045 2.074 22 −0.541 2.045 29 −0.647 2.006 53 Ingoda-Ulety −0.129 2.074 23 0.731 2.052 27 −1.241 2.008 53
The test of hypothesis of the regression coefficient equal zero consisted in comparison of absolute value t with t0.05(m). If |t| > t0.05(m), the hypothesis is
discarded with error probability 0.05 (trend is significant). If not, there is no reason to discard the hypothesis (the trend is insignificant).
Calculated and critical statistical values for the periods with statistically sig-nificant trends are shown in bold.
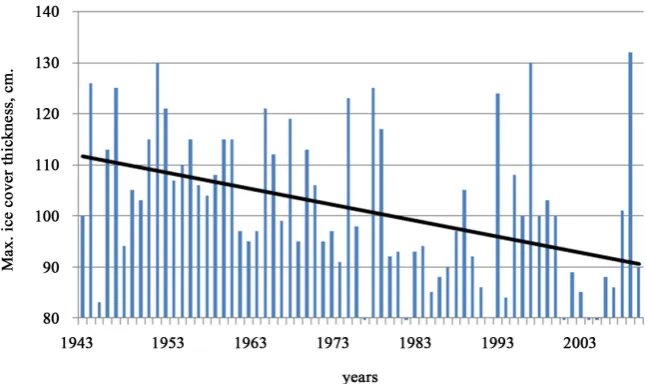
cases out of 28) are obtained for the entire period. As for the two separate pe-riods, the number of statistically significant trends is much smaller (four trends for the first period and three—for the second). It is noteworthy that statistically significant trends for complete time-series have been obtained for many gauging sites with non-homogeneous long-term series (Luga-Tolmachevo, Northen Dvina-Kotlas, Mezen’-Marakaib, Ob’-Oktyabrskoye, Biya-Biysk, Lena-Kyusyur), which is indicative of past changes in maximum ice thickness formation condi-tions in the past 60 - 70 years. Figure 2 shows as an example a diagram of changes in maximum ice thickness on the Lena river at Kyusyur site which gives visual representation of the trend for 1955-2010.
As for long-term series of ice cover duration, it is only for seven gauging sites that total assessment of trends was made for all the three periods. For the rest of the sites, assessment was made only for the second period due to absence of data.
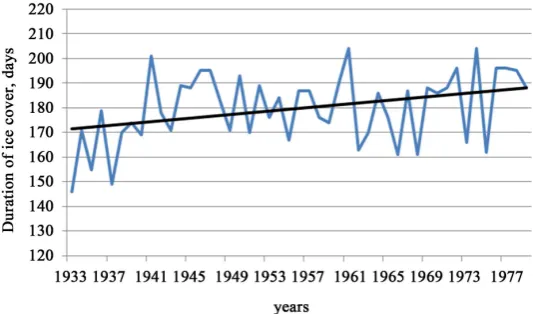
[image:9.595.237.503.386.511.2]For all the three periods, statistically significant trends were obtained for the same sites as they were obtained for maximum ice thickness but not always for the same periods. For example, for the Luga-Tolmachevo site, statistically signif-icant trend was obtained for the entire period, while for the Northen Dvina- Kotlas, Mezen’-Marakaib and Pechora-Troitsko-Pechorsk they were obtained only for the first period (Figure 3) and for Ural-Verkhneuralsk—for the second one.
Figure 2. Changes in annual maximum ice thickness in 1955-2010 (Lena-Kyusyur).
[image:9.595.240.507.557.714.2]For those sites which had time-series only for the second period, statistically significant trends were obtained for the sites Iset’-Isetskoye, Yenisei-Selivanikha, Lena-Macha, Lena-Kyusyur, Ussuri-Kirovskiy and Kolyma-Zyryanka. It is worth noting that for four out of six abovementioned sites statistically significant trends were obtained also for time-series of maximum ice thickness.
Statistically significant trends in long-term series of maximum ice thickness on lakes were obtained for the lakes Ilmen-Voitsy and Kubenskoye-Korobovo (entire series and second period), Imandra-Zasheek, Lovozero-Lovozero (second period) and Chany-Kvashnino (entire period) (Figure 4).
For the series of ice cover duration, statistically significant trends were ob-tained for the lakes Imandra-Zasheek, Lovozero-Lovozero (first period), Chany- Kvashnino, Khanka-Astrakhanka (entire series and second period) and Baikal- Baikal (entire series). It is easy to show that for three abovementioned lakes sta-tistically significant trends were obtained for both maximum ice thickness and ice cover duration (Imandra-Zasheek, Lovozero-Lovozero, Chany-Kvashnino. It should also be noticed that long-term series of maximum ice thickness for Ku-benskoye-Korobovo, for which a significant trend was obtained, proved to be non-homogeneous as well as ice cover duration series with significant trends for Baikal-Baikal and Khanka-Astrakhanka.
6. Assessment of Changes in Ice Regime Characteristics of
Rivers and Lakes for Non-Stationary Climate Period
[image:10.595.212.536.520.712.2]Changes in ice regime characteristics were assessed for the second period 1980- 2010 relative to the first period of conditionally stationary climate (since the be-ginning of observations until 1979). Large scale chronological graphs of annual values of ice regime characteristics with frequent divisions of vertical axis spac-ing for 1980-2010 for all sites on lakes and rivers were used for this purpose. Trend lines were plotted on the graphs and values corresponding to the last and the first years in the series were taken. Difference of these two relative to a num-
ber of years in a series defines the gradient (Δ) of temporal changes of a para-meter. For the sake of convenience, the gradients were calculated relative to a decade and expressed either in cm/decade (for maximum ice thickness series) or in day/decade (for ice cover duration series). In order to evaluate the degree of significance of the obtained trends they were related to mean values of the cor-responding characteristics calculated for the stationary climate period (since the beginning of observations until 1979). Table 5 and Table 6 provide changes in ice regime characteristics of rivers (%) characterized by coefficient K calculated as a reminder of the gradient obtained for the series since 1980 (expressed as ΔΧ2 for maximum ice thickness and ΔY2, for ice cover duration) and average
value of a characteristic for the series until 1979 (expressed as Χ1 for maximum
[image:11.595.208.539.294.736.2]ice thickness and Y1 for ice cover duration).
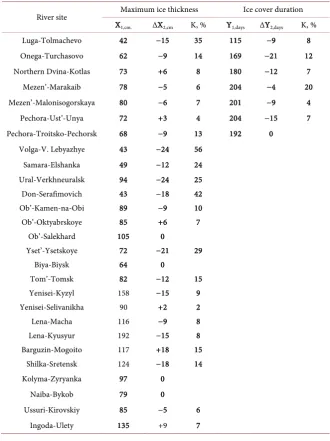
Table 5. Changes in ice regime characteristics of rivers К(%) by trends for the second
pe-riod relative to their mean values for the first pepe-riod.
River site Maximum ice thickness Ice cover duration Χ1,cm. ΔΧ2,cm K, % Y1,days ΔY2,days K, %
Luga-Tolmachevo 42 −15 35 115 −9 8
Onega-Turchasovo 62 −9 14 169 −21 12
Northern Dvina-Kotlas 73 +6 8 180 −12 7
Mezen’-Marakaib 78 −5 6 204 −4 20
Mezen’-Malonisogorskaya 80 −6 7 201 −9 4
Pechora-Ust’-Unya 72 +3 4 204 −15 7
Pechora-Troitsko-Pechorsk 68 −9 13 192 0
Volga-V. Lebyazhye 43 −24 56
Samara-Elshanka 49 −12 24
Ural-Verkhneuralsk 94 −24 25
Don-Serafimovich 43 −18 42
Ob’-Kamen-na-Obi 89 −9 10
Ob’-Oktyabrskoye 85 +6 7
Ob’-Salekhard 105 0
Yset’-Ysetskoye 72 −21 29
Biya-Biysk 64 0
Tom’-Tomsk 82 −12 15
Yenisei-Kyzyl 158 −15 9
Yenisei-Selivanikha 90 +2 2
Lena-Macha 116 −9 8
Lena-Kyusyur 192 −15 8
Barguzin-Mogoito 117 +18 15
Shilka-Sretensk 124 −18 14
Kolyma-Zyryanka 97 0
Naiba-Bykob 79 0
Ussuri-Kirovskiy 85 −5 6
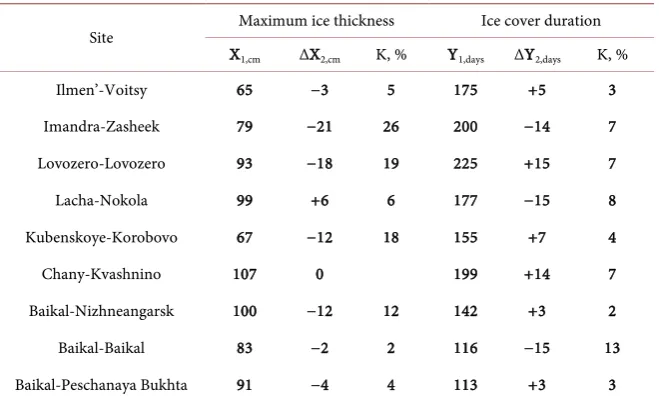
Table 6. Changes in ice regime characteristics (%) obtained from trends for the second period relative to their mean values for the first period.
Site Maximum ice thickness Ice cover duration
Χ1,cm ΔΧ2,cm K, % Y1,days ΔY2,days K, %
Ilmen’-Voitsy 65 −3 5 175 +5 3
Imandra-Zasheek 79 −21 26 200 −14 7
Lovozero-Lovozero 93 −18 19 225 +15 7
Lacha-Nokola 99 +6 6 177 −15 8
Kubenskoye-Korobovo 67 −12 18 155 +7 4
Chany-Kvashnino 107 0 199 +14 7
Baikal-Nizhneangarsk 100 −12 12 142 +3 2
Baikal-Baikal 83 −2 2 116 −15 13
Baikal-Peschanaya Bukhta 91 −4 4 113 +3 3
For some rivers, parameters related to ice cover duration are not reflected in
Table 5 due to absence of data needed to calculate mean values of a parameter
for the first period.
Analysis of data in Table 5 demonstrates that for many rivers gradients of changes in maximum ice thickness relative to mean value of a parameter for previous period amount to 15% and more. Such gradients are especially signifi-cant for southern rivers of the European Russia (Volga-Verkhnee Lebyazhye— 56%, Samara-Elshanka—24%, Don-Belyaevsky—42%). First, for these rivers mean values of the parameters for the first period are small (43 - 49 cm) com-pared with the same values, for example, for the Siberian rivers (2 - 3 times greater for maximum ice thickness). Secondly, for many rivers of the Asian Rus-sia these gradients are equal to or 10% greater than mean values for the previous period (Ob’-Kamen-na-Obi, Tom’-Tomsk, Yset’-Ysetskoye, Barguzin-Mogoito, Shilka-Sretensk), although these mean values themselves are quite large amount- ing to 80 - 120 cm.
As for the relations of gradients of ice cover duration to mean values of this parameter for the first period, they do not exceed 10% - 15% for the rivers in question, from which it can be concluded that changes in maximum ice thick-ness for the past 30-year period occur more intensively than those in ice cover duration.
Data in Table 6 indicate that maximum values of coefficient K for maximum ice thickness are typical for lakes of the Kola Peninsula (Imandra-Zasheek— 26%, Lovozero-Lovozero—19%) and for the lake Kubenskoye-Korobovo (18%). For the rest of the lakes these coefficients do not exceed 10% - 12%.
Baikal it amounted to 13%), which proves the previous conclusion that for rivers changes in maximum ice thickness for the past 30 years occur more intensively compared with changes in ice cover duration.
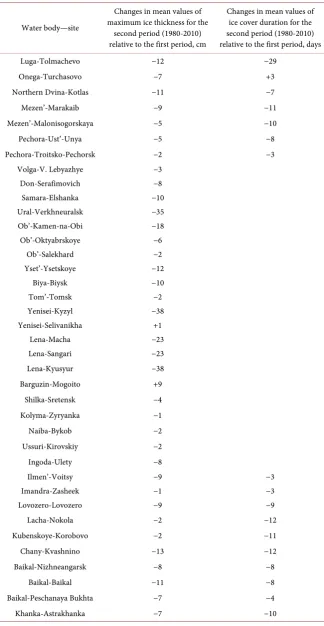
A comparison was made of mean values of the characteristics in question ob-tained from time series of the second period with mean values of the same cha-racteristics obtained from the first period time series. The results of the compar-ison are given in Table 7.
Analyzing data in Table 7 one can observe that in most cases values of changes in both maximum ice thickness and ice cover duration are negative. The largest negative changes are typical for rivers of the Asian Russia, e.g. for the site Ural-Verkhneuralsk they amounted to −35 cm, for Yenisei-Kyzyl and Lena- Kyusyur −38 cm. In most cases, the above changes for rivers do not exceed 10 - 12 cm. The latter is typical also for data on ice cover duration on rivers— nega-tive changes in mean values for the second period relanega-tive to the first one are in the range of 10 days except for the Luga-Tolmachevo site for which it was 29 days. For lakes, all the obtained changes in mean values of ice regime characteristics are negative and relatively small. For maximum ice thickness they were equal to 1 to 13 cm and for ice cover duration 3 to 12 days.
Three cases demonstrated positive values of changes for both maximum ice thickness (Yenisei-Selivanikha +1 cm; Barguzin-Mogoito +19 cm.) and ice cover duration (Onega-Turchasovo +3 days). It is worth noting that positive changes in mean values over the past period are not always indicative of positive trend of a parameter for the entire period (since the beginning of observations until 2010). It appeared negative for two out of three abovementioned sites (Yeni-sei-Selivanikha—1 cm/decade; Onega-Turchasovo—2 cm/decade) and only for the site Barguzin-Mogoito the trend of maximum ice cove thickness changes was positive for the entire period (+2 cm/decade).
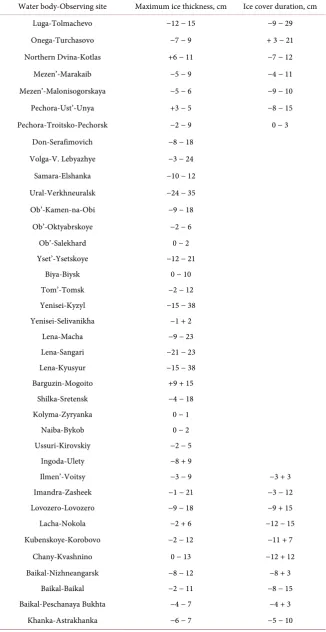
In order to integrate assessments of changes in ice regime parameters of all the abovementioned rivers and lakes in 1980-2010, data on trends for the second period (Table 5 and Table 6) were integrated with assessment of changes in mean values for the non-stationary period (1980-2010) relative to mean values for the previous period (Table 7). Integrated values of changes in maximum ice thickness and ice cover duration over non-stationary period (1980-2010) relative to the previous period are given in Table 8.
7. Summary
The study found that maximum ice thickness on the rivers of the European Rus-sia in 1980-2010 decreased in general by 10% - 15%. It is only for the Luga- Tolmachevo site that this decrease amounted to more than 30% compared with the previous period (42 cm). For the rivers of the Asian Russia, decrease in maximum ice thickness amounted to 10% - 20% except for the site Ural- Verkhneuralsk where it is estimated at 25% - 35%.
Table 7. Changes in mean values of maximum ice thickness and ice cover duration for the period of non-stationary climate (1980-2010) relative to mean values for the previous period.
Water body—site
Changes in mean values of maximum ice thickness for the
second period (1980-2010) relative to the first period, cm
Changes in mean values of ice cover duration for the second period (1980-2010) relative to the first period, days
Luga-Tolmachevo −12 −29
Onega-Turchasovo −7 +3
Northern Dvina-Kotlas −11 −7
Mezen’-Marakaib −9 −11
Mezen’-Malonisogorskaya −5 −10
Pechora-Ust’-Unya −5 −8
Pechora-Troitsko-Pechorsk −2 −3
Volga-V. Lebyazhye −3
Don-Serafimovich −8
Samara-Elshanka −10
Ural-Verkhneuralsk −35
Ob’-Kamen-na-Obi −18
Ob’-Oktyabrskoye −6
Ob’-Salekhard −2
Yset’-Ysetskoye −12
Biya-Biysk −10
Tom’-Tomsk −2
Yenisei-Kyzyl −38
Yenisei-Selivanikha +1
Lena-Macha −23
Lena-Sangari −23
Lena-Kyusyur −38
Barguzin-Mogoito +9
Shilka-Sretensk −4
Kolyma-Zyryanka −1
Naiba-Bykob −2
Ussuri-Kirovskiy −2
Ingoda-Ulety −8
Ilmen’-Voitsy −9 −3
Imandra-Zasheek −1 −3
Lovozero-Lovozero −9 −9
Lacha-Nokola −2 −12
Kubenskoye-Korobovo −2 −11
Chany-Kvashnino −13 −12
Baikal-Nizhneangarsk −8 −8
Baikal-Baikal −11 −8
Baikal-Peschanaya Bukhta −7 −4
Table 8. Assessment of changes in maximum ice thickness and ice cover duration over non-stationary climate period (1980-2010) relative to the previous period.
Water body-Observing site Maximum ice thickness, cm Ice cover duration, cm
Luga-Tolmachevo −12 − 15 −9 − 29
Onega-Turchasovo −7 − 9 + 3 − 21
Northern Dvina-Kotlas +6 − 11 −7 − 12
Mezen’-Marakaib −5 − 9 −4 − 11
Mezen’-Malonisogorskaya −5 − 6 −9 − 10
Pechora-Ust’-Unya +3 − 5 −8 − 15
Pechora-Troitsko-Pechorsk −2 − 9 0 − 3
Don-Serafimovich −8 − 18
Volga-V. Lebyazhye −3 − 24
Samara-Elshanka −10 − 12
Ural-Verkhneuralsk −24 − 35
Ob’-Kamen-na-Obi −9 − 18
Ob’-Oktyabrskoye −2 − 6
Ob’-Salekhard 0 − 2
Yset’-Ysetskoye −12 − 21
Biya-Biysk 0 − 10
Tom’-Tomsk −2 − 12
Yenisei-Kyzyl −15 − 38
Yenisei-Selivanikha −1 + 2
Lena-Macha −9 − 23
Lena-Sangari −21 − 23
Lena-Kyusyur −15 − 38
Barguzin-Mogoito +9 + 15
Shilka-Sretensk −4 − 18
Kolyma-Zyryanka 0 − 1
Naiba-Bykob 0 − 2
Ussuri-Kirovskiy −2 − 5
Ingoda-Ulety −8 + 9
Ilmen’-Voitsy −3 − 9 −3 + 3
Imandra-Zasheek −1 − 21 −3 − 12
Lovozero-Lovozero −9 − 18 −9 + 15
Lacha-Nokola −2 + 6 −12 − 15
Kubenskoye-Korobovo −2 − 12 −11 + 7
Chany-Kvashnino 0 − 13 −12 + 12
Baikal-Nizhneangarsk −8 − 12 −8 + 3
Baikal-Baikal −2 − 11 −8 − 15
Baikal-Peschanaya Bukhta −4 − 7 −4 + 3
Maximum ice thickness on the above lakes decreased by 10% - 15% in 1980- 2010. As for decrease in ice cover duration, the negative gradient is estimated at 5% - 10% compared with the previous period.
References
[1] Ginzburg, B.M. and Soldatova, I.I. (1996) Long-Term Oscillations of River Freezing and Breakup Dates in Different Geographical Zones. Russian Meteorology and Hydrology (Meteorologiya i gydrologiya), № 6, 101-108 (in Russian).
[2] Vuglinsky, V.S. (2001) Extremely Early and Late Dates of Lake Freezing and Ice Break-Up in Russia. Verhandlungen des Internationalen Verein Limnologie, 27, 2793-2795.
[3] Vuglinsky, V.S., Gronskaya, T.P. and Lemeshko, N.A. (2002) Long-Term Characte-ristics of Ice Events and Ice Thickness on the Largest Lakes and Reservoirs of Rus-sia, “Ice in the Environment”. Proceedings of the 16th International Symposium on Ice, 3, 88-91.
[4] Vuglinsky, V.S. and Gronskaya, T.P. (2006) Changes in Ice Regime of Russian Lakes and Rivers and Their Possible Impact on the Economy. In: Modern problems of hydrometeorology. Asterion, St. Petersburg, 229-244 (in Russian).
[5] Vuglinsky, V.S. (2002) Peculiarities of Ice Events in Russian Arctic Rivers. Hydro-logical Processes, 16, 905-913. https://doi.org/10.1002/hyp.365
[6] Kuusisto, E. and Elo, A. (2001) Lake and River Ice Variables as Climate Indicators in Northern Europe. Verhandlungen des Internationalen Verein Limnologie, 27, 2761-2764.
[7] Prowse, T. and Beltaos, S. (2002) Climatic Control of River-Ice Hydrology: A Re-view. Hydrological Processes, 16, 805-822. https://doi.org/10.1002/hyp.369
[8] Duguay, C., Prowse, T., Bonsal, B., Brown, R., Lacroix, M. and Menard, P. (2005) Recent Trends in Canadian Lake Ice Covers. Proceedings of the 61st Eastern Snow Conference.
[9] Magnuson, J.J., Robertson, D.M., Benson, B.J., Wynne, R.H., Livingstone, D.M., Arai, T., Assel, R.A., Barry, R.G., Card, V., Kuusisto, E., Granin, N.G., Prowse, T.D., Stewar, K.M. and Vuglinsky, V.S. (2000) Historical Trends in Lake and River Cover in the Northern Hemisphere. Science, 289, 1743-1746.
https://doi.org/10.1126/science.289.5485.1743
[10] Prowse, T., Alfredsen, K., Beltaos, S., Bonsal, B.R., Bowden, W.B., Duguay, C.R., Korhola, A., McNamara, J., Vincent, W.F., Vuglinsky, V., Walter Anthony, K.M. and Weyhenmeyer, G.A. (2011) Effects of Changes in Arctic Lake and River Ice. AMBIO, 40, 63-74. https://doi.org/10.1007/s13280-011-0217-6
[11] Prowse, T., Alfredsen, K., Beltaos, S., Bonsal, B., Duguay, C., Korhola, A., McNa-mara, J., Pienitz, R., Vincent, W.F., Vuglinsky, V. and Weyhenmeyer, G.A. (2011) Past and Future Changes in Lake and River Ice. AMBIO, 40, 53-62.
https://doi.org/10.1007/s13280-011-0216-7
[12] Prowse, T., Alfredsen, K., Beltaos, S., Bonsal, B., Duguay, C., Korhola, A., McNa-mara, J., Vincent, W.F., Vuglinsky, V. and Weyhenmeyer, G.A. (2011) Arctic Freshwater Ice and Its Climate Role. AMBIO, 40, 46-52.
https://doi.org/10.1007/s13280-011-0214-9
Submit or recommend next manuscript to SCIRP and we will provide best service for you:
Accepting pre-submission inquiries through Email, Facebook, LinkedIn, Twitter, etc. A wide selection of journals (inclusive of 9 subjects, more than 200 journals)
Providing 24-hour high-quality service User-friendly online submission system Fair and swift peer-review system
Efficient typesetting and proofreading procedure
Display of the result of downloads and visits, as well as the number of cited articles Maximum dissemination of your research work
Submit your manuscript at: http://papersubmission.scirp.org/