Munich Personal RePEc Archive
The Top One Percent and Exploitation
Measures
Lambert, Thomas and Kwon, Ed
Northern Kentucky University, Northern Kentucky University
10 September 2013
Online at
https://mpra.ub.uni-muenchen.de/69568/
The Top One Percent and Exploitation Measures
By
Thomas E. Lambert, PhD*
Northern Kentucky University
Department of Political Science, Criminal Justice, and Organizational Leadership
Highland Heights, KY 41099
502-403-9795 / 859-572-5324
And
Edward Kwon, PhD
Northern Kentucky University
859-572-5329
*Corresponding Author
Abstract
With the Occupy Movement that recently took place on Wall Street and in other parts of the globe, a
lot of attention has recently been given to growing income inequality. The 2008 United States
financial crisis, the Great Recession, and the subsequent weak recovery have brought about a more
serious focus on income inequality and the widening income gap between the top one percent and
other groups. These events have brought about some social unrest and instability in American
society perhaps not seen since the Great Depression. How much has the top 1 percent of households
gained in terms of income versus the other 99 percent in the United States over the last 30 years or
so? Mainstream economists and other social scientists point to various causes which have been
mentioned in many scholarly and popular writings. All of these mainstream factors affecting
inequality have been found to be statistically significant in one scholarly study or another. This
research paper explores other major concepts to explain income inequality rather than to dispute the
findings of other existing research efforts. The empirical findings of this paper support radical
arguments that income accumulation of those at the top is not connected to the productivity of
capital investment, but rather instead is connected to the declining incomes and exploitation of the
rest of the US population despite the rising output per worker of the US workforce over the last 30 to
40 years.
JEL Classification: B51, C50, D33, D63, H53
1. Introduction
Since the September 2011 Occupy Wall Street Movement that spread globally in a short
period of time, issues regarding inequality in the US and in other parts of the globe have been
gaining momentum in the news media, and in public dialogue and discourse. The income inequality
issue may not be easy for everyone to grasp. On the one hand, income inequality can lead to social
instability, increasing class conflict and political distrust (Uslaner and Brown 2005). On the other
hand, the top one percent income group has contributed increasing tax revenues and has been a big
investment source serving as a “trickle-down” engine of economic growth in the United States
according to some scholars and writers (Hacker and Peirson 2010; Laffer 2010; Sowell 2012).
Against this backdrop, the recent rise in income inequality in the United States has ignited
controversial policy debates such as the Buffet Tax Rule (Lowrey 2012). Finally, the income gap
between the top one percent and others in America has been widening during recent decades. In fact,
a recent Pew Research Center report found an increasing number of US citizens indicating an
awareness of greater class conflict between rich and poor — 47 percent indicating this in 2009 yet
66 percent indicating it in 2011 (Morin 2012). Respondents to the Pew survey were about evenly
split on the question of whether the rich have their wealth through “hard work, ambition or
education” or, on the other hand, by being “born into wealthy families” or having the right
connections (Morin 2012).
The cutoff for the income shares of those toward the top of the income scale depend upon
whether capital gains are included or not (Saez 2009). Without capital gains, the top 1 percent is
estimated to have a family income of slightly less than $400,000 in 2007 according to Saez (2009) or
to have a household income of $387,000 for 2010 according to Sentier Research (2012). If capital
2008, and when capital gains income is included, the cutoff for the top 1 percent of households is
over $1 million.
How the top income and wealth class in the United States attains its success has been studied
by various scholars. An upper class of U.S. citizens has probably always existed, but wealth and
income concentration in the United States probably did not become a public issue until the rise of
big industrialists and robber barons during the Gilded Age around the second half of the 19th century
(Hughes and Cain 1994). In modern times, some account for income differences and high earnings
for those at the top, and income inequality in general, by noting that higher earning households have
higher levels of education than the general population and that an increasing portion of college
graduates in the labor force explain greater inequality (Miller, et al. 2010). Others have noted that
over the last 30 to 37 years top income groups have benefited more than other income groups from
high growth rates in GDP, high returns on wise investments, and the growth of international trade
and foreign imports (Dew-Becker and Gordon 2005; Roine, et al. 2009); lower top marginal tax rates
for individuals and corporations thanks to the ascendancy of neo-liberal policies in the late 1970s
(Roine, et al. 2009 ); a smaller government presence in the economy with less spending on social
programs and infrastructure (Roine, et al. 2009); the growth in the Finance, Insurance, and Real
Estate industries (F/I/RE) which lead to big profits for Wall Street executives and big gains for
investors while at the same time leading to greater consumer and mortgage debt for households
(Foster and Magdoff 2009; Kotz 2003, 2008, 2009; Lapavitsas 2009; McNally 2009; Roine, et al.
2009; Kotz and McDonough 2010; Tabb 2010a, 2010b; Lambert 2011); and the decline of high
paying manufacturing employment and in labor union membership as well as the decline in wages
Harrison 1982; Freeman and Katz 1995; Gordon 1996; Birchfield and Crepaz 1998, Alderson and
Nielsen 2002; Minnich 2003; Piketty and Saez 2006).
This paper adds other variables to this list of possible factors influencing top income shares:
two general measures of the Marxian concept of the rate of exploitation (Net Operating Surplus over
Private Sector Wages and Net Operating Surplus as a Portion of GDP) and a
mainstream/neoclassical economic measurement of the marginal productivity of capital (MPK).
Which set of variables has the greater predictive power would be of interest to both radical and
mainstream followers of economics and political economy. In the course of writing this paper, no
research has been found where these variables have been used to predict an upper income share for
the United States, and specifically the shares of those at the top since these income strata derive a
greater share of their income from capital gains, dividends, and rents than other income groups (Saez
2013). Finally, in doing research for this paper, only a handful of authors (Amsden 1981; Lambert
2012) have been found to use the concept of a rate of exploitation to predict income inequality, and
none has been found so far that uses it explicitly for the United States or for the top shares of an
income distribution, much less the top 1 percent.
As shown in Figure 1, the income shares of the top 0.01 to 10 percent mostly declined during
and after the Great Depression until the end of the 1970s. Those who see gains to top income groups
coming from lower and working classes via decreasing labor wages and salaries despite rising
productivity and, hence, greater rates of exploitation would find their views supported if these
variables measuring exploitation are found to be linked to top income shares.1 From 1981 to 2010,
1
the ratio of Net Operating Surplus to Private Sector Wages and Salaries went from 0.533 to 0.696
whereas the income share of the top 1 percent went from 10.02 percent to 19.77 percent of all
income. Figure 2 shows that beginning in 1981, the ratio of Net Operating Surplus to Private Sector
Wages and Salaries began to rise sharply after showing a decline in the previous three decades.
Those who have followed inequality over the last several decades are probably already aware of
these trends, but we want to mention them here to point out why 1981 is a starting point for our
analysis.
On the other hand, neoclassical economists and those who subscribe to a marginal
productivity of capital (MPK) measurement as explaining greater returns and income going to the
top 1 percent would believe that their notions of greater rewards for greater productivity would be
confirmed if the MPK variable is found to be a good predictor of top 1 percent income shares.
According to this school of thought, those of the top 1 percent are garnering rewards earned through
shrewd investments and sound management of business enterprises. Therefore, if a standard
neoclassical measure of capital productivity works as a predictor of their income gains, then Marxian
notions of labor exploitation as reasons for greater inequality would be weakened.
(Insert Figures 1 and 2 around here.)
This paper proceeds as follows. Section 2 explains the research methods used, Section 3 discusses
the results, and Section 4 has concluding remarks that explore the implications of the paper’s
analyses.
2. Research Methods
In order to find the relationship between growing income inequality and other important
independent variables, we conducted a least squares regression analysis using two regression
models, each with a different measure of exploitation. The dependent variable used was the change
in the income (including capital gains) share of the top 1 percent from each year from 1981 to 2010
compared to the top 1 percent income share level of 1931 as a base (15.5 percent). For example, the
top income share for 1931 was subtracted from the 1985 share of 12.67 percent to yield -2.83, and
this in turn was divided by the 1931 income share to yield a value for 1985 of around -18.26 percent.
The year 1931 is about the time when the top 1 percent income share began to decline before
bottoming out in the 1970s (Piketty and Saez 2003, updated 2010). Using the percentage change in
income pinned to a base year shows how the top income class has made a comeback in its share of
United States income and also has the effect of smoothing out the pure, positive autocorrelation that
exists in the data and allows for avoidance of serial correlation. This was regressed against the
following independent variables:
1. Macroeconomic Trends, or Macrotrends.2 This is an index composed of the following
variables:
a. College Educated as a Percentage of Total Population (United States Census Bureau).
The values from decennial census years for US educational levels are used to predict
the top income shares.
b. Trade Union Membership as a Percentage of the Private Sector Labor Force (US
Bureau of Labor Statistics). Declining union membership has been linked to less
2
income for lower and middle income groups, and subsequently more income for
upper income groups. This variable is highly correlated with manufacturing
employment, but is still used as a separate variable because declining union
membership has been cited as a factor influencing rising inequality over the last
several decades and because not all union membership has been concentrated in
manufacturing. Transportation, mining, and other industries have traditionally had
high rates of unionization and currently have more union members than
manufacturing (United States Bureau of Labor Statistics).
c. Top Marginal Rate Individual Income Tax (Saez 2010). Higher marginal rates cut
into top income shares, and so this should be associated with a decline or slower
growth in top 1 percent income shares.
d. Finance/Insurance/Real Estate (F/I/RE) Wages and Salaries as a Percentage of all
Wage & Salaries (United States Bureau of Economic Analysis). Since revenues and
value added for these industries are not available for all years in the series, this
variable is used as a proxy to represent the size of these industries in the US economy
from 1981 to 2010. As the F/I/RE industries have grown in the US, so have top
income shares because of the large profits associated with these industries.
e. Consumer and Mortgage Debt Payment as a Percentage of United States Disposable
Income. As wages and salaries stagnated, it has been argued that households
borrowed more money to keep up a certain standard of living. The interest and profits
earned by financial institutions in turn would have benefitted those who make up the
2. Government expenditures without Military Spending as Percentage of GDP (United States
Office of Management and Budget). This variable should be negatively correlated with top 1
percent income share since greater government expenditures, especially for social programs,
outside of defense usually help lower and middle income groups and thereby increase their
share of national income and not the income of those at the top.
3. Net Operating Surplus (NOS) as a Percentage of Private Industry Wages and Salaries
(United States Bureau of Economic Analysis, Table 2.2A). Private sector net operating
surplus is divided by private industry wages and salaries in order to come up with a variable
that is somewhat akin to a rate of exploitation variable from Marxian economics as
mentioned above.3 It is hypothesized to have a positive value since higher rates of
exploitation should lead to higher top income shares, and is used as a rate of exploitation
variable. This variable is hypothesized to have a positive correlation with the change in the
top 1 percent income share—a greater rate of exploitation should boost top income shares,
and less exploitation should lower top income shares. Wages and salaries are the wages and
salaries of private industry workers so that government and non-profit wages and salaries are
excluded. However, we make no distinction between productive and unproductive labor as is
often done in some analyses using Marxian perspectives.
4. Net Operating Surplus as a Percentage of GDP (United States Bureau of Economic
Analysis). Gains in Net Operating Surplus (NOS) as a percentage of GDP would be an
indication of greater exploitation if the gains come at the expense of labor. In the next section
we show a link between wage stagnation and NOS gains.
3
5. Marginal Product of Capital, MPK (United States Bureau of Economic Analysis). This
variable is the change in Output/GDP from year to year over the change in fixed assets4 from
year to year for 1981 to 2010. It is used as a simple representation of the neoclassical
economic notion of the marginal product of capital in macroeconomics, which is
theoretically equal to the rate of return on capital, r. It is hypothesized that if MPK is equal to
or approximately equal to r, and if the top 1 percent represents the great bulk of the
investor-capitalist class, then higher MPK would mean more and greater returns to those of the top 1
percent, and so this variable should be a predictor of the change in top 1 percent income.
Although a few mainstream economists no longer believe this to be a legitimate concept,
others still subscribe to it and use the concept in their textbooks, e.g., Mankiw (2012) and
Jones (2001) among others.
3. Results and Discussion
Two regression models were developed in order to find which major factors could have
contributed to increasing income inequality and increasing income going to the top 1 percent.
Among our variable list, some variables, such as the top marginal tax rate had higher values until
the 1980s, a time when tax rates were lowered, whereas other variables had lower values until the
1980s and beyond such as the portion of household debt payment as a portion of disposable income.
First, to show some type of exploitation taking place, one could look at what has taken place
over the last several decades by comparing the gains in wages and salaries to workers to the gains in
worker output per hour or average productivity. From 1981 to 2010, as shown in Table 1, the real
4BEA defines fixed assets as, “Produced assets that are used repeatedly, or continuously, in processes of production for
wages of US business sector workers increased an average of 1.1 percent whereas labor productivity
in dollars of output increased an average of 2.1 percent (Bureau of Labor Statistics, Major Sector
Productivity). From 1948 to 1980, the average rate of increase in the value of productivity was 2.78
percent and for real wage gains was 2.38 percent, almost a tie. In doing a simple bivariate regression
analysis, it was found that when the difference between the output per hour and wage gains is used
to predict the changes in net operating surplus (NOS) as a portion of GDP from 1981 to 2010, the
difference is statistically significant, has a positive slope, and explains around 19 percent of the
variation in the change of NOS over GDP. The Durbin-Watson test shows no autocorrelation present
using a test of significance of 1 percent. The bivariate model indicated that 1 percent difference
between output per hour gains and wage gains is associated on average with around a 1.2 percent
increase in NOS over GDP, which is one of the measures of exploitation used, and NOS is part of
the other measure of exploitation used in this paper—NOS/Private Sector Wages and Salaries. Labor
captured a smaller share of the rewards of increased output after 1981 when compared to prior
periods when wage gains were closer to productivity gains on average (Greenhouse and Leonhardt
2006) and apparently much of the payment for increased output went to surplus value.
(Insert Tables 1 and 2 around here)
In order to find which factors influenced the percentage change in the top 1 percent income
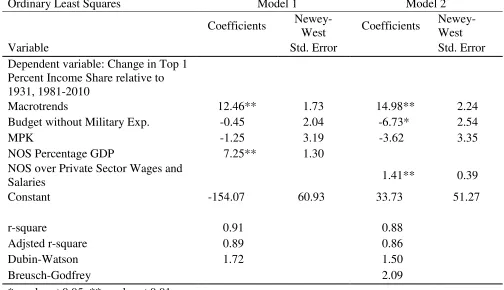
share during 1981 to 2010, we conducted multiple regression analyses as shown in Table 2.
Reported standard errors are Newey-West standard errors. As the Durbin-Watson test results
indicate, there are no signs of autocorrelation present in Model 1 using a test of significance of 5
more general test of autocorrelation, the Breusch-Godfrey test. The test statistic of 2.088 implies that
the null hypothesis of no autocorrelation is accepted for Model 2.
In Model 1 of Table 2, the variable Macrotrends has a statistically significant relationship
with the change in the top 1 percent income share relative to 1931 share because it encompasses
variables that mainstream economists have put forth as causes of growing inequality over the last 30
years or so, such as the greater percentage of college educated in the labor force, growth in the
F/I/RE sector, declining unionization, declining manufacturing employment, etc. A one unit increase
in this variable results in a 12.5 percent change in the top 1 percent income share on average and
holding all else constant. These factors, when considered collectively, have a big impact on the
fortunes of the top 1 percent. More specifically, in looking at the variables that make up the
Macrotrends index, the top four variables according to the factor loadings (0.903, 0.89, 0.87, and
0.67 respectively) which account for top income gains were the decline in trade union membership,
the decline in manufacturing employment, the increase in the number of college grads, and the
increase in household debt payment. These findings support mainstream assertions regarding
inequality.
Next, the variable that is used as a proxy for social welfare expenditures, Budget without
Military Expenditures, is not statistically significant. At the same time one version of the
Marxian/radical concept of labor exploitation also works well in Model 1 and is statistically
significant and has its hypothesized sign. A 1 percent increase in the share of NOS as a portion of
GDP is associated with a 7.25 percent increase in the change in the top 1 percent share, all else held
constant. The MPK variable does not appear to be a good predictor of top income gains because it is
In Model 2, Macrotrends again works well as a predictor of the change in top 1 percent
income changes. A one unit increase in the Macrotrends variables is associated with 14.98 percent
increase on average in the change in the top 1 percent income share, all other things held constant.
In this model, the Budget without Military Expenditures variable is statistically significant. A 1
percent decrease in non-military spending results in a 6.73 percent increase in the change in the top
income share. At the same time, the Marxian/radical variable of labor exploitation used
(NOS/Private Sector Wages and Salaries) is statistically significant and has its hypothesized sign.
On average, a 1 percent increase in the ratio of NOS/Private Sector Wages and Salaries results in an
over 1.41 percent increase in the change in the top 1 percent income share, all else held constant.
Finally, the MPK variable is again not found to be a good predictor since it is not statistically
significant.
To assess how much of the change in the share of top 1 percent income from 1981 to 2010
relative to 1931 that each variable can explain, we took the coefficient of each variable and
multiplied it by the change in the value of the variable between 1981 to 2010. The overall change
in the dependent variable as a result of changes in NOS/GDP was 21.12 percent, which is the
impact of this variable on the change in the top 1 percent income share relative to 1931. For
NOS/Private Wages and Salaries Percent, its coefficient of 1.41 was multiplied by 16.29 percent
change in the variable to arrive at an overall change of 22.97 percent. This is the amount of the
change in top 1 percent income share explained by NOS/Private Wages and Salaries. For the
Macrotrends variable, its total change in value over this period was 3.21, and using its coefficient
from Model 1, it explains around 40.13 percent of the change in income share. In Model 2, it
Expenditures and MPK variables, one cannot expect them to explain any gains in the top 1 percent
income share—only losses, so these results are not discussed.
The Macrotrends variable appears to have a slightly greater degree of impact with regard to
the gain in income to the top 1 percent during this time period, yet the two exploitation variables still
work well in explaining some of the gain. The MPK variable is not statistically significant and has a
negative sign, and so cannot really be used to explain any of the gain.5
4. Conclusion
Most of the writings reviewed in developing this paper explained the growth in the income
shares of the top income groups by using traditional measurements of manufacturing employment,
labor income shares, trade union membership as well as the other macroeconomic variables
mentioned above. This paper has found none, however, that used any profitability measures such as
Net Operating Surplus or a measure of exploitation, such as NOS/Private Sector Wage & Salaries.
Considering these mainstream factors or explanatory variables with a capital share variable (NOS as
a portion of GDP) and the NOS/Private Sector Wages and Salaries Percentage variable, the
argument that income shares are class and politically derived seems to have some support. There
does not appear to be any support for the neoclassical economic view that top income is somehow
earned through the productivity of capital, however, given the results found in the two models.
Although the results of this paper support the mainstream factors that are often cited as
causes of greater inequality, this papers finds strong statistical support for radical contentions that
income share gains to the top 1 percent are extracted from workers and that the marginal product of
5
capital theory or concept does not hold much validity, especially in trying to justify greater income
going to the top strata of United States society. The findings herein also make a contribution to the
literature by using different measurements of exploitation to predict successfully the gains and losses
of the top 1 percent and put radical concepts and measurements on an equal footing with the
mainstream ones in a statistical sense. In most mainstream writings, the concept of exploitation is
mostly ignored with the exception of looking at how working class wages have declined and can be
used to predict measures of inequality such as Gini coefficients as well as top income shares
(Birchfield and Crepaz 1998; Alderson and Nielsen 2002; Minnich 2003). Further research could
possibly delve into how the part of investment that goes toward technology or overseas investment
impacted top income shares, things not considered in the models, and so this is a limitation of this
paper.
A Marxian concept of the rate of exploitation used in this paper appears to have strong
statistical validity as well, which supports the contention that the top 1 percent appears to have
gained from the surplus generated by workers over the previous three decades. Although not the
same as the Marxian concept of surplus value, which is often considered business profits or a simple
residual resulting from when wages are subtracted from total revenues, Lee and Jo (2011) argue that
with regard to national output/income, there exists a “social surplus”, which is consumption goods,
investment goods, and government goods that are socially produced and not just taken as given in an
economy and are not determined solely by market forces but also by social structures and social
agency. That is, class considerations matter as do political and social ones in producing the goods
and services we consume. From 1981 and forward, neoliberal policies have helped to usher in
greater imports, less unionization, lower taxes on upper income groups and less spending on social
rise as the number of good paying manufacturing jobs has declined. These are all associated to one
degree or another with rising top 1 percent income. Additionally, in conjunction with these policies
and trends, the fact that wage gains have not kept up with productivity gains, and that most
productivity gains have resulted in higher levels of NOS, has caused an increase in the ratio of
profits to private wages and salaries at the expense of greater income to the other 99 percent of the
population. The results of our econometric analysis show that these wage losses and a greater NOS
to private sector wages and salaries ratio is linked to increases in the income share of the top 1
percent. With these things in mind, perhaps it is even more apparent as to how and why the Occupy
Wall Street movement got started and moved across the country and the globe in the fall of 2011.
After 30 years of rising inequality and high levels of exploitation, a mass movement focused on
income distribution issues was perhaps inevitable.
Acknowledgements
The authors are very grateful for the kind assistance of Jonathan Goldstein, Tae-Hee Jo, and
Terrence McDonough and the managing editor, Hazel Dayton-Gunn. They were of great assistance
in the improvement of this manuscript. The usual disclaimers apply.
Declaration of Conflicting Interests
The authors declared no potential conflicts of interest with respect to the research, authorship, and/or
publication of this article.
Funding
The authors received no financial support for the research, authorship, and/or publication of this
References
Amsden, A. H. 1981. An international comparison of the rate of surplus value in manufacturing industry. Cambridge Journal of Economics 5(3): 229-249.
Anderson, D. R., D. J. Sweeney, and T. A. Williams. 2008. Statistics for business and economics, 10th ed. Mason, Ohio: Thomson South-Western.
Becker, J. F. 1977. Marxian political economy: An outline. Cambridge, UK: Cambridge University Press.
Berenson, M. L., D. M. Levine, and T. C. Krehbiel. 2006. Basic business statistics: Concepts and applications, 10th ed. Upper Saddle River, NJ: Pearson-Prentice Hall Publishers.
Birchfield, V. and M. M. L. Crepaz. 1998. The impact of constitutional structures and collective and competitive veto points on income inequality in industrialized democracies. European Journal of Political Research 34(1): 175-200.
Bluestone, B. and B. Harrison. 1982. The great u-turn: Corporate restructuring and the polarizing of America. New York, NY: Basic Books.
Congressional Budget Office. 2004. What accounts for the decline in manufacturing employment? Available at http://www.cbo.gov/doc.cfm?index=5078&type=0.
Congressional Budget Office. 2011. Trends in the distribution of income between 1979 to 2007. Available at http://www.cbo.gov/ftpdocs/124xx/doc12485/WebSummary.pdf.
Dew-Becker, I. and R. J. Gordon. 2005. Where did the productivity growth go? Inflation dynamics and the distribution of income. Brooking Papers on Economic Activity 2: 67-127.
Domhoff, G. W. 2012. Who rules America. Available at http://www2.ucsc.edu/whorulesamerica/power/wealth.html.
Foster, J. B., and F. Magdoff. 2009. The great financial crisis: Causes and consequences. New York, NY: Monthly Review Press.
Freeman, R. B. and L. F. Katz. 1995. Difference and changes in wage structures. Chicago and London: University of Chicago Press.
Greenhouse, S. and D. Leonhard. 2006. Real wages fail to match a rise in productivity. The New York Times,August 28.Available at
http://www.nytimes.com/2006/08/28/business/28wages.html?pagewanted=all&_r=0.
Hughes, J. and L. P. Cain. 1994. American economic history, 4th ed. New York, NY: HarperCollins Publishers.
Gordon, D. M. 1996. Fat and mean: The corporate squeeze of working Americans and the myth of managerial “downsizing.” New York, NY: The Free Press.
Greene, W. H. 1997. Econometric analysis, 3rd ed. Upper Saddle River, NJ: Prentice Hall Publishers.
Jones, C. I. 2001. Introduction to economic growth, 2nd ed. New York, NY: WW Norton Publishers.
Kotz, D. M. 2003. Neoliberalism and the social structure of accumulation theory of long-run capital accumulation. Review of Radical Political Economics 35(3): 263–270.
Kotz, D. M. 2008. Contradictions of economic growth in the neoliberal era: Accumulation and crisis in the contemporary U.S. economy. Review of Radical Political Economics 40(2): 174–188.
Kotz, D. M. 2009. The final conflict: What can cause a system-threatening crisis of capitalism? Science and Society 74 (3): 362–380.
Kotz, D. M., and T. McDonough. 2010. Global neoliberalism and the contemporary social structure of accumulation. In Contemporary capitalism and its crises: Social structure of accumulation theory for the 21st century, ed. T. McDonough, M. Reich, and D. M. Kotz. New York, NY: Cambridge University Press.
Laffer, A. 2010. “The soak-the-rich Catch-22,” The Wall Street Journal, August 2, 2010. Available at http://online.wsj.com/article/SB10001424052748703977004575393882112674598.html .
Lambert, T. E. 2011. Falling income and debt: Comparing views of a major cause of the great recession. World Review of Political Economy 2(2): 247-261.
Lambert, T. E. 2012. Explaining levels of inequality in OECD nations by using rates of surplus value and profit to wage ratios. World Review of Political Economy 3(3): 313-326.
Lapavitsas, C. 2009. Financialised capitalism: Crisis and financial expropriation. Historical Materialism 17 (2): 114–148.
Lee, F. S. and T.-H. Jo. 2011. Social surplus and heterodox economics. Journal of Economic Issues 45(4): 857-875.
Lowrey, A. 2012. The Buffet tax is really more of a guideline. New York Times, February 16. Available at http://www.nytimes.com/2012/02/17/us/politics/white-house-sees-buffett-tax-rule-more-as-a-guide.html?_r=1&ref=annielowrey.
McNally, D. 2009. From financial crisis to world-slump: Accumulation, financialisation, and the global slowdown. Historical Materialism 17(2): 35–83.
Miller, R. L., D. K. Benjamin, and D. C. North. 2010. The economics of public issues. New York: Addison-Wesley.
Minnich, D. J. 2003. Corporatism and income inequality in the global economy: A panel study of 17 OECD countries. European Journal of Political Research, 42(1): 23-53.
Morin, R. 2012. Rising share of Americans see conflict between rich and poor. Pew Social and Demographic Trends, Pew Research Center. Available at
http://www.pewsocialtrends.org/2012/01/11/rising-share-of-americans-see-conflict-between-rich-and-poor/.
Piketty, T. and E. Saez. 2003. Income inequality in the United States, 1913-1998. Quarterly Journal of Economics 118(1): 1-39. (Longer updated version published in A.B. Atkinson and T. Piketty eds., Oxford University Press, 2007) (Tables and Figures Updated to 2008 in Excel format, July 2010).
Piketty, T. and E. Saez. 2006. The evolution of top incomes: A historical international perspective. American Economic Review, Papers and Proceedings 96(2): 200-205.
Roine, J., J. Vlachos, and D. Waldenstrom. 2009. The long-run determinants of inequality: What can we learn from top income data? Journal of Public Economics 93(7): 974-988.
Saez, E. 2009. Striking it richer: The evolution of top incomes in the United States (update with 2007 estimates), August 5. Available at http://elsa.berkeley.edu/~saez/saez-UStopincomes-2007.pdf.
Sentier R. 2012. The top 1 percent. The Washington Post, February 1. Available at
http://www.washingtonpost.com/local/the-top-1-percent/2012/02/01/gIQAhRT2iQ_graphic.html.
Sentier R. 2008. Sub-prime solution: How today’s global financial crisis happened and what to do about It. Princeton, NJ: Princeton University Press.
Sentier R. 2012. Finance and the good society. Princeton, NJ: Princeton University Press.
Sowell, T. 2012. “Defending tax cuts for the rich: Republicans should revisit the arguments of the
1920s,” National Review, May 24. http://www.nationalreview.com/articles/300752/defending-tax-cuts-rich-thomas-sowell Retrieved on September 6, 2013.
Studenmund, A. H. 1992. Using econometrics: A practical guide. 2nd ed. New York, NY: HarperCollins Publishers.
Tabb, W. K. 2010b. Financialization in the contemporary social structure of accumulation. In Contemporary capitalism and its crises: Social structure of accumulation theory for the 21st century, ed. T. McDonough, M. Reich, and D. M. Kotz. New York, NY: Cambridge University Press.
U.S. Bureau of Economic Analysis. 2012. GDP and NIPA accounts. Available at http://www.bea.gov/national/index.htm#gdp.
U.S. Bureau of Labor Statistics. 2012. Labor force statistics. Available at http://www.bls.gov/cps/cpslutabs.htm.
U.S. Bureau of Labor Statistics. 2012. Manufacturing. Available at http://www.bls.gov/iag/tgs/iag31-33.htm#workforce.
U.S. Bureau of Labor Statistics. 2013. Union members summary. Available at http://www.bls.gov/news.release/union2.nr0.htm.
U.S. Census Bureau. 2012. Educational attainment. Available at
http://www.census.gov/hhes/socdemo/education/data/census/half-century/tables.html.
U.S. Office of Management and Budget. 2013. Budget, historical series. Available at http://www.whitehouse.gov/omb/.
Uslaner, E. M., and M. Brown. 2005. Inequality, trust, and civic engagement. American Politics Research 33(6): 868-894.
Author Biographies
Thomas E. Lambert is an Assistant Professor of Public Administration in the Department of Political Science, Criminal Justice, and Organizational Leadership at Northern Kentucky University. His publications include those on various public policy issues in journals such as Economic Development Quarterly, Journal of Economic Issues, State and Local Government Review,Social Science
Quarterly, Journal of Public Management and Social Policy, Population Research and Policy Review, and World Review of Political Economy among others, and his research interests include local economic development, urban and regional policy, immigration, and inequality.
Edward Kwon is an Associate Professor in the Department of Political Science, Criminal Justice, and Organizational Leadership at Northern Kentucky University. He received his Ph.D. at the Department of Political Science of University of Hawaii at Manoa. His research interests include financial liberalization and global governance in the international financial system, international security, East Asian security,international relations of East Asia, and non-proliferation of Nuclear Weapons. His articles have appeared in journals such as Journal of Contemporary Asia,
Figure 1. Top Income Shares
Figure 2. Net Operating Surplus and Private Sector Wages and Salaries
Table 1.Wage Increases and Output per Hour
1948 to 1980 1981 to 2010
Change in Real Wages 2.38 1.1
Table 2. RegressionResults
Ordinary Least Squares Model 1 Model 2
Coefficients
Newey-West Coefficients
Newey-West
Variable Std. Error Std. Error
Dependent variable: Change in Top 1 Percent Income Share relative to
1931, 1981-2010
Macrotrends 12.46** 1.73 14.98** 2.24
Budget without Military Exp. -0.45 2.04 -6.73* 2.54
MPK -1.25 3.19 -3.62 3.35
NOS Percentage GDP 7.25** 1.30
NOS over Private Sector Wages and
Salaries 1.41** 0.39
Constant -154.07 60.93 33.73 51.27
r-square 0.91 0.88
Adjsted r-square 0.89 0.86
Dubin-Watson 1.72 1.50
Breusch-Godfrey 2.09