Abstract—Motivated by ecological appeal and laws, the Nokia’s Take-Back initiative collects used mobile phones disposed in bins spread around the world, a kind of solid waste collection. This paper presents a light weight image processing technique to detect bin level based solely on internal wall entropy perturbation, aiming to automate the discovery of the best moment to take back disposed mobile phones and accessories. A low cost mobile phone scrapped in the manufacture center is recycled and installed inside the bin in a proper support, taking photos to extract entropy features sent as very few data to a server who finishes the processing. Learning and non-learning strategies are compared when analyzing entropy perturbations, showing great performance of the multilayer perceptron (MLP), Logistic Model Tree (LMT) and k-NN classifiers. An interesting resulting behavior shows that most of errors are acceptable since they occur in the adjacency of levels, allowing even higher accuracy evaluations. Our simple level detection method is efficient and efficacious allowing mobile side processing, cost reduction on data transfer and prevention of unnecessary trucks visiting the collecting points, enabling the method to be safely used by monitoring systems, increasing the reverse logistics capacity by scaling the take back process.
Index Terms—Entropy, e-waste management, image processing, machine learning.
I. INTRODUCTION
HE mobile industry is highly successful today, a time when being connected by technology is a trend for people. However, phones, tablets and accessories have a short lifetime, creating a significant amount of waste. The take back of electronic waste is a problem that also affects automobiles, computers and electronics industries, while general solid waste also affects agriculture, hospitals, markets, street sweepings, etc. [1].
Emerging ecological laws are being developed by industrialized countries to implement take back policies that extend producer responsibility to the recovery of disposed products. In Brazil, the Decree Nº 7404 institutes solid waste national policies and committees for reversal logistics implementation, while Resolution nº 257, from Environment National Board, attributes the take back responsibility of batteries to the suppliers. Similar legislation initiatives are taking place on countries from Europe, Asia and America [2]. Manuscript received July 19, 2013; revised August 04, 2013. This work was supported by Nokia Institute of Technology.
F. D’Morison is with the Nokia Institute of Technology, Manaus/Amazonas/Brazil (e-mail: [email protected] ).
C. Bittencourt is with the Nokia Institute of Technology, Manaus/Amazonas/Brazil (e-mail: [email protected] ).
L. Ferraz is with the Nokia Institute of Technology, Manaus/Amazonas/Brazil (e-mail: [email protected] ).
The Nokia’s Take-Back program has deployed more than 5000 bins, receiving disposed phones and accessories every day in public establishments [3]. Although being an expressive number, it is still small in a global basis, since it is hard to manually manage a huge quantity of bins, making it a challenge to scale the system to the level of demand. Static vehicle routes do the collect job, which is economically expensive and emits unnecessary CO2 to the atmosphere, surely a paradox for a waste management system. Also, complaints from vehicle operators about visiting empty bins are common, evidencing a bad distribution of bins and the inefficiency of static routes.
An integrated monitoring system able to automate the discovery of the best moment to take back the disposed phones and accessories in each bin would enhance the ability to manage a higher number of bins, increasing the reverse logistics capacity of returning waste and also reducing economical costs and emitted CO2 by optimizing vehicle travels. Such system would present bin locations in a map to help customers know where to discard electronic waste.
The problem of Solid Waste Bin Level Detection is inserted into a major problem known as Waste Management. As observed by [4], few researches have used image processing and machine learning to deal with the problem and there is no generic system currently able to solve the problem for different kind of materials.
To build a reliable monitoring system to automate the described take back initiative, we propose a novel, accurate, fast and cheap image-based approach to detect the level of a bin receiving electronic waste like mobile phones and accessories (batteries, earphones, boards, covers, cables, etc.). By applying Information Entropy [5] we measure how an empty bin gets disordered as more waste is disposed, gradually hiding the internal wall in the following levels:
empty, almost empty, middle, almost full and full. We call wall entropy perturbations the gradual entropy decrements
measured by observing how internal wall gets hidden by waste. In many fields, entropy is associated to order/disorder and the abstraction of entropy perturbations is already used by Cosmology, Thermodynamics and Physics to describe the status of particles.
The solution includes reusing mobile phones scrapped during manufacturing process due to cosmetic and other failures that don’t compromise the functionality of the phones, but only prevents theirs sales. These phones are used as simplified hardware inside the bin to take photos, process and transmit data. Most scrapped phones are destroyed; by giving them utility, we save costs that the industry would expend to destroy them, also giving to our solution a great ecological appeal by using electronic waste to recycle even more waste.
Bin Level Detection based on Wall Entropy
Perturbation in Electronic Waste Collection
Fabricio D’Morison, Cleiton Bittencourt and Leandro Ferraz
II. RELATED WORK
Most relevant work on solid waste bin level detection is relatively new, resulting on few research [4]. Common approaches rely on very specific hardware to transmit data [4], to provide illumination [6] or to create sensorized containers composed by mechanical, 3d scanner, radar, ultrasonic [6], pressure [6], capacitive [7] [8], infra-red [9] or optical sensors, depending on the nature of both disposed material and disposing environment. As stated by [4] [10], solutions to detect level in containers filled with liquid don’t fit to solid waste problem.
There is even fewer research exploring image processing and artificial intelligence [4]. The series of publication [4] [11] [1] pertain to the same initiative motivated by urban waste. They propose some bin level detection algorithms based on image processing by relying on a reference image, by comparing images taken before and after bin collection or by applying machine learning on a featured co-occurrences matrix extracted from images. Their image database is divided into five classes: low, medium, full, flow and overflow since their problem includes waste surrounding the bins. It is a complete system composed by trucks, wireless technologies and a server-side monitoring system. RFID is used to identify the bin when the truck visits it, a low cost camera installed in the truck takes photos from the bin, and finally images and other data are sent to the server via GPRS network. Information about bin is known only when a truck visits it, so this solution cannot be considered real time nor able to avoid unnecessary trucks visiting the bins (static routes), which is economically expensive and pollutes the air with CO2, harming the ecological motivation. Finally, the high amount of image data sent via GPRS is economically not viable due to the high prices required by telecom companies on data plans.
Results shown by [11] have high precision of 70%~87% at the expense of a low recall of 20%~35%, while important levels as full and overflow have low precision of 43% and 72%, respectively. Learning experiments of [4] show higher accuracy of 73%~99%, but the lack if evaluation per class don’t allow to know which levels are performing better or worse. Setup and conceptual differences prevent us from comparing these results to our results: we don’t consider overflow in bin surrounding areas, consequently we don’t keep outside camera taking advantage of environmental light and worrying about terrain variations but we work inside a badly illuminated and controlled environment, also we don’t know how these other approaches perform at night or in any terrain.
Prototypes proposed by [6] [12] use hybrid approach of image processing without learning, including a camera plus a set of different sensors: an ultrasonic distance sensor, a pressure sensor for liquids and a strain gage to weight the content. Three LED lights illuminate the interior of the bin while a communication hardware transmits data wirelessly every time the bin is opened and closed, providing real time information as shape, area, height, weight and volume about every single object identified by image processing using motion detection technique. Such feature diversity makes the idea interesting, but even using the lowest cost sensors, it is both economically and energetically expensive due to the amount of hardware, especially when the problem is just
detecting the best moment to collect some bin. III. SYSTEM DETAILS
The proposed system architecture is composed by a monitoring server, a number of spread bins and a mobile phone installed inside each bin in a proper support. No modification is required to the vehicles.
A mobile phone scrapped during manufacturing is installed as an all-in-one solution working as sensor (camera), light source (flash), data processing unit (processor and memory) and data transmitter (WIFI, GPRS) with rechargeable energy autonomy (battery). We have used low cost phones to take low quality images (2 megapixels). The phone keeps in standby mode most of the time to save energy, having minimal hardware activated and minimal software which is configured with the bin identifier and the time interval to send messages to server.
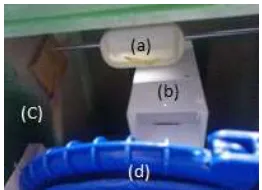
[image:2.595.361.492.414.509.2]The bin model is the same used by Nokia’s Take-Back program because there are more than 5000 of these bins spread around the world. In this model, there is a bin inside a larger box locked with key. In the top of the box there is an entrance to dispose phones and accessories directly to the bin, being impossible for anyone to put a hand through the hole. We added an internal support on the top of the box to install the phone which takes the photos, ensuring the camera position and the easy phone replacement. The top entrance don’t let centralizing the phone support, so it is not possible to take photos from the center of the bin, making it even more difficult to acquire good images.
Fig. 1. The phone support (a), the top entrance (b), the containing box (c) and the bin (d).
The monitoring server keeps listening to HTTP or SMS messages sent by phones. The HTTP interface is easy to implement but expensive due to the high prices required by mobile data plans using GPRS. WIFI Zones are cheaper alternatives to GPRS, but there is no insurance these zones will be available for all bins. The SMS interface seems to be the best solution because it is cheap and enough to transfer the few data we collect about bin conditions. An intelligent system analyses the data and detects the bin level by applying our approach described in section IV.
access, allowing people to know the nearest place to dispose their phones and accessories of any brand.
This setup allows a secure environment against thieves as observed by [6], cheap data transfer method, reuse of existent bins, low power consumption, simplified hardware model, recycle of scrapped phones, vehicle route optimization and bin distribution optimization. All these points help to create a scalable solution that allows deploying and monitoring a higher number of bins and returning more disposed products to the industry, as required by emerging laws.
IV. WALL ENTROPY PERTURBATION APPROACH
A. Feature Extraction
The described feature extraction technique is the key insight of the wall entropy perturbation approach. As shown in section B, the extracted features may be used in many ways, like learning and non-learning techniques.
A bin is a container internally painted with a single and homogeneous color. Observing an empty bin being filled, we could reach the simple conclusion that the homogeneity of that environment was being lost as more waste was discarded. In other words, the homogeneous wall was being covered by the heterogeneous waste, changing from a uniform state to a chaotic state. Once we are able to measure how chaotic is the internal environment of the bin, we may detect the bin level. To do that, we need a definition of uniformity.
Measuring Uniformity: Entropy Definition
The Information Entropy [5] is an elegant metric able to measure the uniformity of a distribution (how close numbers are to each other), as done by [13]. The entropy percentage H available in a probability distribution of length n is:
=− ∑ × (1)
Color intensities themselves are not probabilities, so they must be normalized into ensuring ∑ = 1,0 and no division by 0. Suppose a color intensity sample from some bin’s image, where ∈ and length is n:
=∑ + 1
+ 1
=
+ 1 + ∑
(2)
When the distribution is perfectly uniform, it achieves the maximum entropy H available in that color intensity sample, which is . In other words, the uniform distribution of color intensities maximizes the entropy allowing us to reach a qualitative conclusion that the sample is evidence of wall and not of waste. Henceforth, in our context, the entropy term is used as synonym of uniformity and, in this regard, the internal environment of the bin has a measurable entropy value being perturbed (decreased) as more waste is disposed there, hiding the wall.
Line Entropy Measurement
An intuitive way to measure wall entropy perturbation is to trace horizontal lines into the wall and wait until these lines are perturbed by waste. Understand these lines as digital markers with initial high entropy due to wall uniformity: once
bottom-up waste perturbations reach a line, the entropy of the line decreases indicating the perturbed state. To measure the line entropy, the distribution of grayscale intensities of pixels under all the line extension are taken as sample.
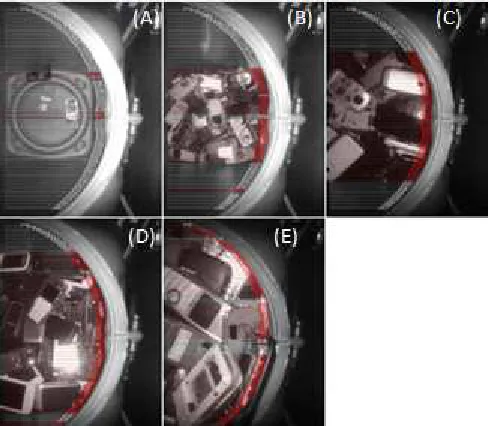
To demonstrate how this technique is sensitive, we applied a threshold of 0.99 entropy to classify each line as uniform or
perturbed. Fig. 2 shows how it is relatively easy to find lines
[image:3.595.305.549.171.384.2]perturbed by disposed mobile phones, where perturbed lines are in red and uniform lines are in white:
Fig. 2. Entropy perturbation in lines evidencing bin levels: empty (A), almost empty (B), middle (C), almost full (D) and full (E).
The entropy doesn’t consider the semantics of the data, but the level of chaos between them. It means we don’t need to care about the color of the wall, neither about how or what is being disposed in the bin. Possible exceptions are materials able to create harmonic surfaces, such as liquids.
Only pixels under the extension of the lines have been turned into gray by applying the RGB averaging technique, avoiding much image processing.
Level Entropy Measurement
Single line entropy may be incorrectly measured due to noise, wall reflections and homogeneous bands inside a filled area. Also, a large quantity of lines inconveniently creates excessive and variable quantity of features for further processing.
Combining line entropies produces better estimation and decreases the quantity of features. Lines are equally grouped by level from bin’s bottom to up: empty, almost empty,
middle, almost full and full. The level entropy is the noisy-and
[14] combination of all line entropies inside the level. The noisy-and of a set of symbols of length n is defined as follows:
=
(3)
B. Classification
Bin level detection is a classification problem. We have experimented many supervised classifiers (learning based), except by two non-supervised classifier (rule based): a single threshold classifier and a fuzzy logic classifier.
The single threshold classifier applies a threshold α to each level: if the entropy is lower than α, so the level is perturbed,
uniform otherwise. A bottom-up lookup for the last perturbed
level defines the bin level. Suppose α = 0.90 and the entropy values on Table I for some bin, we could classify it as middle:
TABLE I
SINGLE THRESHOLD CLASSIFICATION FOR α = 0.90
Level Entropy State
Full 0.990905324070162 Uniform
Almost Full 0.980294464995511 Uniform
Middle 0.721520073001449 Perturbed
Almost Empty 0.788886626550233 Perturbed Empty 0.768744068996936 Perturbed
Supervised classifiers use the level entropies above to build the feature vector. The learning strategy replaces the need of a fixed threshold that may not work well for all levels, neither for all environment variables able to affect images.
[image:4.595.44.294.209.288.2]Rules for fuzzy logic have been predicted by J48 classifier after a cross validation step. The J48 thresholds were modified to become fuzzy boundaries and the entropy features were modeled using trapezoidal functions:
Fig. 3. Trapezoidal functions can represent features that have up two bottoms and one top interval.
V. EVALUATION
A. Database
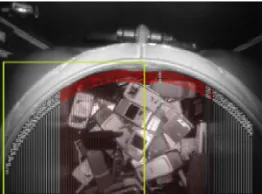
[image:4.595.103.234.672.769.2]The experiment set has 39 colored, 2-megapixels and previously classified images taken from within a closed and locked bin. Categories, are balanced with 7 images each, except by middle containing 11 samples. A low end Nokia 5530 Xpress Music phone took photos using the flash every 30 seconds while the bin was being filled with phones and accessories having varying models, sizes, colors, damage conditions, etc. A total of 100 lines were extracted from each image, of which 50 were used representing one side of wall:
Fig. 4. Half of lines represents one side of the wall, the minimum information to consider.
The phone/camera couldn’t be positioned in the center of the bin due to the top hole of containing box. The dataset is built with colored images because only the pixels under traced lines need to be turned into gray.
B. Results
Supervised classifiers were evaluated with a 10 folder cross-validation. For non-supervised classifiers, the whole dataset is used as test set. The choice of α for the single threshold approach is determined empirically, so we present results for α = 0.92.
Feature extraction efficiency is 90 images/second in average in a Java implementation running in a 2.60 GHz computer with Windows. Classification efficacy is measured in terms of precision (correctness), recall (completeness) and f-measure (equilibrium) presented per level, including the accuracy of the whole classification process:
! =|# ∩ !#%#||%#% #%| (4)
!# =|# ∩ !#%#||!#%#| (5)
!# =|# ∩ !#%#||#| (6)
&'# !# = 2 ×!# × !#!# + !# (7)
The ideal set contains correct answers, while predicted set contains computed answers. Table II shows accuracy of classifiers that have shown better performance:
TABLE II
CLASSIFIER ACCURACY
Classifier Accuracy
Multilayer Perceptron (MLP) 97.4359 Logistic Model Tree (LMT) 94.8718
2-NN 92.3077
Single Threshold 92.3076
3-NN 89.7436
Fuzzy Logic Classifier 89.7400
J48 87.1795
SVM (Puk Kernel) 87.1795
Naïve Bayes 79.4872
consider learning as better option. Curiously, J48 and fuzzy rules rely on entropy features extracted from just three levels:
almost empty, middle and almost full.
Table III shows evaluation per level for some classifiers, Table IV shows correspondent confusion matrices and Table V shows more confusion matrices. Since all evaluations are high, we follow f-measure to see that lowest values occur on
almost empty or almost full levels:
TABLE III
PRECISION, RECALL AND F-MEASURE PER LEVEL
Levels MLP Single Threshold Fuzzy Logic
P R F P R F P R F
[image:5.595.44.295.193.500.2]Empty 1.00 1.00 1.00 1.00 1.00 1.00 0.87 1.00 0.93 A.Empty 1.00 1.00 1.00 1.00 0.86 0.92 0.85 0.85 0.85 Middle 1.00 0.95 0.98 0.91 0.91 0.91 0.90 0.90 0.90 A.Full 0.87 1.00 0.93 0.78 1.00 0.88 0.87 1.00 0.93 Full 1.00 1.00 1.00 1.00 0.86 0.92 1.00 0.71 0.83
TABLE IV
CONFUSION MATRIX AND ADJACENT ERRORS
Levels MLP Single Threshold Fuzzy Logic
E AE M AF F E AE M AF F E AE M AF F
Empty 7 7 7
A.Empty 7 6 1 1 6
Middle 10 1 10 1 1 10
A.Full 7 7 7
Full 7 1 6 1 1 5
TABLE V
CONFUSION MATRIX AND ADJACENT ERRORS
Levels LMT 2-NN SVM
E AE M AF F E AE M AF F E AE M AF F
Empty 7 7 7
A.Empty 7 6 1 7
Middle 10 1 10 1 3 7 1
A.Full 7 7 1 6
Full 1 6 1 6 7
All matrices show errors in the adjacency of levels. One may claim these errors are acceptable since limits between levels are fuzzy, so images near these limits don’t have exact classification. Also, if a truck is sent to collect a bin wrongly classified as full, it won’t lose the travel if the bin is almost
full and vice-versa; if an empty bin is wrongly classified as almost empty, no truck will visit the bin in both cases, and so
on. It allow us to introduce the concept of acceptable error and severe error. Once we consider adjacent errors as acceptable and non-adjacent errors as severe, we can evaluate our results with 100% accuracy because all errors occur in adjacency, except by one severe error of fuzzy classifier.
VI. CONCLUSIONS
We conclude that the wall visibility is a great evidence to detect the bin level. We took advantage of it by developing a novel approach called wall entropy perturbation detected on low quality photos taken by scrapped mobile phones, which has proven to be efficient (fast), efficacious (accurate), financially cheap and ecologically correct. It is proper to deal with electronic waste or any kind of solid waste able to create entropy perturbations.
The solution may not work with waste that create uniform surface, such as liquid. Reflections in the wall caused by camera’s flash may confuse the wall entropy perturbation technique. Reflection removal techniques would avoid it while increasing processing time, while a simple replacement of bin’s internal painting by an opaque color would work.
Advantages go beyond monitoring waste: mobile phones scrapped during manufacturing are recycled to work as sensors, as light sources and as data transmitters with energy autonomy (battery), an all-in-one cheap solution installed in the bins, providing great ecological and economical contribution to the industry; the fast feature selection can be processed by any low cost phone equipped with camera and flash; the few generated data makes it unnecessary to send the photo to the server, reducing data transfer expenses; the line entropy strategy avoids the need of physical markers and many other physical modifications in the bins; there is no real need to manufacture specific bin or hardware for our proposed system, allowing it to be installed in already existent bins; finally, the highly accurate results and the acceptable generated errors allow a monitoring system to safely make consistent and trustable decisions.
REFERENCES
[1] M. Arebey, M. A. Hannan, H. Basri, R. A. Begum and H. Abdullah, "RFID and integrated technologies for solid wast bin monitoring system," Proceedings of the World Congress on Engineering, 2010. [2] A. Atasu and L. V. Wassenhove, "Getting to grips with take-back
laws," IESE-Insight Magazine, 2011.
[3] J. Brown and D. Riley, "The green shoots of technology - Nokia investigates global consumers attitudes to mobile phone recycling," ESOMAR Congress, 2008.
[4] M. Arebey, M. A. Hannan, H. Basri and R. A. Begum, "Bin level detection using gray level co-occurrence matrix in solid waste collection," Proceedings of the World Congress on Engineering and Computer Science, 2012.
[5] C. Shannon, "A mathematical theory of communication," Bell System Technical Journal, July/October 1948.
[6] F. Vicentini, A. Giusti, A. Rovetta, X. Fan, Q. He, M. Zhu and B. Liu, "Sensorized waste collection container for content estimation and collection optimization," Waste Management, 2009.
[7] A. Fuchs, H. Zangl, G. Holler and G. Brasseur, "Design and analysis of a capacitive moisture sensor for municipal solid waste," Measurement Science and Technology, 2008.
[8] Reverter, Ferran, M. Gasulla and R. Pallas-Areny, "Capacitive level sensing for solid-waste collection," Proceedings of IEEE, 2003. [9] R. Pascoe and B. O'Connell, "Flame treatment for the selective
wetting and separation of PVC and PET," Waste Management, 2003. [10] O. M. Johansson, "The effect of dynamic scheduling and routing in a
solid waste management system," Waste Management, 2006. [11] M. Arebey, M. A. Hannan, R. A. Begum and H. Basri, "CBIR for an
automated solid waste bin level detection system using GLCM," Proceedings of the Second international conference on Visual informatics: sustaining research and innovations, 2011. [12] A. Rovetta, F. Xiumin, F. Vicentini, Z. Minghua, A. Giusti and H.
Qichang, "Early detection and evaluation of waste through sensorized containers for a collection monitoring application," Waste Management, 2009.
[13] J. Ding, L. Gravano and N. Shivakumar, "Computing geographical scopes of web resources," Proceeding of VLDB '00 Proceedings of the 26th International Conference on Very Large Data Bases, 2000. [14] S. F. Galán and F. J. Díez, "Modelling dynamic causal interactions