Engine performance and exhaust emission characteristics
of paraffinic diesel fuel in a model diesel engine
Petr Jevič, Radek Pražan*, Zdeňka Šedivá
Research Institute of Agricultural Engineering, Prague, Czech Republic
*Corresponding author: prazan@vuzt.czAbstract
Jevič P., Pražan R., Šedivá Z. (2018): Engine performance and exhaust emission characteristics of paraffinic diesel fuel in a model diesel engine. Res. Agr. Eng., 64: 85–95.
The article deals with verification of a diesel fuel and two fuel mixtures blends with different amounts of the bio-component using the model single-cylinder engine without the additional equipment for treatment of exhaust gases. This combustion diesel engine served for measuring the performance characteristics of the model single-cylinder en-gine and the individual emission components in order to assess the use of these blends of liquid paraffinic diesel fuel in practice and to meet current and forthcoming European legislation and to fulfil the commitments by 2020. A detailed chemical analysis was performed in case of all the tested paraffinic diesel fuels.
Keywords: combustion engine; renewable blending component; hydrotreated vegetable oil; engine performance; laboratory test
https://doi.org/10.17221/113/2017-RAE
The compression ignition engines use diesel as a fuel according to the standard EN 590:2013 (Auto-motive fuels – Diesel – Requirements and test meth-ods) that reduces the content of Fatty acid methyl esters (FAME) to 7% (V/V). The following fuels are used as well FAME EN 14214:2012 (Liquid petro-leum products – Fatty acid methyl esters (FAME) for use in diesel engines and heating applications – Requirements and test methods) (2012+A1) at 100% concentration: high FAME diesel fuel (B20 and B30) according to the standard EN 16709:2015 (Automo-tive fuels – High FAME diesel fuel (B20 and B30) – Requirements and test methods.), diesel fuels blends containing FAME B30 according to the standard ČSN 65 6508:2013 (Automotive fuels – Diesel fuel blends containing Fatty acid methyl esters (FAME) – Requirements and test methods.).
One of the possible alternatives to meet the re-quired reduction of CO2 greenhouse gas emission is the use of paraffinic diesel fuel from synthesis or hy-drotreatment (synthesized hydrocarbons), including hydrotreated vegetable oil (HVO), hydroprocessed esters and fatty acids (HEFAs), Fischer-Tropsch biomass to liquid (FT-BtL), gas to liquid (GtL) and power to liquid (PtL). It is possible to use them sepa-rately or add them to diesel in such amount so that the final mixture complies with the requirements of the standard EN 590:2013. As there is no manufac-turing capacity in the Czech Republic, the imported raw materials would be used in the initial period. The manufacturing capacity is currently considered in the Czech Republic. The operating test to produce diesel with HVO was performed in the end of 2016 in the company Česká rafinérská a.s.
Supported by the National Agency for Agricultural Research (NAZV), Project No QJ1510385. This article was presented at the 10th Internаtional Sсientific Conferenсe of Centrаl and Еаstern Europeаn Institutes of Agriсulturаl Еngineering (CЕЕ AgЕng) took
The issue of production and use of HVO/HEFAS is widely discussed at an international level (Rein-hardt et al. 2006; Murtonen et al. 2009; Mäki-nen et al. 2011; Erkkilä et al. 2011a; McKone et al. 2011; Naumann et al. 2016). Commercially, the hydrogenation process for processing vegeta-ble oils is operated by the company Neste Oil and their products are labelled NExBTL (Nylund et al. 2011; Naumann et al. 2016). Raw materials used for production of hydrotreated vegetable oil are the palm oil, spent vegetable oils and waste animal fats. The possibility to use the algae oil has been verified recently and the use of microbial oil is currently being investigated. The quality require-ments for these paraffin-based fuels intended for compression ignition engines with regard to their needs are recorded in the technical specification of the standard EN 15940:2016 (Automotive fuels – Paraffinic diesel fuel from synthesis or hydro treat-ment – Requirehydro treat-ments and test methods.). More than 98% of this fuel consists of paraffins, max. 1% consists of aromatics and max. 0.1% consists of polyaromatics and olefins. The elimination of oxy-gen from triacylglycerols (TAG) by means of the catalyst in a hydrogen atmosphere at elevated tem-peratures makes it possible to produce a mixture of synthetic alkanes. Unlike the process of trans-esterification, the triacylglycerols make it possible to process materials with high content of free fatty acids (Hancsok et al. 2007; Mikulec et al. 2010; Lapuerta et al. 2011). HVO/HEFAs are character-ized by lower density and viscosity in comparison with fossil fuel and biodiesel. The products have ultra-low sulphur content, high cetane number and high net calorific value, which is suitable for the combustion engines (Mikkonen et al. 2012). With regard to the above presented qualitative in-dicators, using HVO/HEFAs and their mixtures with diesel and FAME results in significant savings of GHG emissions (Aatola et al. 2009). The re-sults of HVO/HEFA evaluation for different driv-ing concepts and fuels for agricultural tractors are described by Ettl et al. 2014.
MATERIALS AND METHODS
Based on the previous experience and particu-larly on the Regulation No. 49 issued by the UN/ ECE regarding the effect of HVO and its blends on the performance parameters of the engines, and
also based on the results of measurement of the monitored emissions of exhaust gases, the fuels that were used for tests and measurements in the laboratory single-cylinder engine were the diesel fuel which meets EN 590 such as standard and base fuel, mixture of 30% of HVO biofuel with standard diesel fuel which meets the standard EN ISO 590 and neat 100% HVO biofuel HVO100 (Table 1).
The experimental compression ignition single-cylinder AVL engine, type 5402.088 installed in the set „AVL Compact Single Cylinder Test Bed“ was chosen for testing the impact of fuels. This engine was not equipped with any device for treatment of exhaust gases (such as the oxidation catalyst, par-ticulate filter, or recirculation of exhaust gases into the combustion chamber – EGR). In order to im-prove the repeatability of the measurement, the ex-ternal device AVL 577 was used in the set serving to maintain constant pressure and temperature of the oil and the coolant. Therefore, the engine had dry crankcase and did not have its own pump for the oil and the coolant. The device AVL 515 prepares the air that is sucked into the engine. This device main-tains constant filling pressure and temperature of the intake air. The external compressor serves as the source of pressure. The exhaust is equipped with the stilling container with volume of ca 60 l behind which there is proportionally electronically controlled throttle controlling backpressure in the exhaust. This system allows considerably independ-ent adjustmindepend-ent of the filling and exhaust pressure. All samples were taken from the exhaust pipe of the engine. Basic parameters of the experimental com-pression ignition engine, the dynamometer and the accessories are shown in Table 2. Description of the used measuring device is shown in Table 3.
https://doi.org/10.17221/113/2017-RAE
Table 1. Physical and chemical properties of the tested fuels
Property Unit Diesel EN 590 temperate,
climates Diesel
Fuel sample Diesel blends
30 % (V·V–1)
HVO
Neat 100% HVO
Paraffinic diesel fuel EN 15940 temper-ate, climates Start of distillation °C – 177.2 183.7 187.9 –
Distillation
at 250°C recovered % (V/V) < 65 40.1 30.6 2.8 < 65 at 350°C recovered % (V/V) min. 85 96.9 – – min. 85 95% (V/V) recovered at °C max. 360 343.7 326.6 291.0 max. 360 Total distillation volume % (V/V) – 98.3 99.9 98.1 – End of distillation °C – 350.2 344.9 298.1 – Flash point in closed cap °C above 55 67.5 68.0 69 above 55 CFPP °C < (+5 to –20) –24 –27 –39 < (+5 to –20)
Cloud point °C – –7 –11 –34 –
Polycyclic aromatic
hydrocar-bons % (m·m–1) max. 8.0 5.0 3.6 < 0.1 max. 1.1 Fatty acid methyl esters content % (V/V) max. 7.0 6.3 4.6 < 0.3 max. 7.0 HVO content % (V/V) – 30.4 > 99.7 Water content mg·kg–1 max. 200 50 40 30 max. 200
Sulphur content mg·kg–1 max. 10.0 8.5 6.1 < 3.0 max. 5.0
Ash content % (m·m–1) max. 0.01 < 0.001 < 0.001 < 0.001 max. 0.010
Total contamination mg·kg–1 max. 24 < 6.0 < 6.0 < 6.0 max. 24
Carbon residue on 10%
Distilla-tion residue % (m·m–1) max. 0.30 0.03 0.01 0.01 max. 0.30 Copper strip corrosion rating class 1 class 1 class 1 class 1 class 1 Lubricity, wear scar diameter
(wsd) at 60°C µm max. 460 178 195 423 max. 460 Viscosity at 40°C mm2·s–1 2.000–4.500 2.621 2.650 2.855 2.000–4.500
Total insoluble sediment g·m–3 – 1.0 1.0 1.0 –
Oxidation stability Rancimat
(110°C) h min. 20.0 20,1 20,1 57.2 min. 20 Oxidation stability PetroOxy min – 96.3 96.5 67.8 – Cetane number – min. 51 51.1 55.1 74.9 min. 70 Cetane index – min. 46 49.6 59.6 91.6 – Density at 15°C kg·m–3 820-845 840.1 822.1 779.6 765.0–800.0
Net calorific value MJ·kg–1 – 43,11 43,36 44,04 –
unconventional drive of additional equipment and thus passive resistance (the crankshaft of the meas-ured model single-cylinder engine serves as a drive for two balance shafts, the pump of coolant and lu-bricating oil is driven externally, the high-pressure injection pump is driven by the fully-dimensional engine), the value of indicated mean effective pres-sure in the cylinder was used for interpretation of
the load. All presented energy and emission param-eters of the AVL engine, type 5402.088 are thus re-lated to the indicated performance. The construc-tion of external rotaconstruc-tion speed characteristics of the experimental single-cylinder engine is shown in Fig. 1.
Table 2. Parameters of the experimental compression ignition single-cylinder AVL engine, type 5402.088, dynamom-eter and accessories
Bore / piston stroke, compression ratio 85 × 90 mm, 16:1 (max. combustion pressure 150 bar) Max. engine speed
Max. dynamometer speed
Nominal moment/dynamometer performance
4,200 min–1
8,000 min–1
180 Nm (0–3000 min–1) / 58 kW (3000–8,000 min–1)
Fuel injection (max. injection pressure 1,800 bar)BOSCH Common Rail
Injection control unit Open control unit AVL RPEMS + calibration SW/HW ETAS INCA v 7.0
Cooling/heating of oil and coolant temperature of coolant
temperature of lubricating oil
AVL 577 – unit for supply and treatment of coolant and lubricating oil
adjustable in range 35–120°C adjustable in range 35–110°C Preparation of intake air
temperature of intake air pressure of intake air
AVL 515 – supercharging unit, preparation of intake air adjustable in range 30–120°C
adjustable in range 1–4 bar absolutely
Table 3. Measuring device used for the experimental compression ignition single-cylinder AVL engine, type 5402.088
Description Designation Measuring range Accuracy Fuel balance AVL 733 0–500 g ± (0.12–4%) Indication of rapidly changing
pressures AVL INDIMODUL/INDICOM
Charge amplifier AVL micro IFEM 10 Hz–1 kHz + 0.5 up – 0.25% Cylinder pressure sensor AVL GU22C 0–250 bar ± 0.3% FSO Emissions devices
Analyzer of gaseous com-ponents in raw undiluted exhaust gases
AVL AMA i60 CO CO2
HC NO O2
0–10% V/V 0–20% V/V 0–20,000 ppm V/V
0–9,000 ppm V/V 0–23 % V/V
± 0.01% V/V ± 0.1% V/V ± 1 ppm V/V ± 1 ppm V/V 0.01 %V/V
Smoke AVL 415SE 0–10 FSN ± 0.01 %
Opacity AVL 439 0–100 HSU ± 0.1 %
Gravimetric sampling of
particulates AVL 472 Smart Sampler
Counting number of particles AVL PC 489 0–10,000 #/cm3 ± 10 %
[image:4.595.65.533.351.705.2]Weight Sartorius CP2P-F 0–500 mg ± 0.001 mg
Fig. 1. External rotation speed characteristics of the experi-mental compression ignition single-cylinder AVL engine, type 5402.088
Net IMEP – Net indicated mean effective pressure inte-grated over the cycle – 720°
0 500 1,000 1,500
1,500 2,000 2,500 3,000 3,500
N
et IM
EP
(k
Pa
)
https://doi.org/10.17221/113/2017-RAE
order to determine gravimetrically the weight of emitted particles, each point was provided with a weight by means of which the overall value for the cycle was calculated as a weighted average of values measured in the individual points. The calculation was done by means of software of the relevant de-vice. This calculation includes corrections to actu-ally reached values of dilution and time of intake through the filter. The individual points and pro-vided weights are shown in Table 4.
RESULTS AND DISCUSSION
The summary results of the tested fuel samples in the WHSC cycle are shown in Table 5 in absolute terms and also in relative terms with regard to the referential fuel – diesel. Each listed value is evaluat-ed as a weightevaluat-ed average of the test cycle. The emis-sions measured in the test were evaluated as follows: for gaseous components of emissions, the mass flow of the component was evaluated for each measured point in the cycle. In case of other calculations, val-ues of emissions in wet exhaust gases were used for all components irrespective of the method of sample treatment with respect to water content. The result-ing mass flow of the whole cycle was determined as a sum of coefficients of partial mass flows and weight factors. The resulting specific mass flow of
the component was determined as the quotient of the absolute mass flow of the component and the medium-indicated engine performance. The medi-um-indicated performance in the test was weighted by the same algorithm with the same weighting fac-tors as the emission components.
[image:5.595.66.531.127.344.2]Comparison of medium-indicated engine per-formance (Pi) in the test is presented as a graph (Fig. 2). Pi grew by 1.38% during the measurement. The graphic presentation of results of the examined fuels shows an increase of indicated power Pi with increasing concentration of HVO in the fuel. This trend can be considered as proved due to its defi-nite course and achieved highest difference 4.53% Table 4. Definition of operating points of the WHSC cycle using the experimental compression ignition single-cylin-der AVL engine, type 5402.088
Point Engine speed (rev·min–1) Pint (kPa) Pairset (kPa) EGP set (V) Gas pedal (%) Weighting factor (1) Mode/AVL sampling time (s)
1 800 142 0 8 9.6 0.112 275/58.1
2 2,499 1,273 100 8.8 100 0.026 275/72.6 3 2,499 318 25 8.8 25 0.132 275/272.1 4 2,499 891 70 8.8 70 0.039 275/100.2 5 1,881 1,403 100 9 100 0.026 275/54.6 6 1,572 373 10 8.8 24 0.105 275/119.3 7 2,190 937 70 8.8 70 0.039 275/87.8
8 2,190 335 25 8.8 25 0.079 275139.1
9 2,499 637 50 8.8 50 0.066 275/156.5 10 3,117 1,097 100 8.6 100 0.026 275/90.5 11 1,881 708 50 8.8 46.4 0.105 275/194.6 12 1,881 355 20 8.8 25 0.132 275/196.6
13 800 142 0 8 9.6 0.112 275/58.1
pint – the measured value of the pressure in the combustion cylinder (kPa); pairset – set point pressure in the intake manifold of the engine (kPa); EGP set – managing set point throttle exhaust (2–10 V)
Fig. 2. Medium-indicated engine performance Pi and
rela-tive engine performance ΔPi
4.21
4.27
4.40
0.0
1.41
4.53
0.0 0.5 1.0 1.5 2.0 2.5 3.0 3.5 4.0 4.5 5.0
4.10 4.15 4.20 4.25 4.30 4.35 4.40 4.45
Diesel Fuel Diesel + HVO30 HVO100
Δ
Pi
(%
)
Pi
_te
st
(k
W
[image:5.595.307.529.581.723.2](measured fuel HVO100), i.e. higher than the achieved error of the measurement repeatability.
The following comparison of quantities meas-ured in the test is presented as a graph (Fig. 3). At the top of the graph, there are absolute values and at the bottom there are relative increments to the referential diesel fuel. This type of graph will be used for all further presented quantities.
The comparison of net indicated specific fuel consumption (nsfc) for different fuels is shown in Fig. 3a. The graphs show a favourable effect of the increasing concentration of HVO, which causes re-duction of the specific fuel consumption (sfc). This result is influenced by higher achieved indicated performance for higher concentrations of HVO, and also lower density of HVO compared to diesel.
The carbon monoxide emissions (CO) are shown in Fig. 3b. The effect of increasing concentration of HVO in the fuel is evident and its progress is continuous and clear. Concerning the WHSC test for engines of commercial vehicles, the emission standard Euro 6 sets a limit 1,500 mg·kWh–1 for
this harmful emission. It can be assumed that a common modern engine with the system of addi-tional treatment of exhaust gases with the oxida-tion catalyst for all measured fuels would success-fully manage the carbon monoxide emission.
[image:6.595.70.531.124.508.2]The specific emissions of carbon dioxide (CO2) are shown in Fig. 3c. A small decrease of CO2 con-centration with increasing concon-centration of HVO is probably caused by different proportion of car-bon in the fuel.
Table 5. Summary results of the tested fuel samples in the emission cycle WHSC in the experimental compression ignition single-cylinder AVL engine, type 5402.088
Fuel designation Diesel fuel Diesel fuel + HVO30 HVO100
HVO content (%) 0 30 100
Air temperature (°C) 20.9–22.5 18.3–22.9 23.3–23.9 Humidity (%) 20.7–23.6 28.6–37.6 25.2–26.4
Number of filter for PM 2 3 4
mCO_test (mg·kWh–1) 4,400 3,273 1,679
mCO2_test (g·kWh–1) 580 569 559
mNOx_test (mg·kWh–1) 7036 6,780 6,738
mHC_test (mg·kWh–1) 275 188 98
nsfc_test (g·kWh–1) 185.74 181.64 177.36
PN_test (#·kWh–1) 1.6.1013 1.5 × 10¹³ 1.2 × 10¹³
Opacity_test_avg (HSU) 6.3 × 10–01 5.7 × 10–01 4.6 × 10–01
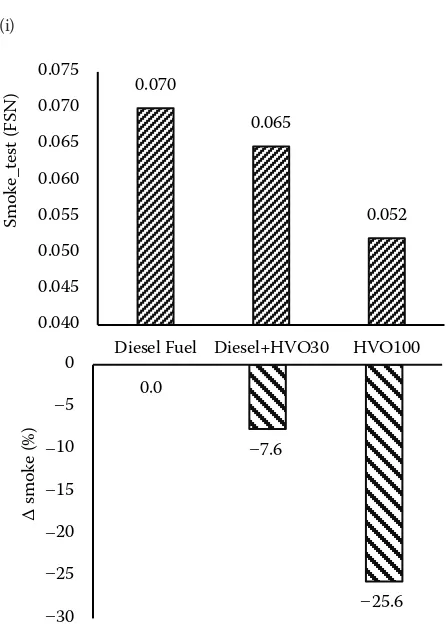
Smoke_test_avg (FSN) 7.3 × 10–02 6.7 × 10–02 5.4 × 10–02
PM (mg·kWh–1) 0.106 0.052 0.021
Pi_test (kW) 4.214 4.273 4.405
Relative expression in relation to the referential fuel (diesel fuel)
mCO_test (%) 0.0 –25.6 –61.8
mCO2_test (g·kWh) 0.0 –1.8 –3.6
mNOx_test (%) 0.0 –3.6 –4.2
mHC_test (%) 0.0 –31.5 –64.3
nsfc_test (%) 0.0 –2.2 –4.5
PN (%) 0.0 –10.5 –24.5
Opacity_test_avg (%) 0.0 –9.3 –26.9
Smoke_test_avg (%) 0.0 –7.6 –25.6
PM (%) 0.0 –50.9 –80.2
Δ Pi_test (%) 0.0 1.4 4.5
https://doi.org/10.17221/113/2017-RAE 185.7 181.6 177.4 172 174 176 178 180 182 184 186 188
Diesel Fuel Diesel+HVO30 HVO100
ns fc_t es t ( g/ ·kW h –1) 4,400 3,273 1,679 1,000 1,500 2,000 2,500 3,000 3,500 4,000 4,500 5,000
Diesel Fuel Diesel+HVO30 HVO100
m C O _t es t ( m g· kW h –1) 580 569 559 545 550 555 560 565 570 575 580 585
Diesel Fuel Diesel+HVO30 HVO100
mC O2 _t es t ( g· kW h –1) 0.0 -2.2 -4.5 -5.0 -4.0 -3.0 -2.0 -1.0 0.0 Δ ns fc ( % ) 0.0 -25.6 -61.8 -70.0 -60.0 -50.0 -40.0 -30.0 -20.0 -10.0 0.0 Δ C O ( % ) 0.0 -1.8 -3.6 -4.0 -3.0 -2.0 -1.0 0.0 Δ CO 2 (%) 185.7 181.6 177.4 172 174 176 178 180 182 184 186 188
Diesel Fuel Diesel+HVO30 HVO100
ns fc_t es t ( g/ ·kW h
–1) 4,400
3,273 1,679 1,000 1,500 2,000 2,500 3,000 3,500 4,000 4,500 5,000
Diesel Fuel Diesel+HVO30 HVO100
m C O _t es t ( m g· kW h –1) 580 569 559 545 550 555 560 565 570 575 580 585
Diesel Fuel Diesel+HVO30 HVO100
mC O2 _t es t ( g· kW h –1) 0.0 -2.2 -4.5 -5.0 -4.0 -3.0 -2.0 -1.0 0.0 Δ ns fc ( % ) 0.0 -25.6 -61.8 -70.0 -60.0 -50.0 -40.0 -30.0 -20.0 -10.0 0.0 Δ C O ( % ) 0.0 -1.8 -3.6 -4.0 -3.0 -2.0 -1.0 0.0 Δ CO 2 (%) 185.7 181.6 177.4 172 174 176 178 180 182 184 186 188
Diesel Fuel Diesel+HVO30 HVO100
ns fc_t es t ( g/ ·kW h –1) 4,400 3,273 1,679 1,000 1,500 2,000 2,500 3,000 3,500 4,000 4,500 5,000
Diesel Fuel Diesel+HVO30 HVO100
m C O _t es t ( m g· kW h –1) 580 569 559 545 550 555 560 565 570 575 580 585
Diesel Fuel Diesel+HVO30 HVO100
[image:7.595.63.530.81.697.2]mC O2 _t es t ( g· kW h –1) 0.0 -2.2 -4.5 -5.0 -4.0 -3.0 -2.0 -1.0 0.0 Δ ns fc ( % ) 0.0 -25.6 -61.8 -70.0 -60.0 -50.0 -40.0 -30.0 -20.0 -10.0 0.0 Δ C O ( % ) 0.0 -1.8 -3.6 -4.0 -3.0 -2.0 -1.0 0.0 Δ CO 2 (%)
Fig. 3. Results of the WHSC cycle, indicated specific fuel consumption (a), specific emissions of CO (b), specific
emis-sions of CO2 (c), specific emissions of NOx (d), specific production of HC (e), particle number emissions (PN) (f), Specific
particulate matter emissions (PM) (g), opacity(h), and smoke (i)
7,036 6,780 6,738 6,500 6,600 6,700 6,800 6,900 7,000 7,100
Diesel Fuel Diesel+HVO30 HVO100
m N O x_t es t ( m g· kW h –1) 275 188 98 0 50 100 150 200 250 300
Diesel Fuel HVO100
m H C _t es t( m g· kW h –1) 1.6E+13 1.5E+13 1.2E+13 1.0E+00 2.0E+12 4.0E+12 6.0E+12 8.0E+12 1.0E+13 1.2E+13 1.4E+13 1.6E+13 1.8E+13
Diesel Fuel Diesel+HVO30 HVO100
PN
_t
es
t (
#· kW h –1) 0.0 -3.6 -4.2 -5.0 -4.0 -3.0 -2.0 -1.0 0.0 Δ m NOx (% ) 0.0 -31.5 -64.3 -70.0 -60.0 -50.0 -40.0 -30.0 -20.0 -10.0 0.0 Δ m H C ( %) 0 -10.5 -24.5 -30 -25 -20 -15 -10 -5 0 Δ PN ( %) 7,036 6,780 6,738 6,500 6,600 6,700 6,800 6,900 7,000 7,100
Diesel Fuel Diesel+HVO30 HVO100
m N O x_t es t ( m g· kW h –1) 275 188 98 0 50 100 150 200 250 300
Diesel Fuel HVO100
m H C _t es t( m g· kW h –1) 1.6E+13 1.5E+13 1.2E+13 1.0E+00 2.0E+12 4.0E+12 6.0E+12 8.0E+12 1.0E+13 1.2E+13 1.4E+13 1.6E+13 1.8E+13
Diesel Fuel Diesel+HVO30 HVO100
PN
_t
es
t (
#· kW h –1) 0.0 -3.6 -4.2 -5.0 -4.0 -3.0 -2.0 -1.0 0.0 Δ m NOx (% ) 0.0 -31.5 -64.3 -70.0 -60.0 -50.0 -40.0 -30.0 -20.0 -10.0 0.0 Δ m H C ( %) 0 -10.5 -24.5 -30 -25 -20 -15 -10 -5 0 Δ PN ( %) 0.106 0.052 0.021 0.00 0.02 0.04 0.06 0.08 0.10 0.12
Diesel Fuel Diesel+HVO30 HVO100
PM _t es t ( g· kW h –1) 0.63 0.57 0.46 0.40 0.45 0.50 0.55 0.60 0.65
Diesel Fuel HVO100
O paci ty_t es t ( H SU ) 0.070 0.065 0.052 0.040 0.045 0.050 0.055 0.060 0.065 0.070 0.075
Diesel Fuel Diesel+HVO30 HVO100
Sm ok e_ te st (F SN ) 0.0 -50.9 -80.2 -100 -80 -60 -40 -20 0 Δ PM ( % ) 0.0 -9.3 -26.9 -30.0 -25.0 -20.0 -15.0 -10.0 -5.0 0.0 Δ op aci ty ( % ) 0.0 -7.6 -25.6 -30 -25 -20 -15 -10 -5 0 Δ sm oke ( % ) 0.106 0.052 0.021 0.00 0.02 0.04 0.06 0.08 0.10 0.12
Diesel Fuel Diesel+HVO30 HVO100
PM _t es t ( g· kW h –1) 0.63 0.57 0.46 0.40 0.45 0.50 0.55 0.60 0.65
Diesel Fuel HVO100
O paci ty_t es t ( H SU ) 0.070 0.065 0.052 0.040 0.045 0.050 0.055 0.060 0.065 0.070 0.075
Diesel Fuel Diesel+HVO30 HVO100
[image:8.595.60.533.101.735.2]Sm ok e_ te st (F SN ) 0.0 -50.9 -80.2 -100 -80 -60 -40 -20 0 Δ PM ( % ) 0.0 -9.3 -26.9 -30.0 -25.0 -20.0 -15.0 -10.0 -5.0 0.0 Δ op aci ty ( % ) 0.0 -7.6 -25.6 -30 -25 -20 -15 -10 -5 0 Δ sm oke ( % )
Fig. 3. to be continued
7,036 6,780 6,738 6,500 6,600 6,700 6,800 6,900 7,000 7,100
Diesel Fuel Diesel+HVO30 HVO100
m N O x_t es t ( m g· kW h –1) 275 188 98 0 50 100 150 200 250 300
Diesel Fuel HVO100
m H C _t es t( m g· kW h –1) 1.6E+13 1.5E+13 1.2E+13 1.0E+00 2.0E+12 4.0E+12 6.0E+12 8.0E+12 1.0E+13 1.2E+13 1.4E+13 1.6E+13 1.8E+13
Diesel Fuel Diesel+HVO30 HVO100
PN
_t
es
t (
#· kW h –1) 0.0 -3.6 -4.2 -5.0 -4.0 -3.0 -2.0 -1.0 0.0 Δ m NOx (% ) 0.0 -31.5 -64.3 -70.0 -60.0 -50.0 -40.0 -30.0 -20.0 -10.0 0.0 Δ m H C ( %) 0 -10.5 -24.5 -30 -25 -20 -15 -10 -5 0 Δ PN ( %) 7,036 6,780 6,738 6,500 6,600 6,700 6,800 6,900 7,000 7,100
Diesel Fuel Diesel+HVO30 HVO100
m N O x_t es t ( m g· kW h –1) 275 188 98 0 50 100 150 200 250 300
Diesel Fuel HVO100
m H C _t es t( m g· kW h –1) 1.6E+13 1.5E+13 1.2E+13 1.0E+00 2.0E+12 4.0E+12 6.0E+12 8.0E+12 1.0E+13 1.2E+13 1.4E+13 1.6E+13 1.8E+13
Diesel Fuel Diesel+HVO30 HVO100
PN
_t
es
t (
https://doi.org/10.17221/113/2017-RAE
0.106
0.052
0.021
0.00 0.02 0.04 0.06 0.08 0.10 0.12
Diesel Fuel Diesel+HVO30 HVO100
PM
_t
es
t (
g·
kW
h
–1)
0.63
0.57
0.46
0.40 0.45 0.50 0.55 0.60 0.65
Diesel Fuel HVO100
O
paci
ty_t
es
t (
H
SU
)
0.070
0.065
0.052
0.040 0.045 0.050 0.055 0.060 0.065 0.070 0.075
Diesel Fuel Diesel+HVO30 HVO100
Sm
ok
e_
te
st
(F
SN
)
0.0
-50.9
-80.2 -100
-80 -60 -40 -20 0
Δ
PM (
%
)
0.0
-9.3
-26.9 -30.0
-25.0 -20.0 -15.0 -10.0 -5.0 0.0
Δ op
aci
ty (
%
)
0.0
-7.6
-25.6 -30
-25 -20 -15 -10 -5 0
Δ
sm
oke (
%
)
The nitrogen oxides emissions (NOx) in the test are shown in Fig. 3d. The measured values in case of the tested fuels show a slight decrease of NOx concentration with the increasing concentration of HVO. With regard to a less smooth progress of this dependence, it is necessary to interpret this lit-tle noticeable benefit very carefully. The achieved concentrations are also quite distant from the lim-its of the Euro 6 standard (400 mg·kWh–1). This is
in compliance with the contemporary and already generally known experience that it is virtually im-possible to meet this standard without the system of selective catalytic reduction (SCR).
The emission of unburned hydrocarbons (HC) in the cycle is shown in Fig. 3e. It is evident that the presence of HVO in the fuel positively affects the emission of the particular pollutant. In case of 100% HVO, the level of the pollutant even gives a chance of reaching the limit set by the Euro 6 standard for the WHSC cycle even without the additional treatment of the exhaust gases (the limit is 130 mg·kWh–1). However, the HC
emis-sions (together with CO) are not a problematic component of the diesel exhaust gases as they can
be quite successfully disposed of in the oxidation catalyst.
The graph in Fig. 3f clearly shows a positive influ-ence of HVO on the amount of particles (PN) in the exhaust gases (measured by means of the particle counter AVL 489; AVL LIST GmbH, Austria), the progress of the trend is clear. The Euro 6 standard sets a value of 8.0 × 1,011 particles·kWh–1, which is
a value ca by one order higher than the measured value. This is in compliance with the contemporary need for providing the compression ignition en-gines with the particles filter.
[image:9.595.64.288.88.401.2]The gravimetric measurement of the mass pro-duction of solid particles (PM) is summarized in Fig. 3g. It is clear that the production of gravimet-rically measured emission of PM significantly re-duces, in case of 100% HVO even by 80.2%. Further argumentation is in compliance with the above-mentioned description of particles formation.
The measurement of visible smoke and the opaci-ty evaluation is shown in Fig. 3h. The effect of HVO in the fuel is positive again, since it causes almost a proportional decrease of smoke with increasing proportion of HVO in the fuel.
Smoke was measured by means of the filter meth-od. The courses of smoke are depicted in Fig. 3i and they are quite similar to the above-mentioned measurement of opacity and it is possible to use similar argumentation.
In earlier studies (Miers et al. 2005; Kitano et al. 2007; Larsson, Denbratt 2007) the results show consistently lower soot emission with GtL or FT-BtL fuel than with crude oil-based diesel fuel, whereas the reductions in NOx emissions are not clear. In the studies in which emissions of a passen-ger car or passenpassen-ger car-engine size are measured with GtL, there are no clear and consistent reduc-tions in NOx compared to crude oil-based diesel fuel. According to Erkkilä et al. (2011b) a dem-onstration project using NExBtL in some 300 buses in the Helsinki metropolitan area was organized in 2007–2010. Test fuels consisted of a 30% blend of NExBtL and neat (100%) NExBtL. Neat NExBtL re-duced NOx emissions by 10% and particulates by 30% compared to the conventional diesel fuel.
An average relative change of the measured emis-sions (CO, HC, NOx, smoke), and volumetric and mass-based fuel consumption of the test engine ran with default injection timings is presented by Nylund et al. (2011). The test engine was a tur-bocharged 8.4 litre 6-cylinder 4-stroke direct in-Fig. 3. to be continued
(i)
– –
jection heavy-duty diesel engine. The engine was equipped with a common-rail fuel injection system and a charge air cooler. No EGR or exhaust after-treatment device was used. Nominal power of the engine was 225kW at 2,200 rev·min–1. As it can be
seen from HVO and HVO 30 (EN 590-30) com-pared with EN 590 fuel as the reference fuel, aver-age reductions of all emissions are clear with 100% HVO. The most significant reduction of about 35% is measured in smoke. With 100% HVO, NOx emis-sion is reduced about 5%. With the EN 590-30 die-sel fuel, smoke is reduced about 11% but NOx is found to be approximately the same as with the ref-erence fuel. The changes in HC and CO emissions are not very significant in absolute terms because of the already quite low absolute values. Compared with the reference fuel, gravimetric specific fuel consumption is reduced with 100% HVO and with EN 590-30 diesel fuel because of the higher mass-based effective heating value of the HVO. Volumet-ric fuel consumption is increased with 100% HVO and with EN 590-30 diesel fuel because of the lower volumetric effective heating value of the HVO.
The diesel vehicle fleet in Europe is generally validated for fuels with a HFRR wear scar diameter of maximum 460 µm thus correlating to a SL-BO-CLE value of > 3,500 g (Nikamjan 1999). No or low aromatic fuels do not necessarily have the same good lubrication characteristics as crude oil-based diesel fuels protecting simultaneously against wear and seizure. Some paraffinic fuels poor in “natural” seizure protection do not protect against seizure even if the WSD in the HFRR test is adjusted to < 460 µm. All lubricity additives reduce the risk of wear. However, depending on the nature of the fuel and the type and concentration of the additive used for adjusting the lack of lubricity, adequate seizure protections is not necessarily ensured by low values in the HFRR test on its own (Table 1).
CONCLUSIONS
Altogether three samples of fuels were tested in the experimental single-cylinder engine in the en-gine dynamometer laboratory by means of the test based on the WHSC cycle. The evaluation con-cerned the overall energy and emissions parame-ters such as specific values related to the indicated power (all values were averaged). In case of both energy and emission parameters there are evident
trends concerning dependence on the measured fuel.
The proportion of HVO in the fuel had a slightly positive effect on the indicated power Pi and spe-cific fuel consumption according to NSFC. It did not significantly affect the amount of emitted nitro-gen oxides NOx. However, it has a very positive ef-fect on smoke and the amount of emitted particles measured according to all available methodologies. The same can be said about the emissions of car-bon monoxide and hydrocarcar-bons. From the point of view of the observed parameters, the increased pro-portion of HVO in the fuel had only a positive effect.
The diesel fuel high in paraffin content does not always protect fuel system components sufficiently against seizure. The lubricity requirement ensures protection against wear but not necessarily also against seizure. Appropriate seizure protection shall be provided by using suitable fuel additives or by blending of minimum 2% (V/V) of FAME. Par-affinic diesel fuel is not validated for all vehicles, thus consult the vehicle manufacturer before use.
HVO paraffinic diesel fuel can also offer a mean-ingful contribution to the target of increased non-petroleum and renewable content in transporta-tion fuel pool.
References
Aatola H., Larmi M., Sarjovaara T., Mikkonen S. (2009): Hydrotreated vegetable oil (HVO) as a renewable diesel fuel: trade-off between NOx, particulate emission and fuel consumption of a heavy duty engine. SAE International Journal of Engines, 1: 1251–1262.
Erkkilä K., Hartikka P., Laine P., Ahtiainen M., Rahkola,P., Ny-lund N.-O., Mäkelä K., Lappi M., Noponen K., Liimatainen H. (2011a): Energy-efficient and intelligent heavy-duty vehicle (HDENIQ). Annual report 2009. VTT report VTT-R-02704-11.
Erkkilä K., Nylund N.-O., Hulkkonen T., Tilli A., Mikkonen S., Saikkonen P., Mäkinen R., Amberla A. (2011b): Emis-sion performance of paraffinic HVO diesel fuel in heavy duty vehicles. JSAE/SAE Technical Paper JSAE 20119239. SAE 2011-01-1966.
Ettl J., Thuneke K., Remmele E., Emberger P., Widmann B. (2014): Future biofuels and driving concepts for agricultural tractors. European Biomass Conference and Exhibition. Hamburg, Germany: 23–25.
https://doi.org/10.17221/113/2017-RAE
over Pt/HZSM-22/Al2O3. Microporous and Mesoporous Material, 101: 148–152.
Kitano K., Misawa S., Mori M., Sakata I., Clark R.H. (2017): GTL fuel impact on DI diesel emissions. SAE Technical Paper 2007-01-2004.
Lapuerta M., Villajosa M., Agudelob JR., Boehman A.L. (2011): Key properties and blending strategies of hydro-treated vegetable oil as biofuel for diesel engines. Fuel Processing Technology, 92: 2406–2411.
Larsson M., Denbratt I. (2007): An experimental investigation of Fischer-Tropsch fuels in a light-duty diesel engine. SAE Technical Paper 2007-01-0030.
Mäkinen R., Nylund N.-O., Erkkilä K., Saikkonen P., Amberla A. (2011): Bus fleet operation on renewable paraffinic diesel fuel. JSAE/SAE Technical Paper JSAE 20119172/ SAE 2011-01-1965.
Mc Kone Rice D.W., Ginn T.R. (2011): California renewable diesel Multimedia Evaluation. University of California, Berkeley, Tier II Find report, September 2011.
Miers S.A., Ng H., Ciatti S.A., Stork K. (2005): Emissions, performance, and in-cylinder combustion analysis in a light-duty diesel engine operating on a Fischer-Tropsch biomass-to-liquid fuel. SAE Technical Paper 2005-01-3670. Mikkonen S., Hartikka T., Kuronen M., Saikkonen P. (2012):
HVO, hydrotreated vegetable oil – a premium renewable
biofuel for diesel engines. Neste Oil Proprietary publica-tion.
Mikulec J., Cvengroš J., Joríková Ľ., Banič M., Kleinová A. (2010): Second generation diesel fuel from renewable sources. Journal of Cleaner Production, 18: 917–926. Murtonen, T., Aakko-Saksa, P., Kuronen, M., Mikkonen, S.,
Lehtoranta, K. (2009): Emissions with heavy-duty diesel engines and vehicles using FAME, HVO and GTL fuels with and without DOC+POC Aftertreatment. SAE Technical Paper 2009-01-2693.
Naumann K., Oehmichen K., Remmele E., Thuneke K., Schröder J., Zeymer M., Zech K., Müller-Langer F. (2016): Monitoring Biokraftstoffesektor. 3. überarbeitete und erweiterte Auflage. Leipzig, DBFZ (DBFZ-Report No. 11). Nikanjam M. (1999): Diesel fuel lubricity: on the path to
specification. SAE Technical Paper 1999-01-1479. Nylund N.-O., Erkkilä K., Ahtiainen M. Murtonen T.,
Saik-konen P., Amberla A., Aatola H. (2011): Optimized usage of NExBTL renewable diesel fuel. OPTIBIO. Espoo 2011. VTT Tiedotteita – Research Notes 2604.
Reinhardt G., Gärtner S.O., Helms H., Rettenmaier N. (2006): An assessment of energy and greenhouse gases of NExBTL. Final Report. ifeu – Institute for Energy and Environmental Research Heidelberg GmbH. Heidelberg.