GENETIC ALGORITHM ASSISTED ADAPTIVE BEAMFORMING
M. Vitale, G. Vesentini, N.N. Ahmad, L. Hanzo
Dept. of ECS Univ. of Southampton, SO17 1BJ, UK.
Tel: +44-703-593 125, Fax: +44-703-594 508
[email protected], [email protected], [email protected]
http://www-mobile.ecs.soton.ac.uk
ABSTRACT
Genetic Algorithm (GA) assisted beamforming techniques are proposed as an alternative to conventional beamforming algo-rithms. The design of the corresponding GAs is highlighted and the achievable performance is characterised in terms of the Signal-to-Interference Ratio (SIR) and the Signal-to-Inter-ference plus Noise Ratio (SINR). It is demonstrated that an attractive SINR versus complexity trade-off is achievable by the proposed GA-assisted beamformers, provided that the GA parameters are appropriately chosen.
1. INTRODUCTION
Adaptive beamforming [1,2] is capable of separating signals trans-mitted in the same frequency band, provided that they arrive from different angles, i.e. they are separated in the spatial domain. This facilitates the separation of the desired signal from the interfer-ing signals. The beamforminterfer-ing process appropriately combines the signals received by the different elements of an antenna array in order to form a single output. An adaptive antenna array is capa-ble of optimising the beamforming pattern by adjusting the array weights such that the specific objective function used - for example the Signal-to-Interference plus Noise Ratio (SINR) is optimised. The specific choice of the adaptive beamforming algorithm deter-mines the speed of convergence, the hardware complexity required for implementing the algorithm and the overall performance of a system.
The properties of the antenna array may be varied over time in order to optimise the system’s performance for satisfying different optimisation criteria.These optimisation criteria may include mini-mizing the Mean-Square Error (MSE) between the desired and the actual array output, maximizing the array’s output power, maxi-mizing the Signal to Noise Ratio (SNR), minimaxi-mizing the effect of interference or maximizing the SINR, etc. Depending on the ar-ray’s operational environment, its performance optimisation met-ric and control algorithm may be varied in order to provide the best quality of service for the network users.
The optimisation of the antenna array pattern is typically sub-ject to a range of constraints and the classic methods of array weight optimisation [1] may get trapped in local minima, result-ing in a suboptimum beamformresult-ing performance. Consequently,
VTC 2002, Vancouver,Canada
The financial support of the following organisations is gratefully ac-knowledged: European Union; EPSRC, Swindon, UK;
heuristic optimisation algorithms, based on random search strate-gies have often been employed in this field [1, 4–6, 10].
In this paper, a Genetic Algorithm (GA) is developed for solv-ing the beamformsolv-ing weight optimisation problem. The concept of a GA is based on optimisation search strategies relying on the Darwinian principle of natural selection and evolution [9]. In the beamforming context the optimisation process involves a set of
po-tential array vector solutions, which are referred to asindividuals
in GA parlance that are gradually - but not monotonously - im-proved with the aid of genetic operations. The GA-assisted
optimi-sation process requires the definition of a so-calledfitness function,
which is evaluated for each individual throughout the evolutionary optimisation process exploiting the survival of the ’fit individuals’ in the natural selection. The aim of our study is to determine the weight values of an antenna array by using GAs.
In Section 2 we will investigate the performance potential of a state-of-the-art GA, seeking the configurations optimising the per-formance in terms of co-channel interference reduction, i.e. SIR and SINR maximization. Throughout our investigations we al-ways relate the achievable performance to the complexity required. Novel GA assisted techniques designed for enhancing the achiev-able performance are presented in Section 3, which are capachiev-able of expediting the search, while reducing the complexity necessi-tated. Finally, in Section 4 a GA based scheme is employed in conjunction with a spatial reference technique for more effectively exploiting a range of new GA features.
2. STATE-OF-THE-ART IN GA-ASSISTED BEAMFORMING
2.1. GA-Aided Adaptive Beamforming
In order to introduce the family of GAs cast in the context of beam-forming problems, we will highlight the model also often used in the studies reported in the literature [3,5,10]. Specifically, we
con-sider a linear array ofLomnidirectional elements placed in the far
field ofM uncorrelated point sources, separated by a distance of
d=λ/2, whereλis the wave-length of the sources. Thus, the GA
is employed for optimising a set ofLcomplex array weights on
the basis of the information contained in the so-called reference sequence [1] of each user. This strategy is referred to as the Tem-poral Reference Technique (TRT).
1. Encode the potential array weight solutions with the aid of the genes of the GA;
2. Create a string of the GA’s genes for the sake of forming a chromosome;
3. Create an initial population of GA-based solutions;
4. Evaluate and assign fitness values to individuals in the pop-ulation of the GA;
5. Perform reproduction with the aid of the fitness-propor-tionate selection of individuals from the population for
cre-ating the next generation of highaveragefitness
individu-als;
6. Perform mutation of the individuals of the new generation by slightly perturbing the individuals for the sake of pro-moting a higher diversity of solutions in an effort to avoid getting trapped in local minima.
Each weight of the antenna array is represented by a string of bits, where half the bits corresponds to the real part and the other half to the imaginary part of the array weight concerned. This rep-resentation assists us in creating a genetic model for the weight adaptation problem. Hence each complex array weight has two genes, namely a real and an imaginary gene, which jointly consti-tute a chromosome. The set of chromosomes represents an
indi-vidual, which corresponds to theL-dimensional complex weight
vector of theLelements of the array. The totality of the
individu-als, stored in a given generation of weight vectors, is referred to as the population.
The number of bits we used for representing each gene was a variable. It is important to be able to vary the number of bits per gene, since different optimisation problems may impose differ-ent constraints in terms of the target performance and the afford-able complexity. The decision variafford-ables used in our GA assisted beamformer were quantized to a given number of bits, although the weights of the antenna array to be calculated are continuous valued. We opted for the straightforward binary coded decimal (BCD) representation of the weight values.
The optimisation criterion we will use for adjusting the weights is the minimisation of the MSE between the array output and the reference signal [1]. In order to evaluate the fitness values of each
chromosome, the heuristic objective function ofFn= 1/(1+En)
has been used, whereFnis the fitness value of thenth individual
andEn=|r−wHx|2is the error term associated with thenth array
weight. Finally,ris the reference sequence,wHis the Hermitian
of the array weight vector andxis the received signal vector. Note
that the choice of this objective function is somewhatad hocand
it is based on the requirement of ensuring a reciprocal relationship
between the error termEnand the fitnessFn, while also
avoid-ing havavoid-ing an infinite fitness, when we haveEn=0. This results in
fitness values between zero and unity.
2.2. Simulation Results
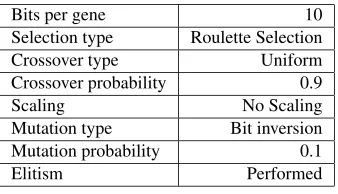
The main objective of our study is to find the set of GA parameters, which result in the highest possible GA performance. This task is extremely important, since different GAs having the same com-plexity may have dramatically different performances. We will commence our study by investigating one of the basic GA configu-rations known from the literature [6, 7], which is shown in Table 1. Fig. 1 (a) shows the achievable SIR performance versus the SNR of the GA-assisted beamformer characterised in Table 1 for
Bits per gene 10
Selection type Roulette Selection
Crossover type Uniform
Crossover probability 0.9
Scaling No Scaling
Mutation type Bit inversion
Mutation probability 0.1
[image:2.595.344.513.48.145.2]Elitism Performed
Table 1:GA parameters
both a high- and a low-complexity scenario associated with a pop-ulation size of 60 and a total of 60 generations, as well as a popula-tion size of 200 and 600 generapopula-tions, respectively. The complexity of the associated search may be characterised with the aid of the number of objective function evaluations, which is given by the product of the number of the generations and the population size. As expected, better SIR values are achieved, when increasing the affordable complexity. Furthermore, the sensitivity of the SIR val-ues with respect to the number of bits used for representing the array weights is also shown in Fig. 1 (a).
The saturation of the SIR versus SNR=INR curves seen in Fig. 1 (a) at high SNR values suggests the presence of premature convergence to local minima, especially when the search-space is not fully explored due to the relatively low affordable complexity. In order to exploit the full potential of the GA-based optimisation algorithm - given a certain affordable complexity - the best pos-sible GA configuration has to be found with the aim of preserv-ing sufficient diversity for explorpreserv-ing the entire array-weight search space.
More explicitly, our aim is to configure the GA for explor-ing the entire space of the array weight solutions, preventexplor-ing pre-mature convergence, when relatively high-fitness but nonetheless suboptimum individuals are found. In other words, we will at-tempt to render the GA ”more doubtful” about the reliability of the first results emerging from the search, in order to ensure that other potential solutions will not be neglected. Naturally, avoid-ing the premature convergence will considerably reduce the rate of convergence. Hence, our aim is to find an attractive trade-off between the rate of convergence and the achievable SIR.
10 20 30 SNR = INR (dB) 10 20 30 40 50 SIR (dB) Standard GA
7 BITS PER GENE 60-60 AND 600-200 8 BITS PER GENE 60-60 AND 600-200 10 BITS PER GENE 60-60 AND 600-200
0.0 0.2 0.4 0.6
Maximum of the objective function 20
40 60
SIR
(dB)
Objective function study
.
.
.
.
.
.
.
.
.
.
. .
.
.
..
.
.
.
.
.
.
.
.
.
.
.
.
.
.
.
.
.
.
...
.
.
.
.
.
.
.
.
.
.
.
.
.
.
.
.
..
.
.
.
.
.
.
.
.
.
.
.
.
.
.
.
.
...
...
.
.
.
.
. .
.
.
.
.
.
.
..
.
.
.
.
....
.
.
.
.
.
.
.
.
.
.
.
.
.
.
.
.
.
.
.
.
.
. .
.
.
.
..
.
.
.
.
.
. .
.
.
..
.
.
.
.
..
.
.
.
.
.
.
.
.
..
.
.
...
.
.
.
.
.
..
.
. .
.
.
.
.
.
.
. .
.
.
.
.
.
.
.
.
..
.
.
.
.
.
.
.
.
.
.
.
.
. .
. .
.
. .
.
.
.
.
.
.
.
.
.
.
.
.
.
..
...
.
.
.
..
.
.
.
.
...
.
.
.
.
.
.
..
.
.
.
.
.
.
.
.
.
.
.
.
.
.
.
. .
.
.
.
.
...
.
.
.
.
...
.
.
.
.
.
.
.
..
.
..
.
.
.
.
.
.
..
.
..
.
.
.
.
.
.
.
.
.
.
.
.
...
.
.
.
.
.
.
.
.
.
.
..
.
.
.
.
.
.
.
.
.
.
.
.
.
.
. .
..
.
.
.
.
.
..
.
.
.
.
.
.
.
.
.
.
..
.
.
.
.
.
.
.
. .
.
.
.
.
..
.
.
.
.
.
..
.
.
.
...
.
.
.
.
.
..
.
. .
.
..
.
.
.
.
.
.
..
.
.
..
.
.
..
.
.
.
.
.
.
.
.
. .
.
.
.
.
.
.
..
.
.
.
.
.
.
.
.
.
.
.
. .
.
.
.
.
.
....
.
.
.
.
.
.
.
.
.
.
...
.
.
. .
.
.
.
..
.
.
.
.
.
.
.
.
.
.
. .
.
...
.
.
...
.
.
.
.
.
..
.
.
.
.
.
.
.
..
.
.
.
.
.
...
.
.
.
.
.
.
.
.
.
.
.
. .
.
. ..
.
....
.
.
.
.
.
.
.
.
.
...
.
.
.
. .
.
...
..
.
.
.
.
.
.
.
.
.
.
.
. .
.
.
.
..
..
.
.
.
..
.
.
.
.
..
.
.
.
..
.
.
.
..
.
.
.
.
.
.
.
.
.
.
.
.
.
.
.
. .
.
.
.
.
.
..
.
.
.
..
.
. .
.
.
.
.
.
..
.
.
.
.
.
.
.
.
.
.
.
.
..
.
.
.
.
.
.
.
.
.
.
.
.
..
.
.
.
.
.
.
.
.
.
.
.
.
.
.
.
.
.
..
.
.
.
.
.
. .
.
.
.
. .
.
.
.
.
.
...
.
.
.
.
..
.
.
.
.
.
..
.
.
.
.
.
.
.
.
.
.
..
.
.
.
..
.
.
.
.
..
.
.
.
.
.
.
.
.
.
.
.
.
.
.
.
.
.
.
.
.
.
.
.
..
. .
.
.
.
.
.
.
.
.
.
.
.
.
.
..
.
.
.
.
.
.
...
.
.
..
.
.
.
..
.
.
.
.
.
.
.
.
.
.
.
.
.
..
.
.
.
.
.
.
.
.
..
.
.
.
.
.
. .
.
.
.
.
.
.
.
..
.
.
.
.
.
.
.
.
.
.
.
.
.
.
.
....
.
.
.
.
.
.
.
.
.
.
.
.
.
.
.
.
.
.
.
.
.
.
.
.
.
.
..
.
.
.
..
.
.
.
.
.
.
.
.
.
.
..
.
..
.
.
. .
.
.
.
.
.
.
.
.
.
. .
..
.
.
.
.
.
.
.
.
.
.
..
.
.
.
.
.
.
..
..
.
.
..
.
.
.
.
..
.
...
.
.
.
.
.
.
.
.
.
.
.
.
.
.
.
.
[image:3.595.59.282.69.228.2]NOT OPTIMISED GA 200-100
Figure 1:(a)The interference rejection expressed in terms of SIR versus SNR = INR using 7-, 8- and 10-bit encoding for each gene. The GA configuration was as follows. Selection: roulette based; crossover type: uniform; crossover probability: 0.9; mutation probability: 0.05; no scaling, elitism. The number of genera-tions and population size was varied for the two-element an-tenna array studied, using a reference sequence length of 16 bits and an element spacing ofλ/2assuming SNR = INR. The source was at 0 degrees and the interferer at 27 degrees. The results were averaged over 10000 GA runs, when communicat-ing over a Gaussian channel.
(b)Scatter diagram of the SIR versus the fitness values of the best individuals of each run using a GA configured as in a).
10 20 30
SNR = INR (dB) 10 20 30 40 50 SIR (dB)
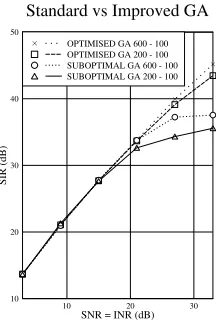
Standard vs Improved GA
SUBOPTIMAL GA 200 - 100 SUBOPTIMAL GA 600 - 100 OPTIMISED GA 200 - 100 OPTIMISED GA 600 - 100
Figure 2:The interference rejection achieved expressed in terms of the SIR versus SNR = INR using 10-bit encoding for each gene in the improved optimised GA configuration. (Selection: stochas-tic remainder; crossover type: single point; crossover probabil-ity: 0.9; mutation probabilprobabil-ity: 0.1; power scaling withσ=1.5 ; elitism). The number of generations and the population size was varied for a two-element antenna array, using a reference sequence length of 16 bits and an element spacing ofλ/2at SNR = INR. The source was at 0 degrees and the interferer at 27 degrees. The results were averaged over 10000 GA runs, when communicating over a Gaussian channel.
the above-mentioned improved GA configuration. It is interesting to note that despite its approximately 8dB higher SIR performance, the improved GA-based beamformer has the same complexity ex-pressed in terms of the product of the number of generations and the population size, as standard suboptimum scheme.
3. ADAPTIVE GA 3.1. Developments in Genetic Algorithms
In this section we set out to further reduce the complexity of the algorithm expressed as the product of the population size and the number of generations, while mantaining the same performance as in Fig. 2. As this stage we invoked a number of further GA operations, which are listed below:
• Weighted mutationwas proposed for binary enviroments, where the assignment of different mutation probabilities de-pends on the significance of each bit of the binary-coded array weight. The less significant bits of each gene are as-signed a higher mutation probability. This confines the ef-fects of the mutation, focusing the search to the space sur-rounding the mutated individual. The aim of this technique is to prevent the search from diverging from the area that is likely to contain the optimum solution, which is typically activated only, when the GA succeded in identifying the broad area, where the optimal solution lies.
• Post selectionretains those specific individuals for the next generation that are likely to achieve the best performance in the forthcoming generations. We note here that this prin-ciple is different from elitism, as it will highlighted below. The employment of this idea is based on two thresholds. If the fitness of the best individual of a generation is above a certain threshold, another threshold will be set to the value of|Faverage−Fbest|/n, whereFaverageandFbest
repre-sent the average fitness of the population and the fitness of
the best individual, respectively, whilenis a parameter to
be chosen depending on the specific problem considered. Each individual having a fitness below this second thresh-old is discarded and replaced in the following generation by a chromosome similar to the best one encountered so far. This is accomplished by applying a weighted mutation to the individual having the best fitness value so far through-out the search.
This technique ”virtually” extends the population in the sense that it allows the GA to search in a wider space without in-creasing the complexity. The employment of post selection may potentially reduce the grade of population diversity, which has to be prevented by either mutation or scaling.
• Double searchcorresponds to an on-line re-initialization. The search invokes two GAs, where the second one uses a population generated by the results of the first one. Firstly, this technique aims for exploring the entire solution space, in order to locate the area for the optimal solution and sec-ondly, for examining this ’promising’ area in detail in order to find the best solution.
[image:3.595.109.217.413.574.2]10 20 30 SNR = INR (dB) 10
20 30 40 50
SIR
(dB)
Improved vs Adaptive GA
IMPROVED GA 150 - 50 (7.5E3) IMPROVED GA 200 - 100(20E3) USING DOUBLE SEARCH 75 - 50 (7.5E3)
0.0 0.2 0.4 0.6
Maximum of the objective function 20
40 60
SIR
(dB)
Objective function study
.
.
.
..
.
..
...
.
.
. ..
. .
.
.
.
.
.. .
..
.
. .
.
.
.
.
.
.
.
.
.
.
.
. .
..
.
.
.
.
.
.
.
.
.
.
.
.
.
...
.
.
.
.
.
.
.
.
.
.
.
. ..
.
.
.
... .
.
.
.
.
.
.
.
.
.
.
.
.
.
. .
.
.
. .
.
.
.
.
. .
. .
.
.
.
.
.
.
.
.
.
.
..
.
.
.
.
.
.
.
.
.
.
.
.
. .
.
.
.
.
.
.
..
. ..
..
.
..
.
.
.
.
..
. .
.. . .
.
.
. .
..
.
.
.
.
.
.
..
.
..
.
.
.
.
..
.
.
..
.
..
.
.
.
.
.
.
. .
.
.
.
.
.
.
.
..
..
.
.
.
.
.
.
.
.
.
. .
.
.. .
.
...
.
.
.
.
.
.
.
.
.
.
.
.
.
. .
.
. .
.
.
..
.
.
.
.
.
.. .
.
.
.
.
. ..
. .
.
.
.
.
.
.
.
.
.
.
..
.
.
.
.
...
..
.
. .
.
..
.
.
.
.
.
.
.
.
..
.
.
.
. .
. .
.
.
.
. .
..
.
.
.
.
.
.
.
.
.
.
.
.
.
.
..
. .
..
.
..
.
.
.
.
...
.
.
..
.
.
.
.
.
..
.
.
.
.
. .
.
.
.
.
.
.
.
.
.
.
.
.
.
.
.
.
. .
.
.
.
.
.
.
...
.
.
.
.
.
.
..
.
.
.
.
.
.
.
.
.
.
..
.
.
.
.
.
.
.
.
.
.
.
.
.
.
. .
.
.
..
.
.
.
.
.
...
.
.
.
.
.
. ..
.
.
.
.
.
..
.
.
.
.
.
.
.
.
.
.
.
.
.
.
.
.
..
.
.
.
.
.
.
.
.
.
.
.
.
.
.
.
.
.
. .
.
...
.
.
.
.
.
.
.
.
. .
.
.
.
. .
..
. .
. .
.
.
.
.
.
..
.
.
.
.
.
.
. .
.
.
.
..
.
.
.
.
.. .
.
.
.
.
.. .
.
.
. .
..
..
.
.
.
.
.
.
.
..
. .
.
.
.
.
.
.
.
.
..
.
. .
.
.
.
.
.
..
.
.
.
.
.
.
.
.
.
.
.
.
.
.
.
.
.
..
.
.
.
.
.
.
.
.
.
.
.
.
.
.
.
..
.
.
.
.
.
.
.
.
.
.
.
.
.
.
.
.
. ..
.
.
.
.
..
.
...
.
.
.
.
..
.
..
.
.
.
.
..
.
.
.
.
.
.
.
.
.
.
.
. .
.
.
.
.
.
. .
. .
.
.
.
.
.
.
.
..
.
.
.
.
.
.
.
.
.
.
.
. .
.
.
.
.
.
.
.
.
.
.
..
.
.
. .
.
.
.
.
.
.
.
.
.
.
.
.
.
.
.
.
.
.
..
.
.
.
.
.
.
.
.
.
.
. .
..
.
.
.
.
.
..
.
.
.
.
.
.
..
.
.
.
.
.
.
.
.
.
.
..
.
.
.
.
.
.
.
. .
.
.
.
.
.
.
.
.
.
.
.
.
.
.
.
.
.
. . .
..
. ..
..
.
.
.
.
.
.
. .
.
. .
.
..
.
.
.
.
.
.
.
.
.
.
.
.
.
.
.
.
..
..
.
..
.
.
.
.
.
.
.
. .
.
.
. .
.
.
.
..
.
.
.
. .
. ..
.
.
.
.
.
.
.
.
..
.
. .
.
.
.
.
.
.
.
.
.
.
.
.
. .
.
.
.
.
.
.
.
. .
. ..
.
.
.
.
.
.
.
. .
.
.
.
.
.
.
.
.
.
. .
.
.
.
..
.
.
.
.
.
.
.
.
.
.
.
.
.
. ..
.
.
.
.
.
.
.
.
.
.
.
.
.
..
.
.
.
.
.
[image:4.595.60.281.64.224.2].
.
.
.
ADAPTIVE GA 75 - 50Figure 3:(a)The interference rejection achieved versus SNR = INR us-ing 10-bit encodus-ing of each gene in an improved GA configu-ration. (Selection: stochastic remainder, post selection with a threshold set at 0.22 andn=10; crossover type: single point; crossover probability: 0.9; mutation type: binary up to the fit-ness threshold of 0.22, then weighted mutation; mutation prob-ability: 0.1; power scaling withσ=1; elitism). The number of generations and population size was varied for a two-element antenna array, using a reference sequence length of 16 bits and an element spacing ofλ/2at SNR = INR. The source was at 0 degrees and the interferer was at 27 degrees. The result were averaged for 10000 GA runs when comunicating over a Gaus-sian channel.
(b)Scatter diagram of the SIR versus the maximum fitness val-ues of the individuals for each GA run using a GA configured as in a) .
3.2. Adaptive GA Performance
The challenge in applying the features introduced in Section 3.1 is to appropriately set the point, where the GA has to change its search strategy. The results of our related investigations are shown in Fig. 3 (a) where it is clearly seen that for a normalised
complex-ity of 7.5·103expressed in terms of the product of the population
size and the number of generations, the adaptive GA of Section 3.1 has a better SIR performance, than the improved GA of Fig. 2. For example, when considering Fig. 3 (a) at an SNR of 33 dB and at
a normalised complexity product of (150 x 50)=7.5·103, the new
features of Section 3.1 enhanced the SIR performance by about 10 dBs. In other words, the double-search based adaptive GA achieves the same performance as the improved of GA of Fig. 2, although the latter exhibits a normalised complexity of 200 x 100
= 2·104in comparison to 75x2x50 = 7.5·103.
The efficiency of the double-search based adaptive GA in opti-mising the objective function is further characterised in Fig. 3 (b). From the comparison of Fig. 1 (b) and Fig. 3 (b) it becomes evident that the phenomenon of premature convergence has been elimi-nated, since most fitness values are above 0.3. Unfortunately, how-ever, the SIR spread does not seize to constitute a serious draw-back, which limits the achievable performance, indicating that some-times a high objective function value leads to low SIR values. These findings indicate that a better objective function is required for further improving the achievable performance. Hence in the
5 10 15 20 25 30
SNR = INR (dB) 15
20 25 30 35 40 45 50 55
SIR
(dB)
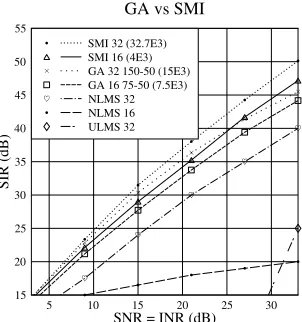
GA vs SMI
.
.
.
.
.
.
.
.
.
.
ULMS 32
.
NLMS 16NLMS 32 GA 16 75-50 (7.5E3) GA 32 150-50 (15E3) SMI 16 (4E3)
.
SMI 32 (32.7E3)Figure 4:Comparison between the SIR performances of conventional benchmarker algorithms and that of a GA configuration. (Se-lection: stochastic remainder; crossover type: single point; crossover probability: 0.9; mutation probability: 0.1; power scaling withσ=1 ; elitism). The number of generations and the population size was varied for a two-element antenna ar-ray, using a reference sequence length of 16 and 32 bits and an element spacing ofλ/2at SNR = INR. The source was at 0 degrees and the interferer was at 27 degrees. The results were averaged for 10000 GA runs, when comunicating over a Gaus-sian channel.
next section a more attractive optimisation criterion will be intro-duced.
3.3. GA-Aided versus Conventional Beamformers
Let us now benchmark the proposed GA-assisted beamformer against conventional techniques. The benchmarkers employed are the Sam-ple Matrix Inversion (SMI), the Normalised Mean Squares Algo-rithm (NLMS) and the Unconstrained Least Mean Squares (ULMS) techniques [2].
In terms of their computational complexity, these algorithms exhibit rather dissimilar behaviours. The complexity of the SMI algorithm has a cubic relationship as a function of the number of
antenna elementsL, while the NLMS, the ULMS and GA-assisted
beamformers exhibit a linear relationship as a function of the num-ber of array elements, i.e. the numnum-ber of array weights. Hence for a high number of array weights the SMI-aided beamformer ex-hibits a significantly higher complexity than that incurred by the others. In this context it is worth mentioning that while both the SMI and GA-assisted beamformers require the computation of the autocorrelation matrix of the received signal, only the SMI-aided beamformer has to invert the matrix. This results in an excessive complexity in case of a large autocorrelation matrix. On the other hand, the performance of the GA-aided beamformer appears to be closer to that of the SMI expressed in terms of the SIR, rather than to that of the NLMS and ULMS algorithms, as it is seen in Fig. 4.
4. SIR OPTIMISATION IN ADAPTIVE BEAMFORMING
[image:4.595.345.496.65.226.2]se-10-1
2 5 100
2 5 101
Maximum of the objective function 0 15 30 45 60 75 SIR (dB)
Objective function study
.
.
.
.
.
.
.
.
..
.
..
.
.
.
.
.
.
.
.
.
.
.
.
.
..
..
.
.
.
.
.
.
.
.
.
.
.
.
.
..
.
...
.
.
.
..
.
..
.
.
..
.
.
..
.
.
.
..
.
.
.
.
...
.
.
.
.
.
.
.
.
.
.
.
.
.
.
.
.
..
.
.
..
.
.
....
.
..
.
.
.
.
....
...
..
.
.
..
.
.
....
.
.
..
.
.
.
.
.
..
.
.
.
.
..
...
..
..
.
..
.
.
.
.
.
.
.
.
...
.
..
.
.
.
.
..
.
.
.
.
..
.
.
.
.
.
.
.
.
.
.
....
.
.
.
.
..
.
.
...
.
.
.
.
.
.
.
.
.
.
..
.
.
.
.
.
.
..
.
.
.
.
.
.
.
...
.
.
.
.
.
..
...
...
.
.
.
.
.
.
.
.
.
.
.
..
.
.
.
.
..
.
.
.
.
..
.
.
.
.
.
.
.
.
.
.
.
.
.
.
.
.
.
.
.
....
.
.
..
.
..
.
.
.
.
.
.
..
.
..
.
.
.
.
.
.
.
..
.
.
.
..
.
..
.
.
.
.
.
.
.
.
...
.
..
.
.
.
.
.
.
.
.
.
.
.
...
.
.
.
...
.
.
.
.
.
...
.
.
.
.
.
.
.
.
.
.
.
.
.
...
.
.
.
..
.
..
.
.
.
.
.
.
.
.
.
.
.
.
.
.
.
.
.
.
.
.
.
.
..
.
..
.
.
..
....
.
.
..
..
.
.
.
.
.
.
.
.
.
.
.
..
.
.
..
.
.
.
.
.
...
.
.
...
.
.
....
.
..
.
.
..
.
.
.
.
.
.
.
.
..
.
.
.
.
.
.
.
.
.
..
..
.
.
.
.
.
.
.
..
.
..
.
.
.
.
.
.
..
.
.
.
.
.
.
.
.
..
.
.
.
.
.
.
.
.
.
.
.
..
...
.
..
..
.
.
.
.
.
.
.
.
..
.
.
.
.
.
.
.
.
....
.
..
.
.
.
.
.
.
.
.
.
.
...
.
.
.
.
.
...
.
.
.
..
.
.
.
.
.
..
.
.
.
.
.
...
.
.
.
.
..
.
.
.
..
.
.
.
..
.
.
.
.
.
.
.
..
.
.
.
.
.
.
.
.
.
.
.
.
.
.
.
.
...
..
.
.
.
.
.
.
.
.
.
.
..
.
.
..
.
.
.
.
.
.
.
.
.
.
.
.
.
.
.
.
...
.
.
.
.
..
.
.
.
.
.
.
.
.
.
.
.
.
.
.
.
.
.
.
.
.
.
.
.
.
.
.
..
.
.
.
.
.
...
.
.
.
.
.
.
..
.
.
.
...
.
.
.
.
.
..
....
.
.
.
.
..
.
.
.
..
..
.
..
.
.
.
.
..
.
.
.
...
.
.
.
.
.
.
.
.
.
.
..
.
.
.
..
.
.
.
..
.
.
..
.
.
.
.
..
.
.
.
..
.
.
.
.
...
.
.
.
...
..
.
.
.
..
.
.
.
.
.
.
.
.
..
.
.
..
.
..
.
.
..
.
..
.
.
.
.
.
.
.
.
.
.
.
.
.
.
.
.
.
.
.
.
.
.
.
.
.
.
.
.
..
.
.
...
.
.
.
..
.
..
..
.
. ..
.
.
...
...
.
..
.
.
..
.
.
.
..
.
.
. .
.
..
.
.
...
...
.
.
.
.
. .
.
.
.
.
.
.
.
.
.
.
.
.
.
.
.
.
....
.
.
NOT FULLY OPTIMISED GA 200-100 (20E3)0 10 20 30 40 50
Generations 15 30 45 60 SIR (dB)
Direct SIR optimisation
[image:5.595.59.282.63.226.2]POPULATION SIZE 20 POPULATION SIZE 40 POPULATION SIZE 60
Figure 5:(a)Scatter diagram of the SIR versus the maximum fitness val-ues of the individuals for each GA run, using a GA configu-rated as in b).
(b)The interference rejection achieved versus SNR = INR us-ing 10-bit encodus-ing for each gene in a rudimentary subopti-mum GA - configuration. Selection: stochastic remainder; crossover type: single point; crossover probability: 0.9; mu-tation probability: 0.1; power scaling withσ=1 ; elitism; the angle of arrival was assumed to be estimated with a precision of 0.01. The number of generations and population size was varied for a two element antenna array, using a reference se-quence length of 16 bits and an element spacing ofλ/2at SNR = INR. The source was at 0 degrees and the interferer was at 27 degrees. The result were averaged for 10000 GA runs when comunicating over a Gaussian channel.
quence was minimised. By contrast, our aim in this section is that of directly maximising the SIR. Hence we set the gradient of the SIR expression with respect to the array weights to zero and directly maximised the SIR by determining the weights with the aid of a GA. Our initial investigations suggested that in con-junction with this optimisation criterion interesting results emerge even when using unsophisticated GAs. Specifically, the SIR vari-ance versus the objective function’s maximum value seen in Fig. 5 (a) becomes narrower and this assists us in irradicating low SIR values, which were always experienced in conjunction with the MMSE criterion of Fig. 3. To elaborate a little further, a directly proportionate relationship between the fitness value and SIR is ex-tremely desirable for ensuring that once the objective function is optimised by the GA, the optimum SIR value will be achieved. Again, Fig. 5 portrays the SIR values achieved by the GA speci-fied in the figure caption, which is now consistently higher than the SIRs achieved by the benchmarkers of Fig. 4, whilst maintaining a reduced computational complexity. In this context we would like to note that this time the cost-function has been normalised in the post selection process, such that it may assume values in excess of unity.
5. CONCLUSIONS AND CURRENT RESEARCH
Various GA-assisted beamforming techniques have been proposed as an alternative to conventional beamforming algorithms. The de-sign of the corresponding GAs was highlighted and their
achiev-able performance was characterised in terms of both the SIR and the SINR. It was demonstrated that a potentially more attractive SINR versus complexity trade-off is achievable by the proposed GA-assisted beamformers. Further research is required for gener-alising these results to more complex beamformers and propaga-tion scenarios.
Our current research is aimed at directly minimising the bit error rate of beam-forming assisted systems by employing the so-called the minimum bit error rate (MBER) approach. These tech-niques require an estimate of the probability density function (PDF) of the BER, which can be based on both block-adaptive and sample-by-sample adaptive approaches. Since the associated BER ver-sus array-weight surface is significantly less well-behaved than the classic quadratic MSE error surface, the employment of the GAs investigated in this contribution is expected to be attractive in the context of directly optimising the BER. Consequently, our tenta-tive results indicate that MBER beamforming is capable of pro-viding significant performance gains in terms of a reduced BER over MMSE beamforming, while the employment of GAs has the promise of allowing us to avoid some of the associated deficiences of the BER optimisation problem.
6. REFERENCES
[1] J. Litva, T.K.Y. Lo, “Digital Beamforming in Wireless Com-munications” Artech House Publishers, 1996.
[2] J.S. Blogh, L. Hanzo: Third-Generation Systems and Intel-ligent Wireless Networking - Smart Antennas and Adaptive Modulation, John Wiley, 2002, p 408
[3] A. Tennant, M.M. Dawoud, and A.P. Anderson, “Array Pat-tern Nulling by Element Position Perturbations using GA ”
Electronics Letters, vol.30, pp.174-176, 1994.
[4] R.J. Mitchell, B. Chambers, and A.P. Anderson, “Array Pat-tern Synthesys in the Complex Plane Optimized by a GA, ”
Electronics Letters, vol.32, pp. 1843-1845, 1996.
[5] R.L. Haupt, “Phase-only adaptive nulling with a GA, ”IEEE
Transactions on Antennas and Propagation., vol. 45, pp.1009-1015, 1997.
[6] K. Yen, L. Hanzo, “Hybrid Genetic Algorithm Based Detec-tion Schemes for Synchronous CDMA Systems, ” Vehicular Technology Conference 2000, Tokyo, Japan, 15-18 May 2000.
[7] D.S. Weile, E. Michielssen, “The Control of Adaptive An-tenna Arrays With Genetic Algorithms Using Dominance and
Diploidy, ”IEEE Transactions on Antennas and Propagation,
vol. 49, no. 10, pp. 1424-1433 , October 2001.
[8] J.M. Johnson and Rahmat-Samii, “Genetic Algorithms in
En-gineering Electromagnetics, ” IEEE Antennas and
Propaga-tion Magazine, vol. 39 , pp.7-21, 1997.
[9] D. E. Goldberg, “Genetic Algorithms in Search, Optimization, and Machine Learning, ” Addison-Wesley, 1989.
[10] M. Mitchell, “An Introduction to Genetic Algorithms, ”