First-principles calculation of the structure and dielectric properties of Bi
2Ti
2O
7Charles H. Patterson
School of Physics, Trinity College Dublin, Dublin 2, Ireland
共Received 2 July 2010; published 4 October 2010兲
The structure, vibrational modes, and phonon contribution to the dielectric function of the pyrochlore Bi2Ti2O6O⬘were calculated using first-principles methods. Total-energy minimization calculations were per-formed for Bi2Ti2O6O⬘in a unit cell containing 88 ions, which had the ideal, cubic pyrochlore structure as the initial configuration. No symmetry constraints were imposed during this relaxation. Subsequent symmetry analysis of the relaxed structure found Pna21 space-group symmetry in a 44 ion unit cell. This structure contains Bi ions with two types of eightfold coordination by O and O⬘ ions. Vibrational modes and the dielectric function were calculated for theFd3¯m,Pna21, andP1structures. The crystal structure obtained by total-energy minimization is compared to structural data from reverse Monte Carlo analysis of neutron total scattering data. The imaginary part of the dielectric function derived from vibrational mode calculations is compared to dielectric function data for several related pyrochlores. Phonons which make the largest contri-butions to the dielectric constant are identified and analyzed.
DOI:10.1103/PhysRevB.82.155103 PACS number共s兲: 61.50.Ah, 63.20.dk, 63.50.Lm
I. INTRODUCTION
The structure of the insulating pyrochlore Bi2Ti2O6O
⬘
共BTi兲 has been studied by x-ray and neutron-scattering1–3
and density-functional theory 共DFT兲 methods.4–7 The ideal
pyrochlore structure belongs to the Fd¯m3 space group and consists of interpenetrating Bi2O
⬘
and Ti2O6polyhedralnet-works. Both experimental and theoretical studies of Bi2Ti2O6O
⬘
共Refs. 2, 4, and 5兲 and other bismuthpyrochlores5,8–14indicate that the Bi
2O
⬘
network is distortedcompared to the network in the ideal pyrochlore structure. Similarities between the structure of the Bi2O
⬘
network inBi2Ti2O6O
⬘
and the SiO2network incristobalite have beenhighlighted.3 The OSiO bond angle in  cristobalite is
around 145°. Displacements of the Bi ion from the O
⬘
O⬘
axis in Bi2Ti2O6O⬘
have been inferred from powder neutron-diffraction studies,2 where it was shown that markedim-provements in fits to data were obtained by allowing Bi ions to shift from the ideal pyrochlore positions by 0.43 Å. Bi displacements in Bi2Ti2O6O
⬘
were also obtained from a re-verse Monte Carlo 共RMC兲 analysis of neutron total scatter-ing data by Shoemakeret al.3The distribution of Bidisplace-ments is peaked around 0.4 Å, which corresponds to a O
⬘
BiO⬘
bond angle around 160°. The cause of the displace-ment of the O ions from the SiSi axis in  cristobalite is clearly the stereochemical arrangement of two SiO bonds and two off-center O lone pairs. The cause of the Bi dis-placement in Bi2Ti2O6O⬘
has been discussed in terms ofoff-centering of the Bi 6s lone pair4,5,7 or a soft polar phonon
mode6 but the cause of displacement is not as clear as in
SiO2. The ratio of ionic radii in Bi2Ti2O6O
⬘
, rA/rB= 1.93,2 lies outside the usual stability range for pyrochlores 共1.46– 1.78兲at atmospheric pressure15 and so some latticeinstabil-ity might be expected.
The average structure for Bi2Ti2O6O
⬘
, however, is cubic with Fd3¯m symmetry. The only indication from Bragg re-flections that some symmetry breaking exists is the observa-tion of the共442兲 reflection,2which is forbidden in the idealcubic pyrochlore structure. The relationship between the symmetry-lowered structure at short range and average cubic symmetry at long range is not addressed here. This problem has been considered in  cristobalite in terms of rigid unit modes of SiO4 tetrahedra and domain models.16
Insulating bismuth pyrochlores such as
Bi1.5Zn0.92Nb1.5O6.92 共BZN兲, Bi3/2ZnTa3/2O6O
⬘
共BZT兲 orBi3/2MgNb3/2O6O
⬘
共BMN兲 have been found to have large,dielectric constants,17,18which make them interesting
candi-dates for device applications which require high-k dielec-trics. A correlation between Bi displacement and magnitude of the dielectric constant has been postulated in these pyrochlores.12Calculation of dielectric functions and
analy-sis of modes and sources of polarization is probably the best way to understand the peculiar dielectric properties of such materials. As part of this work an attempt was made to obtain the dielectric function of Bi2Ti2O6O
⬘
using reflectancemea-surement techniques previously used for related bismuth pyrochlores.18 However, Bi
2Ti2O6O
⬘
transforms toBi2Ti4O11 and Bi4Ti3O12 at 650 ° C共Ref.2兲and several
at-tempts to synthesize a dense sintered sample for IR reflec-tivity measurements have proven unsuccessful.19
In the following sections of the paper we report DFT cal-culations of the crystal structure of Bi2Ti2O6O
⬘
in whichFd¯m3 , P1, and Pna21 space-group symmetry constraints
were applied to atomic positions. Calculations were per-formed using a conjugate gradient energy minimization tech-nique in theCRYSTALcode.20The electronic density of states
II. RESULTS AND DISCUSSION
A. Crystal structure
In this section we report results of conjugate gradient en-ergy minimization calculations on Bi2Ti2O6O
⬘
. ThePerdew-Wang23 generalized gradient approximation 共GGA兲
to DFT was used throughout, except where B3LYP共Ref.24兲 hybrid density functional calculations were performed for the
Fd3¯mstructure. Further details of the calculations are given in the Appendix.
The second origin choice for theFd3¯munit cell was used. Bi ions are located at the 共0.5, 0.5, 0.5兲 site, Ti ions at the origin, O ions at 共0.375, 0.375, 0.375兲, and the O
⬘
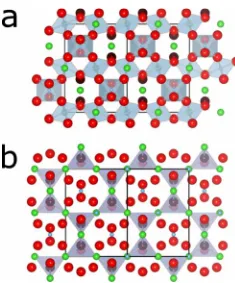
ion at共x, 0.125, 0.125兲. The energy minimized value ofxis 0.325019. The lattice parameter for the energy minimized Fd¯m3 unit cell was 10.376 Å. This value may be compared to the value from x-ray diffraction, 10.379 Å.2 In the ideal pyrochlorestructure共Fig.1and TableI兲, each Bi ion has two O
⬘
nearest neighbors at 2.25 Å and six O neighbors at 2.58 Å. The Bi ion sits at the center of a puckered ring containing the O ions and the O⬘
ions cap the Bi ions above and below the ring. Bi ions have approximately cubic coordination polyhedra con-taining six O and two O⬘
ions in the energy minimized P1andPna21structures.
The P1 structure was generated by relaxing positions of
all 88 ions in the Fd¯m3 conventional unit cell. It was ana-lyzed using the ISOTROPYprogram25 and found to have
ap-proximately Pna21 symmetry and a primitive unit cell con-taining 44 ions. A further energy minimization calculation was performed using these coordinates as the initial configu-ration in a 44 ion unit cell withPna21symmetry constraints.
TheFd¯m3 lattice parameter共10.376 Å兲was used for theP1
cell and a lattice parameter of 10.371 Å was used for the
Pna21 cell. ThePna21space group belongs to the series of
maximal isomorphic subgroups of Fd3¯m. The relationship between the 88 ion conventional cell of the Fd¯m3 structure and the 44 ion primitive cell of the Pna21structure is
illus-trated in Fig. 2, which shows both cells along the 关010兴 di-rection.
The coordination polyhedra and bond lengths of the
Fd¯m3 andPna21structures in Figs.1and3and TableIshow
the changes which result from structure relaxation. There is one type of Bi and one type of Ti in theFd3¯mstructure and there are two Bi and two Ti types in theP1andPna21 struc-tures. Obviously the absence of symmetry constraints on the 16 Bi ions in the P1 unit cell permits up to 16 distinct Bi types. However, bond length distributions for Bi ions in this structure clearly split into two classes where there are minor differences in bond length within a class, which are typically less than 0.005 Å. In the Pna21 structure, symmetry
con-straints allow two types of Bi and two types of Ti. Both types of Bi 关labeled Bi共1兲 and Bi共2兲兴 have similar mean bond lengths inP1andPna21共ranging only from 2.52 to 2.54 Å兲, although the distribution of bond lengths is somewhat differ-ent in the two types of Bi共TableI兲. The approximately cubic coordination of the two types of Bi ion is shown in Fig. 3. There are two types of Ti in theP1andPna21structures with very similar mean TiO bond lengths 共TableI兲. Unique frac-tional coordinates for the energy minimizedPna21structure are given in TableII.
As mentioned above, structure determination of Bi2Ti2O6O
⬘
by RMC analysis3 shows displacement of Biions off the O
⬘
O⬘
axis by around 0.4 Å, resulting in a O⬘
BiO⬘
bond angle of around 160°. When Bi is displaced from its ideal position at the center of the puckered ring, it can move toward one of the O ions in the ring or between a pair of ions in the ring. The former site is the 96g Wyckoff position of the Fd¯m3 space group and the latter is the 96hposition. Shoemaker et al.3 find a preference for occupation
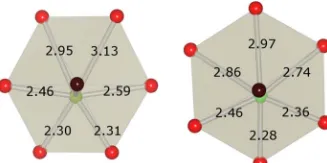
of the 96h site but the ratio of frequencies of occupation of either site is just 5:4. They find an approximately sinusoidal distribution of frequencies for the Bi displacement angle,, with six maxima in the range 0⬍ⱕ360°, corresponding to the 96h site and minima corresponding to the 96g site. BiO6O2
⬘
polyhedra for Bi共1兲 and Bi共2兲 ions in the relaxedPna21structure are shown in Fig.4. Bi共1兲ions are displaced away from the O
⬘
O⬘
axis toward two O ions resulting in BiO bond distances of 2.30 and 2.31 Å while Bi共2兲ions are dis-placed toward one O ion and the BiO bond distance is 2.28 Å. Bi共1兲 therefore occupies a site similar to the 96hposition and Bi共2兲occupies a site similar to the 96gposition in the ideal pyrochlore structure. The magnitude of the dis-placement of Bi共1兲from the O
⬘
O⬘
axis is 0.41 Å compared to 0.20 Å for the displacement of Bi共2兲from the O⬘
O⬘
axis. The model obtained from RMC analysis3 found the Biplacement to be distributed around 0.4 Å; however, the dis-tribution is skewed and has extra weight below 0.4 Å which may be due to a second type of Bi ion with a smaller dis-placement. There is a preference for the 96hsite in the RMC model by 5:4 whereas there are equal numbers of Bi ions in 96h and 96gsites in the relaxedP1andPna21structures.
Changes in the Bi2O
⬘
network between the Fd¯m3struc-ture and the P1 or Pna21 structures can best be understood
by looking at O
⬘
Bi4tetrahedra. In both P1 andPna21 [image:2.609.112.230.65.207.2]struc-tures, there is a single type of O
⬘
Bi4 tetrahedron containing two Bi共1兲and two Bi共2兲ions. BiBi distances in these tetra-hedra are given in Table I. The BiBi distance in theFd¯m3 structure is 3.67 Å and the dispersion of BiBi distances in FIG. 1. 共Color online兲Ti and O⬘polyhedra in the idealFd3¯mtheP1andPna21structures is 3.59– 3.85 Å. The view of the O
⬘
Bi4tetrahedra in Fig.3共d兲along the关100兴direction showsstrong buckling of Bi rows along关001兴similar to that found in RMC data.3 The view of the Fd¯m3 and Pna2
1 O
⬘
Bi4tetrahedra along the 关010兴 axis in Fig. 5 shows how the O
⬘
Bi4 tetrahedra pack in alternating rows in共010兲planes inthe Pna21structure.
B. Electronic structure
The electronic structure of Bi2Ti2O6O
⬘
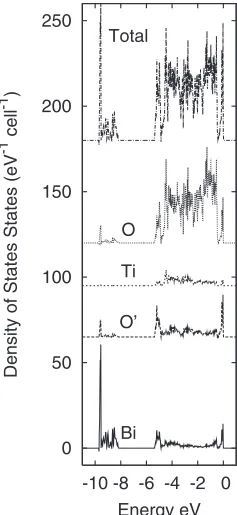
from DFT calcu-lations has been reported previously4,5,7 and so only a briefdescription of the electronic structure is given here. In com-mon with previous work on Bi2Ti2O6O
⬘
,4,5 we find a group [image:3.609.107.496.93.600.2]of bands at the bottom of the valence band which has mainly Bi 6s character. The valence band for the Pna21 structure consists of a group of bands extending from the valence band maximum down to −5.4 eV and a group of 8 bands extend-ing from −8.2 to −9.7 eV. The density of states for these bands 共Fig. 6兲 shows that the partial density of states from the former group of bands contains contributions from all types of atoms in the unit cell while the latter 8 bands consist mainly of Bi states.
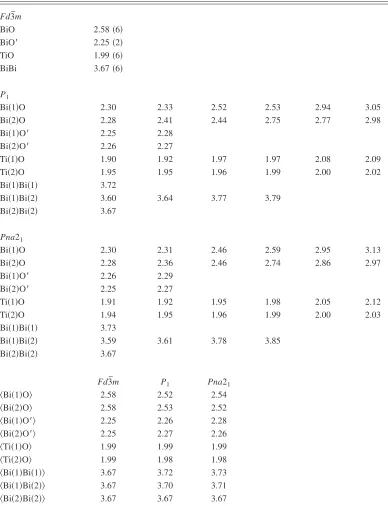
TABLE I. BiO, BiO⬘, and TiO bond lengths, BiBi distances and mean bond lengths in angstrom from DFT energy minimization.
Fd¯m3
BiO 2.58共6兲
BiO⬘ 2.25共2兲
TiO 1.99共6兲
BiBi 3.67共6兲
P1
Bi共1兲O 2.30 2.33 2.52 2.53 2.94 3.05
Bi共2兲O 2.28 2.41 2.44 2.75 2.77 2.98
Bi共1兲O⬘ 2.25 2.28
Bi共2兲O⬘ 2.26 2.27
Ti共1兲O 1.90 1.92 1.97 1.97 2.08 2.09
Ti共2兲O 1.95 1.95 1.96 1.99 2.00 2.02
Bi共1兲Bi共1兲 3.72
Bi共1兲Bi共2兲 3.60 3.64 3.77 3.79
Bi共2兲Bi共2兲 3.67
Pna21
Bi共1兲O 2.30 2.31 2.46 2.59 2.95 3.13
Bi共2兲O 2.28 2.36 2.46 2.74 2.86 2.97
Bi共1兲O⬘ 2.26 2.29
Bi共2兲O⬘ 2.25 2.27
Ti共1兲O 1.91 1.92 1.95 1.98 2.05 2.12
Ti共2兲O 1.94 1.95 1.96 1.99 2.00 2.03
Bi共1兲Bi共1兲 3.73
Bi共1兲Bi共2兲 3.59 3.61 3.78 3.85
Bi共2兲Bi共2兲 3.67
Fd3¯m P1 Pna21
具Bi共1兲O典 2.58 2.52 2.54
具Bi共2兲O典 2.58 2.53 2.52
具Bi共1兲O⬘典 2.25 2.26 2.28
具Bi共2兲O⬘典 2.25 2.27 2.26
具Ti共1兲O典 1.99 1.99 1.99
具Ti共2兲O典 1.99 1.98 1.98
具Bi共1兲Bi共1兲典 3.67 3.72 3.73
具Bi共1兲Bi共2兲典 3.67 3.70 3.71
Since accommodation of an off-center Bi lone pair has been postulated as the cause of symmetry breaking in the ideal pyrochlore structure in Bi2Ti2O6O
⬘
,4,5,7 the electrondensity corresponding to these bands was calculated to de-termine whether or not the lone pair was atom centered. The charge density for the states in the bands which range in energy from −8.2 to −9.7 eV is shown in Fig. 7. Previous analyses4,5,7of the lone pair in Bi
2Ti2O6O
⬘
used the electronlocalization function for the lone pair density rather than the density itself. There is no significant off-centering of the lone
pair density, leading us to conclude that this is not the pri-mary driving force in Bi displacement from the O
⬘
O⬘
axis. The band structure for the bands which are mainly composed of Bi 6s orbitals consist of four dispersive and four nondis-persive bands, for which the density of states shows a sharp peak plus a broad distribution between −9.7 and −8.2 eV. Dispersion of the bands in the broad distribution is only pos-sible if there is significant covalent interaction between Bi and O⬘
ions. It is possible that interaction between Bi and O⬘
ions drives the distortion, if increased interaction between these ions via Bi ion displacement is energetically favorable.C. Vibrational spectrum
Vibrational modes at the ⌫ point of the Brillouin zone were calculated using the frozen phonon method available in CRYSTAL.20,21The phonon contribution to the dielectric
func-tion was calculated using Born charges derived from changes induced in Wannier orbitals by atomic displacements along phonon normal coordinates.20,22 The methods used are
briefly outlined below. It is well known that the polarization in systems with periodic boundary conditions is ill defined. However, changes in polarization due to atomic displace-ments can be calculated using localized Wannier orbitals. The change in the net dipole moment of Wannier orbitals associated with the zeroth unit cell,i, which is created by an atomic displacement,u␣j, at the␣thnucleus, defines the
[image:4.609.110.233.64.209.2]atomic Born charge tensors, Z␣,ⴱij,
TABLE II. Fractional coordinates for unique ions in thePna21 structure for Bi2Ti2O6O⬘determined from DFT energy minimiza-tion. Lattice constants are 7.33340 and 10.37100 Å.
Bi共1兲 0.46821 0.02436 0.01883
Bi共2兲 0.22034 0.23870 0.71964
Ti共1兲 0.49128 0.49330 0.99697
Ti共2兲 0.25941 0.76040 0.75377
O共1兲 0.30771 0.62654 0.55680
O共2兲 0.79348 0.11688 0.06149
O共3兲 0.71201 0.62190 0.95715
O共4兲 0.17647 0.13538 0.44955
O共5兲 0.51184 0.81992 0.74272
O共6兲 0.99726 0.92673 0.25312
O⬘ 0.52092 0.87681 0.24008
c
a
[image:4.609.312.560.104.259.2]a
c
FIG. 2. Outline and registry of the 88 ionFd¯m3 conventional unit cell and 44 ion Pna21primitive unit cell.
FIG. 3. 共Color online兲 Bi, Ti, and O⬘ polyhedra in thePna21 structure. Large spheres O 共red兲 and O⬘ 共brown兲 ions, medium spheres Bi共1兲 共dark green兲 and Bi共2兲 共light green兲ions, small blue spheres Ti ions.共a兲 Bi共1兲polyhedra viewed along the关001兴 direc-tion. 共b兲 Bi共2兲 polyhedra viewed along the 关100兴 direction, 共c兲 Ti octahedra viewed along the 关100兴 direction, 共d兲 O⬘ tetrahedra viewed along the关100兴direction. Ti共1兲 octahedra in共c兲are in the center of the BiO⬘ diamond network. Ti共2兲 octahedra form rows between the Ti共1兲octahedra.
[image:4.609.111.232.378.636.2] [image:4.609.354.518.610.692.2]Z␣,ⴱij=
i
u␣j
. 共1兲
The transformation from atomic, Cartesian coordinates, u␣,i to phonon normal coordinates,Qp is,
Qp=
兺
␣,i
tp,␣i
冑
M␣u␣i, 共2兲where p labels the vibrational mode, tp,␣i contains compo-nents of the pth phonon eigenvector andM␣ is the mass of the ␣th atom. Born charge tensors in the normal 共Z兲 and atomic, Cartesian共Zⴱ兲coordinate systems are related by,
Zp,i=
兺
␣,j
tp,␣jZ␣,ⴱij
冑
M␣ . 共3兲The phonon contribution to the long wavelength dielectric function is given in terms of Born charge tensors in the nor-mal coordinate basis and phonon frequencies,
⑀ij共兲=4 ⍀
兺
pZp,iZp,j p2−2−i␥p
. 共4兲
⍀ is the unit-cell volume and p and ␥p are the frequency and phenomenological damping parameter of the pth mode. The polarization sources which contribute to the dielectric function when a vibrational mode is excited are visualized below by plotting a vector,zp,i␣, on each atom in the unit cell whose magnitude and direction are proportional to
zp,i␣=
兺
jtp,␣jZ␣,ⴱij
冑
M␣ . 共5兲This vector corresponds to the cell dipole moment associated with the pth vibrational mode, split into its atomic compo-nents.
Mode frequencies and the imaginary part of the dielectric function were calculated for theFd¯m3 ,P1, andPna21
struc-tures described in Sec.II Ausing a DFT-GGA hamiltonian.23
Mode frequencies and the imaginary part of the dielectric function were also calculated for Bi2Ti2O6O
⬘
in the idealpyrochlore structure using a B3LYP hamiltonian.24 Mode
frequencies for Bi2Ti2O6O
⬘
in the ideal pyrochlore structurefrom a DFT-GGA calculation have been reported previously.6 In the absence of dielectric function measure-ments for Bi2Ti2O6O
⬘
, we compare the imaginary part of thedielectric function, ⑀2, from Eq. 共4兲, for BTi to spectra for
BMN, BZT, and BZN. The latter spectra were generated us-ing a fit to reflectance spectra.18The oscillator model used in
that work was,
⑀共兲=
兺
p⌬⑀pp
2
p
2
−2−i␥p
+⑀⬁, 共6兲
[image:5.609.315.556.68.187.2]wherep,␥p, and⌬⑀pdenote the mode frequency, damping coefficient, and oscillator strength for the pth phonon mode, respectively. Fitted damping coefficients lie in the range FIG. 5. 共Color online兲BiBi distances in angstrom in O⬘Bi4
tet-rahedra in the ideal pyrochlore Fd¯m3 and P1 structures viewed along the关010兴direction.共Left panel兲BiBi distances in O⬘Bi4 tet-rahedra in the ideal cubic pyrochlore structure are all the same.
共Right panel兲Bi共1兲ions共dark green兲, Bi共2兲ions共light green兲.
0 50 100 150 200 250
-10 -8 -6 -4 -2 0
Density
of
States
States
(eV
-1
cell
-1 )
[image:5.609.70.278.69.166.2]Energy eV Bi O’ Ti O Total
FIG. 6. Atom-projected valence band densities of states for Bi2Ti2O6O⬘in thePna21structure.
[image:5.609.114.233.457.715.2]30– 100 cm−1, leading to fairly broad peaks in⑀
2 spectra.18
Damping coefficients of 40 cm−1, were used for dielectric functions obtained from CRYSTALcalculations.
Factor group analysis of the normal modes at the⌫ point of theFd¯m3 pyrochlore structure yields
⌫= 8F1u共IR兲+ 4F2u+ 2F1g+ 4F2g共R兲+ 3Eu+Eg共R兲+ 3A2u
+Ag共R兲, 共7兲
including three translational modes which belong to theF1u representation. Only theF1u modes are IR active whileF2g,
Eg, andAgmodes are Raman active. Frequencies from
DFT-GGA and B3LYP calculations on the ideal pyrochlore struc-ture are given in TablesIIIandIV.
We find modes with negative eigenvalues belonging to
F1u, F2u, and Eu representations for our GGA and hybrid DFT calculations. Since these eigenvalues equal the square of vibrational frequencies, a negative eigenvalue corresponds to an imaginary frequency and an unstable lattice. The earlier calculation of these vibrational frequencies6also reported
un-stable F1u and Eu modes; no F2u modes frequencies were reported. F1u mode frequencies from the three calculations
on Bi2Ti2O6O
⬘
in theFd¯m3 structure are compared in Table III. The imaginary part of the dielectric function calculated using Eq. 共4兲, where parameters were obtained from CRYSTAL calculations, is shown in Fig. 8. The modes at 62 and 317 cm−1 dominate the spectrum; modes at otherfre-quencies are barely visible in the spectrum.
The Pna21 group belongs to the set of groups with C2v
point symmetry. Factor group analysis of the normal modes at the⌫ point of the Pna21 structure yields
⌫= 33A1共IR,R兲+ 33A2共R兲+ 33B1共IR,R兲+ 33B2共IR,R兲. 共8兲
A1,B1, andB2modes have net dielectric polarizations
paral-lel to thec,b, andaaxes of the unit cell, respectively. There is a marked difference in the distribution of IR mode inten-sities on going from the idealFd¯m3 structure to the relaxed
Pna21or P1 structures共Fig.8兲. Since there are many more
ions in the latter primitive unit cells 共22 for Fd¯m3 , 44 for
Pna21, and 88 for P1兲 and the symmetry for the latter two structures is much reduced, we comment only on the modes which have significant intensity in the Pna21 structure ⑀2
spectrum. Strong interaction with IR radiation by the F1u mode at 62 cm−1in theFd¯m3 structure is replaced by
inter-action viaA1modes at 54, 91, 122, and 131 cm−1,B 1modes
at 40, 95, and 113 cm−1and aB2mode at 116 cm−1 共Table
[image:6.609.355.515.63.303.2]V兲. The IR active mode at 317 cm−1in theFd¯m3 structure is
TABLE III. IR active 共F1u兲 mode frequencies in cm−1 for Bi2Ti2O6O⬘in theFd¯m3 ideal pyrochlore structure.
GGAa GGAb Hybrid DFTc
98i 142i 71i
81 62
112 86 107
229 213 222
262 317 283
352 327 344
378
464 435 502
aFennieet al.Ref.6. bThis work, GGA calculation. cThis work, hybrid DFT calculation.
TABLE IV. Fd3¯m Raman active共R兲 and silent 共S兲 mode fre-quencies. Modes from GGA calculations in this work are given in the upper part of the table and corresponding mode frequencies from Fennieet al.共Ref.6兲are given in the lower part.
F2g共R兲 Eg共R兲 Ag共R兲 Eu共S兲
262 281 537 135i
395 100
535 394
711
278 369 462 100i
414 107
462 400
535
0 100 200 300 400 500 600 700 ε2
Frequency (cm-1)
[image:6.609.49.296.96.228.2]BMN BZT BZN BTi Fd3m BTi Pna21 BTi P1
FIG. 8. Imaginary part of the dielectric function for BMN, BZT, BZN, and Bi2Ti2O6O⬘. Spectra for BMN, BZT, and BZN were constructed from fitting parameters to experimental data in Ref.18
[image:6.609.49.295.606.745.2]replaced byA1modes at 286, 336, and 356 cm−1, aB 1mode
at 281 cm−1andB2 modes at 267, 285, and 334 cm−1. The
highest mode frequencies in the Pna21 structure lie around
750 cm−1 共741, 747, 755 cm−1兲 and may be observed in
Raman spectroscopy.
There is one unstable A1 mode in the Pna21 structure whereas there are eight unstable modes 共including degen-eracy factors兲in theFd¯m3 structure. The Fd¯m3 structure is definitely unstable whereas the Pna21 unstable mode may
result from the inability of the energy minimization algo-rithm to find the absolute energy minimum in a complex structure such as this. Small rotations of polyhedra may have very flat potential energy surfaces close to the equilibrium structure, leading to convergence close to but not at, equilib-rium.
The ⑀2 spectrum shown in Fig.8 is calculated using Eq. 共4兲 and includes contributions from all IR active modes. Thus we do not assume any specific polarization for the in-cident electric field in generating the spectra for the P1 and
Pna21structures of Bi2Ti2O6O
⬘
. TableVgives the predicted maximum intensity of each mode in the ⑀2 spectrumcalcu-lated using Eq.共4兲. The Lorentz oscillator form assumed for the frequency dependence of the dielectric function in Eq. 共4兲predicts a maximum value of 4Zp2/⍀␥ppatp. Rela-tive values of Zp
2/
p are compared in Table V, where it is shown that the most intense peak in the ⑀2spectrum is a B1
mode at 116 cm−1. Equation 共4兲 also predicts a dielectric
constant value of 4Zp
2/⍀
p
2
. Contributions of modes which
make significant contributions to the dielectric constant are also given in TableV. The phonon contribution to the diag-onal elements of the dielectric tensor, when all modes are taken into account, is⑀aa= 101.7,⑀bb= 198.3, and⑀cc= 102.9. There is considerable anisotropy in the dielectric constant whereas the macroscopic Fd¯m3 symmetry found for Bi2Ti2O6O
⬘
implies an isotropic dielectric constant tensor.Anisotropy in the dielectric constant tensor is, of course, al-lowed in the Pna21 space group, which hasC2v point
metry. The relationship between the long-range cubic sym-metry in Bi2Ti2O6O
⬘
and breaking of this symmetry at short range, through Bi displacements and possibly other sources, was mentioned above. Restoration of a macroscopic cubic symmetry is expected to lead to restoration of cubic symme-try in the dielectric constant tensor also.Table V shows that modes with vibrational frequencies below 120 cm−1 contribute the majority of the dielectric constant in each case. A1 modes at 54 and 91 cm−1 make
contributions of 23.4 and 33.7 to⑀cc, theB1modes at 40, 95,
and 113 cm−1 make contributions of 96.7, 18.0, and 62.9 to
⑀bb and the B2 mode at 116 cm−1 contributes 69.4 to ⑀aa.
When we compare the dielectric function spectra for BMN, BZT, and BZN in Fig.8to spectra for Bi2Ti2O6O
⬘
in the P1or Pna21 structures, we find three modes between 40 and
200 cm−1 共BMN 42, 108, and 173 cm−1, BZT 50, 144 and
191 cm−1, BZN 42, 88 and 142 cm−1兲 which make large contributions to the dielectric constant for each material.18
[image:7.609.106.502.116.269.2]Parameters from Ref. 18 fitted to Eq. 共6兲 predict dielectric TABLE V. IR active mode frequencies in per centimeter, relative peak intensities in the⑀2 spectrum,
I/Imax, and mode contributions,⑀p, to the dielectric constant forPna21Bi2Ti2O6O⬘. Relative intensities are proportional toZp2/pand contributions to the dielectric constant are proportional toZ2p/2p共Eq.共4兲兲.A1,B1, andB2modes couple to light with the electric vector parallel to thec,b, andaaxes, respectively.
A1a B1a B2a
I/Imax ⑀p,cc I/Imax ⑀p,bb I/Imax ⑀p,aa
202i 40 0.48 96.7 116 1.00 69.4
54 0.15 23.4 95 0.21 18.0
91 0.38 33.7 113 0.88 62.9
122 0.17 11.5
131 0.12 7.6
286 0.21 5.7 281 0.34 9.8 267 0.11 3.4
336 0.13 3.2 285 0.13 3.6
356 0.10 2.2 334 0.12 2.9
[image:7.609.107.501.659.745.2]aOnly modes with relative intensities greater than 10% of the most intense mode are shown.
TABLE VI. IR active mode frequencies in cm−1and mode contributions,⑀
p, to the dielectric constant for
BMN, BZT. and BZN.
BMN BZT BZN
⑀p ⑀p ⑀p
42 21.6 50 16.1 42 48.8
108 18.5 144 14.8 88 12.8
constants of 68.9, 54.2, and 100.7 for BMN, BZT, and BZN, respectively. Contributions to the dielectric constant from these modes are given in TableVI.
Most of the modes listed in TableVImake contributions to the dielectric constant less than 20 while contributions for modes up to 200 cm−1 listed in TableVrange from 11.5 to 96.7. One mode in the fitted experimental data共42 cm−1 in
BZN兲has a significantly larger contribution共48.8兲. Hence it is clear that a small number of low frequency modes are responsible for the anomalously large dielectric constants in these materials.
In order to gain further insight into polarization sources in the Pna21structure, Born charges in the normal mode basis
split into atomic contributions as in Eq. 共5兲, are shown in Fig. 9. The modes analyzed are the B1 modes at 40 and
281 cm−1 and the B
2 mode at 116 cm−1. The first of these
has the largest contribution of all to the dielectric function, the second is the main contributor to the peak in the⑀2 spec-trum around 280 cm−1and the third is the main contributor to the peak around 110 cm−1.
Polarization sources in the 40 cm−1 mode shown in the left panel in Fig.9show relatively large dipole moments on Bi共1兲and Bi共2兲sites. However, these moments make a rela-tively small contribution to the total cell moment because Bi共1兲 and Bi共2兲 contributions tend to cancel. Most of the polarization of this mode comes from a fairly uniform distri-bution of dipole moments on O ions. These are not seen in Fig.9as the arrows are smaller than the O ion sphere radii. Polarization sources in the B2 mode at 116 cm−1 are
shown in the center panel of Fig.9. The majority of the cell dipole moment in this mode is associated with Ti共1兲 and Ti共2兲ions. Dipole moments on Ti共1兲sites are nearly aligned with theaaxis. SinceB2modes have a net polarization along the a axis only, Ti共1兲sites make the greater contribution to the net cell dipole moment in this mode.
Polarization sources in the B1 mode at 281 cm−1 are
shown in the right panel of Fig.9. Cell dipole moments are mainly located on some O ions and all of the O
⬘
ions. The net cell polarization is along theb axis and dipole moments are mainly strongly aligned with this axis.Figure9shows that while heavy ions such as Bi may have large amplitude displacements in low-frequency vibrational modes, they do not necessarily make the main contribution to the macroscopic polarization. The mode at 40 cm−1 is a relatively low-frequency mode with most of the polarization associated with O and O
⬘
ions.Born charges for Bi2Ti2O6O
⬘
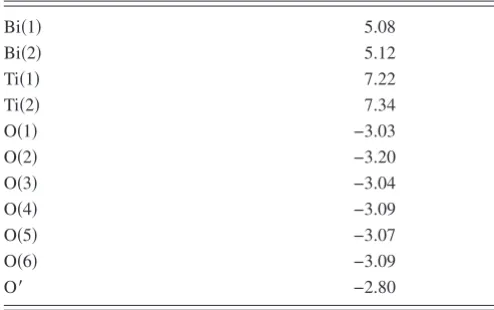
are given in TableVII. Borncharges are defined to be the trace of the Born charge tensor divided by three. TableVIIshows Born charges for Bi ions greater than 5, for Ti ions greater than 7, O ion charges ranging from −3.03 to −3.20 and an O
⬘
charge of −2.80.III. SUMMARY
The Bi2O
⬘
network in the ideal cubic pyrochlore structurecan be viewed as a diamond lattice of O
⬘
ions connected by Bi ions with well-defined O⬘
Bi4 tetrahedra. The ideal cubicpyrochlore structure contains rows of Bi ions along 关101兴 and关101¯兴directions. When this structure is allowed to relax with no symmetry constraints共P1兲 orPna21symmetry
con-straints, these rows are found to contain two distinct types of Bi ion, denoted here as Bi共1兲and Bi共2兲. The rows are visible on the diagonal running from bottom left to top right in the top panel of Fig. 5 and Bi共1兲 rows with up-down buckling are shown in Fig. 3共d兲. Bi共1兲rows contain Bi ions in a 96h
Wyckoff position of theFd¯m3 unit cell with a large displace-ment of the Bi ion from the O
⬘
O⬘
axis 共0.4 Å兲 and the pattern of displacements of Bi共1兲 is similar to the pattern shown in Fig. 7b of Ref. 3. Bi共2兲rows contain Bi ions in a 96g Wyckoff position with a smaller displacement of the Bi ion from the O⬘
O⬘
axis共0.2 Å兲.The unit cells used for the structure relaxations in this work contained 44 or 88 ions for thePna21or P1structures
and may be significantly smaller than any domain making up the macroscopic structure which has cubic symmetry on average.2Nevertheless, the pattern of displacements obtained from these cells is similar to that found from RMC data; it also resembles the structure found for Bi2Ti2O6O
⬘
inprevi-ous first-principles energy minimization calculations.5
The electronic density of states for Bi2Ti2O6O
⬘
in this work is similar to that reported previously.4–6 The charge density from bands, which are predominantly of Bi 6s char-acter, is calculated in a 共100兲 plane which contains Bi共1兲 rows and is perpendicular to Bi共2兲 rows. Charge density about Bi ions is spherically symmetric, except along BiO⬘
bond directions. It is suggested that buckling of Bi rows, which is largest in Bi共1兲rows, is caused by covalent interac-TABLE VII. Atomic Bi, Ti and. O Born charges for Bi2Ti2O6O⬘ in the Pna21structure.Bi共1兲 5.08
Bi共2兲 5.12
Ti共1兲 7.22
Ti共2兲 7.34
O共1兲 −3.03
O共2兲 −3.20
O共3兲 −3.04
O共4兲 −3.09
O共5兲 −3.07
O共6兲 −3.09
[image:8.609.53.293.65.166.2]O⬘ −2.80
FIG. 9. 共Color online兲 Polarization associated with vibrational modes in Pna21Bi2Ti2O6O⬘decomposed into dipole moments on atomic sites derived from Born charge tensors and phonon displace-ments. Left panelB1mode at 40 cm−1. Center panel B2mode at 116 cm−1. Right panelB
[image:8.609.312.559.94.249.2]tions with O
⬘
ions rather than the need to accommodate an off-center Bi 6s lone pair, as has been suggested previously.4,5,7Vibrational modes were calculated for Bi2Ti2O6O
⬘
in theFd3¯m, Pna21, and P1 structures. The imaginary part of the dielectric function was calculated using oscillator strengths obtained from Born charges in the phonon normal mode ba-sis. TheFd3¯mstructure has three unstable vibrational modes belonging to theF1u,F2u, andEuirreducible representations. The Pna21 structure has one unstable vibrational mode be-longing to theA1 irreducible representation.
Two out of sevenF1uIR active modes in the⑀2 spectrum
for the Fd¯m3 structure have the great majority of the oscil-lator strength. These modes occur at 62 and 317 cm−1. A
1
modes at 91, 286 and 336 cm−1, B
1 modes at 40, 95, 113,
and 281 cm−1and aB2mode at 116 cm−1carry the majority
of the oscillator strength in the ⑀2 spectrum of the Pna21
structure. The ⑀2 spectra for the Pna21 and P1 structures
closely resemble each other.
Oscillator strengths and mode frequencies from our cal-culations are compared to parameters obtained by fitting ⑀2
data from reflectivity measurements18 on related pyrochlore
structures such as Bi1.5Zn0.92Nb1.5O6.92. Three or four
phonons contribute the majority of the dielectric constant for Bi2Ti2O6O
⬘
, Bi1.5Zn0.92Nb1.5O6.92, Bi3/2MgNb3/2O6O⬘
, orBi3/2ZnTa3/2O6O
⬘
. These phonons lie between 40 and140 cm−1共Bi
2Ti2O6O
⬘
兲or between 40 and 190 cm−1for theother materials.18
The anisotropic dielectric constant tensor obtained for Bi2Ti2O6O
⬘
has components⑀aa= 101.7,⑀bb= 198.3, and⑀cc = 102.9. These values may be compared to isotropic dielec-tric constants measured for related pyrochlores which lie in the range 52 to 106, including a high-frequency electronic contribution of around 5.18 The dielectric constant ofBi2Ti2O6O
⬘
is difficult to obtain by similar means since itdecomposes at temperatures well below typical sintering temperatures for these materials. The value of the dielectric constant obtained for Bi2Ti2O6O
⬘
is perhaps 50 to 100% larger than these values. Larger values for dielectriccon-stants from first principles calculations may be expected since they tend to predict vibrational mode frequencies lower than experimental values, when a DFT hamiltonian is used; furthermore, sintered materials may have a lower density than that of the perfect bulk crystal and hence a lower dielec-tric constant. The anisotropic dielecdielec-tric constant tensor for Bi2Ti2O6O
⬘
may be reconciled with its cubic, macroscopicsymmetry by noting that experiment2,3 finds the cubic
sym-metry to be broken at short length scales. The unit cells used for the work reported here are much smaller than expected domain sizes, which may give a macroscopic sample a mac-roscopic, cubic symmetry.
ACKNOWLEDGMENTS
This work was supported by Science Foundation Ireland under Grant No. RFP/09/MTR2295. Computer time was pro-vided by the Trinity Centre for High Performance Comput-ing which is supported by the Irish Higher Education Author-ity and Science Foundation Ireland. The author wishes to acknowledge helpful discussions with J. C. Nino, A. L. Hec-tor, D. J. Arenas, and D. B. Tanner and to thank D. B. Tanner for suggesting this problem for study.
APPENDIX: DETAILS OF CALCULATIONS
The basis sets and pseudopotentials used for these calcu-lations were as follows: Bi the ECP78MWB quasirelativistic pseudopotential and corresponding 4s3p1d/2s2p1d Gauss-ian orbital basis from the Stuttgart/Cologne group;26 Ti the
Hay-Wadt small core pseudopotential and a 6s6p5d/3s3p3d
basis originally used in conjunction with that pseudopotential to study titanates;27 O the all-electron 14s6p/4s3p basis
originally used to study NiO共Ref.28兲supplemented with ad
orbital with exponent of 0.5. Integration over the Brillouin zone was done using a 3⫻3⫻3 Monkhorst-Pack net29 for
theP1andPna21structures and a 6⫻6⫻6 net for theFd¯m3
unit cell.CRYSTALcode lattice sum tolerances of 7 7 7 7 and 14 were used. Figures1,3–5, and9were produced using the VESTAvisualization package.30
1I. Radosavljevic, J. S. O. Evans, and A. W. Sleight,J. Solid State
Chem. 136, 63共1998兲.
2A. L. Hector and S. B. Wiggin,J. Solid State Chem. 177, 139
共2004兲.
3D. P. Shoemaker, R. Seshadri, A. L. Hector, A. Llobet, T.
Prof-fen, and C. J. Fennie,Phys. Rev. B 81, 144113共2010兲.
4R. Seshadri,Solid State Sci. 8, 259共2006兲.
5B. B. Hinojosa, J. C. Nino, and A. Asthagiri,Phys. Rev. B 77,
104123共2008兲.
6C. J. Fennie, R. Seshadri, and K. M. Rabe,arXiv:0712.1846v1
共unpublished兲.
7B. C. Melot, R. Tackett, J. O’Brien, A. L. Hector, G. Lawes, R.
Seshadri, and A. P. Ramirez,Phys. Rev. B 79, 224111共2009兲.
8M. Avdeev, M. K. Haas, J. D. Jorgensen, and R. J. Cava,J. Solid
State Chem. 169, 24共2002兲.
9I. Levin, T. G. Amos, J. C. Nino, T. A. Vanderah, C. A. Randall,
and M. T. Lanagan,J. Solid State Chem. 168, 69共2002兲.
10I. R. Evans, J. A. K. Howard, and J. S. O. Evans,J. Mater. Chem.
13, 2098共2003兲.
11Q. Zhou, B. J. Kennedy, V. Ting, and R. L. Withers, J. Solid
State Chem. 178, 1575共2005兲.
12B. Melot, E. Rodriguez, T. Proffen, M. A. Hayward, and R.
Seshadri,Mater. Res. Bull. 41, 961共2006兲.
13S. J. Henderson, O. Shebanova, A. L. Hector, P. F. McMillan,
and M. T. Weller,Chem. Mater. 19, 1712共2007兲.
14E. E. Rodriguez, F. Poineau, A. llobet, K. Czerwinski, R.
Se-shadri, and A. K. Cheetham,Inorg. Chem. 47, 6281共2008兲.
15M. A. Subramanian, G. Aravamudan, and G. V. Subba-Rao,
Prog. Solid State Chem. 15, 55共1983兲.
125401共2010兲.
17J. C. Nino, M. T. Langran, C. A. Randall, and S. Kamba,Appl.
Phys. Lett. 81, 4404共2002兲.
18M. Chen, D. B. Tanner, and J. C. Nino,Phys. Rev. B 72, 054303
共2005兲.
19J. C. Nino, D. B. Tanner, D. J. Arenas, and A. L. Hector共private
communication兲.
20R. Dovesi et al., CRYSTAL06 User’s Manual 共University of
Torino, Torino, 2007兲.
21F. Pascale, C. Zicovich-Wilson, F. Lopez, B. Civalleri, R.
Or-lando, and R. Dovesi,J. Comput. Chem. 25, 888共2004兲.
22C. Zicovich-Wilson, F. J. Torres, F. Pascale, L. Valenzano, R.
Orlando, and R. Dovesi,J. Comput. Chem. 29, 2268共2008兲.
23J. P. Perdew and Y. Wang,Phys. Rev. B 45, 13244共1992兲. 24A. D. Becke,J. Chem. Phys. 98, 5648共1993兲.
25D. M. Hatch and H. T. Stokes,Phys. Rev. B 65, 014113共2001兲.
26W. Küchle, M. Dolg, H. Stoll, and H. Preuss, Mol. Phys. 74,
1245共1991兲.
27S. Piskunov, E. Heifets, R. I. Eglitis, and G. Borstel, Comput.
Mater. Sci. 29, 165共2004兲.
28M. D. Towler, N. L. Allan, N. M. Harrison, V. R. Saunders, W.
C. Mackrodt, and E. Aprà,Phys. Rev. B 50, 5041共1994兲.