Effects of Surface Defects on Rolling Contact
Fatigue of 60/40 Brass
N. Gao, R. S. Dwyer-Joyce and J. H. Beynon
Department of Mechanical Engineering
University of Sheffield, Mappin Street, S1 3JD, UK
Abstract
A study into effects of surface defects on rolling contact fatigue of 60/40 brass under a maximum contact pressure of 600 MPa and a slide-roll ratio of -1% was undertaken on a twin-disc rolling-sliding test machine. Furrows (transverse and longitudinal) and dents (conical and diamond) were artificially introduced into a disc surface, and surface micro cracks and pits were monitored by means of surface replication. The detailed analyses revealed that high surface contact pressure and sub-surface stresses from the indentation shoulders are the main cause of surface spall failure. There is a clear defect size effect on the disc cycling life. The transverse and longitudinal furrows have a less damaging effect than the conic and diamond dents. The presence of a surface indentation can modify the elastohydrodynamic lubrication condition and the film thickness, which increase pressure and stress concentration on the trailing edge of the defect. The shape of the dent changes during the first few contact cycles. The spall initiating site is coincident with the edge of the original dent instead of the edge of the deformed dent. The spall starts with a crack initiating near the surface at the trailing edge and propagating downward to the depth of the maximum stress in a smooth Hertzian contact. The residual compressive stress around the dents, following indentation, is beneficial to prolonging the contact fatigue life.
Introduction
craters or furrow ridges. In addition, surface dents can also arise from handling of the machine assembly or overhaul.
As the traditional contact fatigue test is time-consuming and subject to variability, artificially-produced surface defects have been widely used to study defect-related contact fatigue. Wedeven and Cusano [3-5] successfully used artificially-produced defects to study the micro-elastohydrodynamic contacts, which revealed important tribological behaviour of contacting surfaces with dents and furrows. By the same principles, spherical dents were manufactured on the raceway of the specimen to investigate their influence on contact fatigue [6], and micro cracks and pits were observed around the indentations [7]. Transverse furrows were studied by Martin [8] in the rolling contact fatigue test. Some of the most recent experimental and theoretical research has been performed by Cheng et al. [9] in pure rolling tests, and Ai and Lee [10], Xu et al. [11], Cheng et al. [12] in rolling/sliding tests.
Although there has been some progress on this particular subject of rolling contact fatigue related to surface defects, however, there are still a number of questions pertaining to the effects of dents on ehd lubrication, initiation site of cracks, mechanisms of surface spall failure and their influence on surface residual stress. A better understanding of the pre-defected surface changes that take place around such indentations is also required. In addition, most of previous work has been performed on bearing steels and there is lack of fundamental data for other materials. This paper addresses some of these questions from an investigation of a 60/40 brass, a widely used material for mechanical components such as gears, bearing and bushes, to determine the effect of surface defects on the rolling contact fatigue process.
Experimental Procedure
1. Test Machine
The rolling contact fatigue experiments were conducted in the laboratory using a twin-disc rolling-sliding test machine [13]. The machine is based upon a standard Colchester mascot 1600 lathe. It uses the lathe gear box to drive the top “follower” disc. A 4 kW d.c. motor drives the bottom “driving” disc via a separate interchangeable gear box. A computerised control system has been fitted, and all instrumentation has been interfaced to a computer based data acquisition system. The desired slide-roll ratio is obtained by controlling the two disc speeds. A calibrated torque transducer is used to measure the traction at the contact between the two discs. Figure 1 shows the machine and the experimental set-up [14].
2. Materials and Test Procedure
Ra= 0.2~0.5µm. The dimensional tolerance of the discs was measured for roundness and possible eccentricity between the track surface and the bore using a Talyrond profilometer. The mean Vickers hardness number of the specimen surfaces was 131 HV, measured with a 20 kg load.
Four types of surface defect, furrow (transverse and longitudinal to the rolling direction) and dents (conical and diamond) were manufactured respectively on the follower disc surface before the test. The lengths of the furrows were approximately 5 mm, and were made on a lathe by a cutting tool with a carbide tip (with a tip radius about 0.05 mm). The conical and diamond dents were made by using a Rockwell and a Vickers testing machine with different loads. The size of surface defects was measured on the disc surface and sectioned specimens. It has been shown [15] that shallow transverse scratches do not have a great effect on rolling contact fatigue, so a very light scratch (0.06 mm wide and 0.02 mm deep) was used to measure the effect of plastic flow.
Rolling contact tests were conducted under a maximum contact pressure of 600 MPa (as determined from elastic Hertzian analysis). The slide-roll ratio (defined here as the difference in surface speeds divided by the mean surface speed) was set to -1%. The contact area was oil lubricated using a gravity drip system supplying approximately 1 drip per 5 second. All of the test conditions are shown in Table 1. The test was stopped at each 50 000 to 60 000 cycles until a spall was found. At each interval surface replicas were taken on the disc surface and were subsequently examined by optical microscope. Selected disc surfaces were examined using a scanning electron microscope (SEM). The discs were weighed and their diameters measured at the beginning and at each interval during the test.
Experimental Results
1. Coefficient of Traction and Weight loss
Recording the torque transmitted between the two test discs during the test cycles enabled the behaviour of traction coefficient to be monitored as the rolling process proceeded. The coefficient was shown almost constant at 0.02 throughout the test. Weight loss per cycle is plotted in Figure 3 against number of rolling cycles. It can be seen that there is a running in process with a higher initial wear rate during the first 50 000 cycles followed by a steady decrease. After 300 000 cycles the wear rate of follower disc increases. In general the wear rate is very low (at most 0.02 µg cycle/ ). As a result, the change of disc diameter was almost negligible (within a measuring accuracy of 10µm).
2. Surface plastic deformation and hardening
that there is almost no obvious plastic flow on the disc surface away from the defects. An examination of sectioned and etched specimens after 360 000 cycles indicated that there is only a very shallow deformed surface layer, about 30-40µm in depth, which is almost invisible on the disc surface by the straight line. Microhardness measurements underneath the surface of sectioned specimens also confirmed that there was no surface hardening at the current experimental stress range. This layer of plastic deformation is likely to be associated with the disc surface roughness.
3. The Shape of Deformed Defects
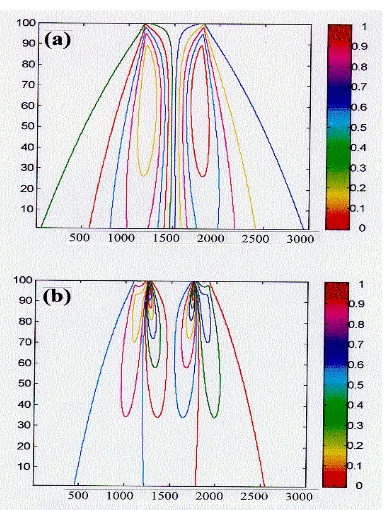
The size of defects showed an obvious change some time during the first 50 000 cycles and then remained virtually stable during the test. For example, the original diameter of the conical dent was 0.53 mm before starting the test. It reduced to 0.36 mm (a reduction of 32% in diameter) after 50 000 cycles and 0.31 mm after 360 000 cycles (See Figure 4). Similarly, the original diameter of diamond dent was 0.55 mm and it decreased to 0.40 mm (a reduction of 27%) at 50 000 cycles and 0.38 mm after 360 000 cycles (See Figure 5). The transverse and longitudinal furrows with a width about 0.12~0.15 mm demonstrated a similar change, i.e., a distinct decrease in their width taking place during the first 50 000 cycles.
In order to trace the change of dent size in the early stages, an additional test was run and stopped regularly at less cycles for a new dented disc. Figure 6 reveals that dramatic reduction in dent size and the collapse of the dent edge only requires a few cycles. The dent size kept almost stable after 180 cycles and had very little change with further cycling. It also can be seen from Figure 6 that the size of conic dents drops and stabilises more quickly than the size of diamond dents.
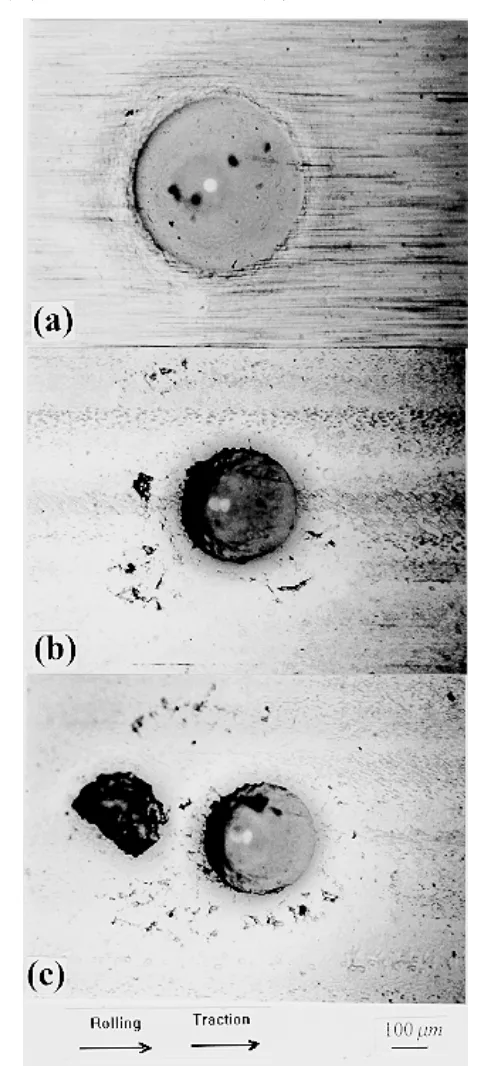
The original geometrical centre of the dents, shown as the bright spots in the Figures 4 and 5, were no longer at the centre of deformed defects. In addition, it is noted that there is greater change of dent shape at the trailing edge than the leading edge. That is, the trailing edges of dents were curved to a larger extent than the leading edges during the cycling (see Figures 4(b),(c) and Figure 5(c), (d)). In this study, the edge which enters the contact zone first is defined as the leading edge, and the edge that comes into contact later is the trailing edge. The direction of friction force is determined by the sliding condition. For the present case, the friction force acting on the follower disc was directed from the trailing to the leading edge because the speed of follower disc was less than that of the driving disc.
4. The Cracks and Spalls
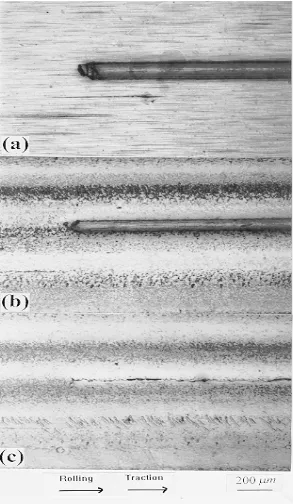
000 cycles, the cracks near the dent are still small, which indicates that spall formation is dominated by the initiation phase. A longer crack was formed nearby on the trailing edge of the diamond dent at 300 000 cycles (Figure 5c), which finally developed into a large spall with a size of 1.6×0.8 mm on the trailing edge after 360 000 cycles (see Figure 5d). Interestingly, it was surprising that neither transverse nor longitudinal furrows seemed to have particular influence on disc cycling life under the current experimental condition. No obvious pit or crack was observed around these furrows although the scratches were worn out somewhat with increasing the number of cycles (Figures 7 and 8).
A clearer picture can be obtained from SEM examination of the specimen surface. Figure 9(a) shows the failure surface with the diamond dent shown in Figure 4(c). The three stages of forming a spall as crack initiation, fast propagation and final shear lip of the crack, indicated as B, C, D in Figure 9(a), is shown respectively in Figures 9 (b, c and d). The fast propagation region occupies over 90 percent of whole spall area (shown in Figure 9c) and is characterised mainly by cleavage and partly quasi-cleavage fracture. There are more quasi-cleavage fracture before the fast propagation region reaches the final shear slip region. A series of sectioned surfaces around the above diamond dent have been examined to observe the morphology of the dent and spall underneath the surface. Figure 10 is taken near the centre the of the dent perpendicular to the disc axis. This demonstrates that the spall, with a depth of 0.18 mm, is located just behind the trailing side of the Vickers diamond dent and a crack propagates at the bottom of the spall. An enlarged photo from an etched surface shows that this crack grows transgranularly and is almost parallel to the disc surface (Figure 11).
5. The Effect of Dent Size
There is an obvious dent size effect on fatigue life for the conical dent. As shown in Figure 4, the dent with a original diameter of 0.53 mm caused a failure of disc (indicated as the occurrence of a spall on the disc surface) after 240 000 cycles. However, there were only a few small pits occurring at the trailing edge of the smaller conical dent with an original diameter of 0.28 mm. They had not propagated after 360 000 cycles and seemed unlikely to develop further because they were being worn out by further cycles.
6. Effects of surface residual stress from indentation and lubrication condition
droplet per 5 seconds). Here a spall formed after 240 000 cycles. Clearly lubrication condition plays an important role in contact fatigue life.
Discussion
1. Surface plastic deformation
In a smooth Hertzian contact, the maximum shear stress, and therefore the onset of yielding, occurs below the surface. For a line contact, subsurface yield begins when the average contact pressure is approximately 1.8 times the tensile strength of the material. However, this subsurface plastic zone is surrounded and constrained by material that is still responding elastically. Average contact pressures as high as three times the tensile yield strength of the material may be required before the plastic zone grows sufficiently to reach the surface, resulting in bulk plastic flow [16]. For the material used in these tests, loaded to a peak pressure of 600 MPa (approximately twice the tensile strength), gross surface plastic flow would not be expected. There may be some localised plasticity around surface asperities; and there certainly is plastic flow observed around the artificial defects.
2. Pressure distribution and sub-surface stress
Rolling contact fatigue failure has now been identified to be largely due to propagation of surface initiated cracks around surface defects such as asperities or dents. The crack initiation around such defects is thought to be controlled by the normal and shear stress field [1]. In this work the contact stress distribution, around surface defects have been calculated using a numerical elastic contact approach, the method (described in reference [16] and implemented by [17-19]) involves the discretisation of the rough or damaged surface. The contact pressure is represented by an array of point loads, pj acting at each surface node. The deflection at any model point, ui, may be determined from the superposition of the deflections caused by each discrete load.
{ }
uz i = ∑Cij pj (1)shoulders. Also, the analysis does not take into account the effects of residual surface stresses which play an important role as indicated in our experimental result and discussed later in the paper. However, this approach is more appropriate for the modelling of dents which have reached a shakedown state. The pressure within the cavity drops to zero as the two bodies fail to make contact. The Hertzian pressure distribution for the contact between smooth surfaces is also included in Figure 12, which is much lower than the pressure at the indentation shoulders.
The sub-surface stress state may be obtained once the contact pressure has been determined (again by the superposition of stresses caused by each surface point load). The subsurface shear stress, τxz, field associated with the defects of Figure 12 is shown in Figure 13. High shear stresses are observed beneath the dent shoulders. It is these in-plane x-z orthogonal stresses which are usually considered to be primarily responsible for surface related fatigue failure [20].
3. Effect of dents on EHD lubrication
The contact stress analysis given above does not consider the effect of lubrication which may redistribute the contact pressure within the contact of the rolling bodies and produce additional effects. It has been shown that the fluid film thickness in elastohydrodynamic contact to is related a material parameter equal to 2αE*, a speed parameter U−ηo 2E R* and a load parameter W 2E R L* . Dowson and Higginson’s semi-empirical power law equation gives, h
−
, the mean thickness of the fluid film as [21]:
{ }
h R E U E R W E RL − − − = 311 2 2 2 0 56 0 69 0 1 . * . * . * .α ηo (2)
where α =20 .0 GPa−1 is the pressure viscosity coefficient; ηo =0 20. Pa s, the base viscosity; E*, the reduced modulus; U− , the mean surface speed; R, the reduced radius; and W L is the load per unit length. Calculation of equation (2) shows that the central film h− is 1.09µm, much more than the roughness of specimen surface, indicating that the contact is in the ehd lubrication region for this experimental condition.
show that ehd film thickness is slightly different for the leading and trailing edges of the dent. The presence of the dent locally increases the slope at the leading edge of the dent, while, at the trailing edge, the slope has changed to the opposite direction. These local modifications of the shape of the inlet region affect the hydrodynamic pressure generation in the inlet region. Evidence of this can be seen by the local reduction in film thickness at the leading edge of the dent [22]. This local reduction in film thickness continues to appear as the dent passes through the Hertzian region. Wedeven [3] explained that the greater slope at the leading edge of the dent should be less favourable for pressure generation than the trailing edge where the slope is in the opposite direction. The reason is that the local reduction in film thickness at the leading edge must be accompanied by a reduction in pressure and stress concentration. The trailing edge, however, does not receive the same benefit.
Compared with pure rolling condition, sliding as well as rolling provides addition ehd effects. The presence of sliding may increase the stress concentration at the trailing edge. The leading edge, according to Chiu [23], may benefit from a reduction in local pressure under sliding conditions. In our tests the slip was only -1% and the traction coefficient was shown almost constant as 0.02 throughout the test, so the effect of sliding may be insignificant. Therefore, the influence of sliding on sub-surface stresses and the subsequent contact failures are mainly introduced through contact pressure alterations rather than surface friction [10].
The important role of liquid in creating the crack tip stress histories during cyclic contact loading has been discussed by Way (24), Keer and Bryant (25), Bower (26), Kaneta and Murakami (27) and Bogdanski et al. (28). It is widely believed that liquid can influence fatigue crack growth by reducing friction between crack faces, by pressure on the crack faces as fluid flows into the crack, and by the “fluid entrapment effect” exerting hydrostatic pressure at the crack tip.
4. Effects of transverse and longitudinal furrows
From the test work, it is surprising that no pits or cracks were initiated at the transverse or longitudinal furrows. It might be expected that similar stress raising affects would be present at furrow edges as those of similar scale axisymmetric dents. However we note that during the formation of the conical and diamond indentation, a raised shoulder is formed around the dent (see Figures 4(a) and 5(a)). Such a shoulder may be present on the sides of the transverse and longitudinal furrows, but to a much lesser extent (see Figures 7(a) and 8(a)) since they were formed by a cutting tool in a metal removal process. The plastic deformation around the defects and the height of edge build-up is thought to be an important parameter and the main reason for cracks to be easily initiated around dents and not around transverse and longitudinal furrows.
surface. The defect will then pass through the Hertzian region with less elastic deformation and its shape will approach its undeformed shape. The width of these furrows (0.12~0.15 mm) in the experiments are less the diameter of these dents (0.53~0.55 mm), therefore the transverse and longitudinal furrows have less damaging effect than the conic and diamond dents.
5. Spall formation
Figure 6 shows that the dramatic reduction in dent size and the collapse of the dent edge only requires a few cycles. The experimental results from Holzhauer [7] and Cheng [9] also demonstrated that the large indentation has undergone a similar reduction in diameter. This indicates that some plastic flow is occurring to relieve the excessive shoulder stresses. Surface plastic deformation has been detected at surface defects shoulders by means of a surface trace across the furrows [29]. It is believed that this phenomenon is due to the high shear stress predicted as occurring at the these surface defects. This plastic deformation causes the defect corner radii to increase, indicating that the material underneath the defect shoulder flows plastically through rolling. It is plausible to assume that the surface profile of defect shoulder stabilises, i.e., the plastic deformation area ceases to expand after a certain number of stress cycles, thus providing a type of shakedown process on a microscopic scale. This shakedown process can mean that loads sufficiently large to cause plastic deformation in the early cycles of loading may be accommodated purely elastically in the later stages of the life [30]. Using this argument, it may be assumed that the surface defect profile will behave elastically after a stabilised surface contour is achieved.
Although the above argument may explain the behaviour of dent size change with cycling, it cannot explain why a spall does not initiate directly from the edge of a deformed dent, but instead starts a small distance behind the indentation. In fact, other researchers have obtained similar results [6, 12, 31] and no clear explanation so far has been given. Complete understanding of the mechanism of spall initiation and propagation around a dent is of importance in studying rolling contact fatigue life.
edge of deformed dent, as observed in Figures 4 and 5. A schematic diagram of spall formation around a dent during rolling/sliding is shown in Figure 15.
It is noted from surface replica observation that micro crack and pit initiation is the dominating process and the growth rate is relatively small. Once a long crack is formed, it quickly develops into a spall. The region of maximum shear stress, τ1 for a smooth Hertzian control occurs at a depth of
z
=
0 78
.
a
where a is the contact half-width [20]. For this test condition the calculated depth of maximum principal shear stress, 177µm, is close to the depth of 180µm at which the spall propagates, shown in Figure 10. Ai and Lee [10] obtained a similar experimental result in which the spall started with a crack initiating near the surface at the trailing edge and propagating downward to the depth of the maximum stress in a Hertzian contact. The crack would then turn and propagate parallel to the surface, forming a spall. Also, the spall induced by the surface indentations was several times larger than the dents themselves.6. Effects of surface residual stress
Extensive work has been conducted on the dent effect on life reduction in contact fatigue, however, no experimental work on the residual stress effect has been reported. Residual stresses are caused both during indentation and during overrolling of the dent in the contact. These residual stresses will affect the subsequent internal stress distribution. The finite element method has been used to investigate the residual stresses due to each process and their combined effects on the internal stress distribution [32]. As the contact passes over the dent the material will pass through a shear stress cycle. The amplitude of this cycle is not affected by the presence of residual stress. However it is likely that a tensile residual stress environment will promote the initiation of cracks whilst a compressive stress region will reduce it. One approach for modelling this behaviour by Dang Van [33], is to introduce an empirically derived fatigue criterion where the shear stress amplitude τa is corrected by the hydrostatic pressure pH.
τa − βpH (3)
However the defect geometry is still the main influence of fatigue life. The experiments carried out here are the first evidence of this phenomena. The life of the indented surface was reduced by annealing the indentation residual stresses.
Conclusions
A study into effects of surface defects on rolling contact fatigue of 60/40 brass under a maximum contact pressure of 600 MPa and a slide-roll ratio of -1% was undertaken on a twin-disc rolling-sliding test machine. Furrows (transverse and longitudinal) and dents (conical and diamond) were artificially introduced into a disc surface, and surface micro cracks and pits were monitored by means of surface replication throughout the tests.
1. The original dent is plastically deformed within a few cycles. Subsequent cycles do not cause significant change in dent geometry. It is likely that the dent has shakendown at this stage.
2. There is an obvious defect size effect on the disc cycling life. The transverse and longitudinal furrows have a less damaging effect than the conic and diamond dents. This is thought to be due to the absence of raised shoulders of material at the defect edges.
3. Extremely high contact pressure is predicted at the dent shoulders. The dent in the contact region significantly affects the internal stresses and brings the maximum stress to the surface. High surface contact pressure and sub-surface stresses from the indentation shoulders are the main cause of surface spall failure.
4. The presence of a surface indentation can modify the ehd lubrication condition and the film thickness. This increases pressure and stress concentration of the trailing edge of the defect.
5. Because the site of most severe plastic deformation from both indentation and rolling occurs around the original edge of a dent, this serves as the location of the crack initiation site.
6. The spall starts with a crack initiating near the surface at the dent trailing edge and propagating downward to the depth of the maximum stress in Hertzian contacts. The crack then turns and propagates parallel to the surface. A spall forms when this crack releases an unstable volume of material.
Acknowledgements
This project was fully funded and supported by the Engineering and Physical Sciences Research Council and British Steel Track Products. Appreciation is expressed to Dr. Jay Jaiswal, British Steel Track Products, for his helpful comments. Thanks also due to David Fletcher and Mike Frolish for assistance during this work.
References
1. H. S. Cheng and M. Bali, in H. S. Cheng (ed.), Solid Contact and Lubrication, ASME, New York, 1980, pp 205-222.
2. H. Dalal and P. Senholzi, ASLE Transactions, 20(1977), 233-243. 3. L. D. Wedeven and C. Cusano, ASLE Transactions, 22(1979), 369-381. 4. C. Cusano and L. D. Wedeven, ASLE Transactions, 24(1981), 1-14.
5. C. Cusano and L. D. Wedeven, ASME Journal of Lubrication Technology, 104(1982), 365-375.
6. G. T. Hahn and C. A. Rubin, in Y. W. Chung and H. S. Cheng (eds.), Advances in Engineering Tribology, STLE. Park Ridge, SP-31, 1991, pp 55-70.
7. W. Holzhauer, Tribology Transaction, 34(1991), 361-368.
8. J. A. Martin and A. D. Eberhardt, ASME Journal of Basic Engineering, 89(1967), 932-942.
9. W. Cheng, H. S. Cheng and L. M. Keer, Tribology Transaction, 37(1994), 51-58. 10. X. Ai and S. C. Lee, Tribology Transaction, 39(1996), 881-889.
11. G. Xu and F. Sadeghi, Journal of Tribology, 119(1997), 579-587.
12. W. Cheng, H. S. Cheng and L. M. Keer, Tribology Transaction, 37(1994), 1-12. 13. J. H. Beynon, J. E. Garnham and K. J. Sawley, Wear, 192(1996), 94-111.
14. D. J. Flectcher and J. H. Beynon, Submitted for publication to Wear, (1998). 15. Y. C. Chiou and J. R. Hwang, Tribology International, 24(1991), 101-107. 16. K. L. Johnson, Contact Mechanics, Cambridge University Press, (1987).
17. R. W. Snidle and H. P. Evans, Proceedings of the Institution of Mechanical Engineers, Part J: Journal of Engineering Tribology, 208(1994), 291-293.
18. A. A. Lubrecht and E. Ioannides, Transactions of the ASME, Journal of Tribology, 113(1991), 128-133.
19. M. N. Webster and R. S. Sayles, Transactions of the ASME, Journal of Tribology, 108(1986), 314-320.
21. J. A. Williams, Engineering Tribology, Oxford University Press, (1994). 22. L. D. Wedeven, ASLE Transactions, 21(1978), 41-52.
23. Y. P. Chiu, S. Borgese, J. I. McCool and T. E. Tallian, Final Technical Report RADC-TR-69-264, Nov, (1970).
24. S. Way, J. Applied Mech., Trans. ASME, 2(1935), 49-58.
25. L. M. Keer and M. D. Bryant, ASME Journal of Lubrication Technology, 105(1983), 198-205.
26. A. F. Bower, Transactions of the ASME, Journal of Tribology, 110(1988), 704-711. 27. M. Kaneta and Y. Murakami, Transactions of the ASME, Journal of Tribology,
113(1991), 270-275.
28. S. Bogdanski, M. Olzak and J. Stupnicki, Wear, 191(1996), 14-24.
29. Y. P. Chiu and J. Y. Liu, ASME Journal of Lubrication Technology, 92(1970), 258-263. 30. A. Kapoor and J. A. Williams, Wear, 172(1994), 197-206.
31. H. Lorosch and F. Kugelfischer, Journal of the American Society of Lubrication Engineers, 41(1985), 37-43.
32. G. Xu, F. Sadeghi and M. Hoeprich, Tribology Transaction, 40(1997), 613-620.
33. K. Dang Van, B. Griveau and O. Message, in M. W. Brown and K. J. Miller (eds.), Biaxial and Multiaxial Fatigue, EGF 3, 1989, pp 479-496.
34. E. Beghini, R. S. Dwyer-Joyce, E. Ioannides, B. Jacobson, A. A. Lubrecht and J. H. Tripp, J. Phys. D: Appl. Phys. 25(1992), 379-383.
35. R. S. Dwyer-Joyce, J. C. Hamer, J. M. Hutchinson, E. Ioannides and R. S. Sayles, in D. Dowson, C. M. Taylor and M. Godet (eds.), Proc. of 17th Leeds-Lyon Symposium on Tribology, eds., 1991, pp 391-400.
List of the Figures:
Figure 3. Relationship between the wear rate of the discs and the number of rolling cycles for brass.
Figure 4. Progression of damage on the disc surface around a conical dent. (a) N = 0; (b) N = 120 000; (c) N = 240 000 cycles.
Figure 5. Progression of damage on the disc surface around a diamond dent. (a) N = 0; (b) N = 120 000; (c) N = 300 000; (d) N = 360 000 cycles.
Figure 6. Relationship between the dent size and the number of rolling cycles.
Figure 7. Morphology around a transverse furrow on the disc surface. (a) N = 0; (b) N = 120 000; (c) N = 240 000 cycles.
Figure 8. Morphology around a longitudinal furrow on the disc surface. (a) N = 0; (b) N = 120 000; (c) N = 300 000 cycles.
Figure 9. Morphology of a spall formation around a diamond dent by SEM. (a) a overall of the failure surface; (b) spall initiation site; (c) spall fast propagation area; (d) final shear lip of spall.
Figure 10. Morphology of the diamond dent and spall observed from a sectioned surface. Figure 11. A transgranular crack growth at the bottom of the spall.
Figure 12. Contact geometry and pressure distribution as calculated from a numeral simulation. The top disc contains a dent and is loaded against a smooth disc.
Figure 13. Subsurface shear stress
τ
xzdistribution surrounding a dent loaded in rolling contact.Figure 14. SEM photograph showing the trailing edge of the conical dent suffered more damage than the leading edge.
Figure 15. A schematic diagram of a spall formation around a dent during rolling/sliding contact.
Table 1 Test Condition
Test Material 60/40 Brass
Initial Surface roughness, (Ra,µm) 0.2 ~ 0.5
Types of Surface Defects Furrow (Transverse and Longitudinal) and Dents (Conical and Diamond)
Maximum Contact Pressure
(
MPa)
600Test Speed (RPM) 397(Follower disc)/402(Driving disc)
Coefficient of Traction 0.02
Test Environment Oil
Lathe headstock and motor
Torque transducer
Fixed bearing (top)
Pivoted bearing (bottom)
Test discs
AC Motor
Gearbox Pivoted drive shaft
Solid drive shaft
Hydraulic piston and load cell
Eddy current probe position (support not shown)
Eddy current probe scanning system
Shaft encoder Shaft encoder
ABB ACS600 Motor Controller Pentium 100 Computer
Lathe bed
[image:15.595.70.527.160.367.2]®
Fig. 2 A Close-up View of the Twin
Disk Testing Machine
Fig. 3 Relationship between the Wear Rate of the
Discs and the Number of Rolling Cycles
0 5 10 15 20 25
0 100000 200000 300000 400000
Number of rolling cycles
Weight loss/Cycle (ug/cycle) x 100
Weight loss of follower disc
[image:16.595.123.449.520.728.2]Fig. 4 Progression of Damage around a Conical
Dent.
Fig. 5 Progression of Damage around a Diamond Dent. (a)
N=0; (b) N=120 000; (c) N=300 000; (d) N=360 000 cycles.
Fig. 6 Relationship between the Dent Size and the
Number of Rolling Cycles
0.2 0.3 0.4 0.5 0.6
0 1000 2000 3000 4000 5000
Number of rolling cycles
Dent size (um)
[image:18.595.138.450.527.727.2]