Maximising Power Generation in a Small
Hydropower System using Pumped Storage
Technology
Samuel A.O. Ilupeju and Freddie L. Inambao
Abstract - Small hydropower potentials spread across a wide range of communities in sub-Sahara Africa. Most of these potentials are untapped leaving dwellers in complete darkness, a situation which paralyses economic and social activities. Some of the reasons for this are lack of fund to carry out the power projects, high cost of transmission and distribution of power from generation location to consumers far away from the main grid. This work proposes a hybrid of both conventional and pumped storage systems small hydropower schemes to generate electricity, especially with the aim of feeding the dwellers within plant location with adequate electricity and also feed the rest into the main grid. Mathematical equations were developed for the proposed system. Model design and automation results were presented in the paper.
Index Terms - Renewable energy, conventional-hydropower, pumped-storage hydropower, small-hydropower, power generation.
I. INTRODUCTION
Electricity is a scarce resource and its generation is a product of various scientific knowledge, engineering processes, and management proficiency. A good sum of monetary investment and know-how is usually involved, which is a good reason consumers should be aware of the significances of proper and efficient use of it. The first step in controlling the effects of its inadequate generation on the society is prudent utilisation. Electricity consumption should be based on need and not of social status as many do believe. The element of social or financial status cannot be ruled out anyway, but the fact still remains that adequate generation of power is every government concern, which none has taken for granted. The truth is that almost all significant economic activities depend on timely and adequate supply of power.
Mathematically power is energy available per time, which makes the time of power availability to carry out specific activity very important.
Manuscript received July 12, 2016.
Samuel. A. Ilupeju is postdoctoral fellow with the Green Energy Solutions (GES) Research Group University of KwaZulu-Natal.
(Correspondence-mail: [email protected]).
Freddie L. Inambao is a Professor and the Head of Green Energy Solutions (GES) Research Group, Discipline of Mechanical Engineering at the University of KwaZulu-Natal, South Africa.
(e-mail: [email protected]).
Power requirement and demand are different per operation, device, and time [1], [2]. This is a good reason for putting proper planning in place to ensure smooth running of every activity based on the demand per time, the supply, and also the prediction of demand growth options.
2012 Key World Energy Statistics still reveals that major energy sources playing giant roles in global power generation are oil, coal, and natural gas [3]. These three sources occupy a huge proportion of about 81.7% of the total world energy generation. These sources also contribute significantly to environmental pollution. Generation of power in South Africa is handled by ESKOM [4]; a state owned utility company which generates about three-quarters of Africa‟s electricity and is said to supply about 95% of electricity in South Africa. Recent power generation capacity is approximately 40000 MW, of which over 80% is achieved using coal, the remaining percentage is through nuclear and hydro-pumped storage [5]. The issue of environmental degradation and climate change is a serious concern and efforts are in place to ensure the whole world is kept green and thereby more habitable for every life [6]. To achieve this, our sources of energy generation must be seriously reviewed in a way to accommodate available renewable energy sources through strategic electricity planning and implementation [7]. This action will minimise pollution and environmental degradation attached to conventional generation of power.
II. RENEWABLE ENERGY SOURCES DEVELOPMENT
According to [5] the abundance of coal resources in South Africa has been the main justification for engaging in coal fired power generation. Climate change, decline in coal quantity and the high cost of developing new coal mines are threats to the future availability of this resource. There have been several efforts to reduce the country‟s carbon emission [8]. During the Copenhagen climate change talks in December 2009 South Africa announced that they would aim to reduce the country‟s carbon emission by at least 34% by 2020. Apart from carbon emission, another environmental hazard is increase in acid mine drainage cause by coal mining activities [9].
season over the year, therefore renewable energy is climate controlled generation and consumption is climate controlled [12]. In urban centres where energy consumption is on the high side, base load is provided by more efficient power plants. In rural settings, with small overall consumption and few cottage industries, base load can be met with electricity supply from renewable sources [13].
Hydro-power has come to stay in electrical power generation in the world as a renewable energy source. According to [14], in 2002 hydro-power both large and small contributed up to 19% of world electrical power. [15] predicts that the global demand for electrical energy will gradually rise and the growth for HP production is projected at 2.4% - 3.6% from 1990 to 2020. Small scale hydro-power (SHP) is considered to be one of the most cost effective and environmental friendly energy generation technologies available [14], in most cases just water running through a river without storage, or surface dam or at a given head. It is the most ideal small scale energy technology for isolated and/or rural community electrification in developing countries. SHP “run of river” schemes have minimal environmental impacts.
[14] stated that exploited HP potential was 2650 TW/yr. Other renewable combined generated less than 2% of global power need. North America and Europe are leading in terms of exploited hydro-potentials compared to other continents. About 40 GW of global consumption is generated by small hydro with China contributing 15 GW which is believed to reach 100GW if fully exploited. About 18 GW is estimated to be generated from SHP. In Europe, HP provides 17% of electricity [14], [16] with a target of 4.2 GW increase by 2010, being generated from over 120 HP sites and able to provide 100 MW capacity, spread over the continent. Due to the huge initial financial and technical investment involved in large hydropower plants installation, coupled with highly qualified and trained personnel needed in design, installation and maintenance, small HP can come in to salvage the situation [17], [18], [19].
[image:2.595.308.551.313.450.2]In areas where availability of water is a challenge, pumped storage hydropower schemes integration will offer one of the best alternatives [20] to enhance generation from conventional hydroelectric power stations and to provide the power needed during peak periods through allowing water retention and reuse instead discharge [21], [22].
Figure 1: Electricity consumption sketch in South Africa.
A pumped storage hydropower system consists of two reservoirs at different elevations with the turbine house and pumping plant between the two reservoirs [23], [24]. During off-peak periods, water is lifted from the lower reservoir to the upper reservoir while power demand is low, but the same is released at peak demand time to run the turbines and convert hydraulic energy into mechanical energy and then into electricity by means of a generator attached to the turbines shafts [25]. Though it is more expensive to operate when compared to conventional hydropower plants as result of the cost of pumping, but the benefit is significant because the response is quick during demand and brings about main grid stability [26].
III. THE PROPOSED HYBRID MODEL DESIGN Need is on the increase in the aspect of improving the efficiency of hydropower generation plant designs beyond turbine and generator efficiency [27], [28]. The proposed hybrid power plant is designed to generate 300 kW from the running river „River I‟ as revealed in Figure 2.
Figure 2. A sketch of the proposed PSH and hydropower hybrid power plant.
At off peak hours from Figure 1, pump lifts water from the lower reservoir as shown in Figure 2 to the upper reservoir at a calculated suitable height. This is stored until the next peak hour when it is released to augment the conventional hydropower plant. MATLAB Simulink is used in the modelling of the design and for ease of simulations. All required parameters were mathematically modelled. A control mechanism is installed to manage generation at the PSH and pumping mode. Flowcode V5 AVR and Proteus ISIS were the two modelling tools used. Flowcode,a graphical programming tool which designed complex electronic systems and Proteus, a programming software that integrated perfectly microprocessor models and animated components which helped combine microcontroller related designs‟ simulations were used to develop control of the proposed plant.
Mathematical Representation of the Design:
𝑃𝑔 = 𝜌𝑤. 𝑔. 𝑄𝑔. 𝐻𝑔. 𝜂𝑡 (1)
𝑃𝑝 =
𝜌𝑤. 𝑔. 𝑄𝑝. 𝐻𝑝 𝜂𝑝
[image:2.595.47.287.597.749.2]From equation 2,
𝑄𝑝 = 𝑃𝑝. 𝜂𝑝/ 𝜌𝑤. 𝑔. 𝐻𝑝 (3)
Pg = rated generating power at PSH,
ηt = turbine efficiency,
ρw = density of water in kg/m3
𝑔= gravitational constant in m/s2
Qg = rated generating flow in m3/s at the PSH
Hg = rated generating head in m at the PSH = 5 m
Pp = pumping power,
Qp = pumping flow in m3/s
ηp = pump efficiency,
Hp = rated pumping head in m to III = 5 m
HL = losses in the line pumping line to III in m.
Firstly, one needed to design parameters l such as diameter of the suction and delivery pipes. Calculating the flow was the first approach. From Figure.1, the first peak is about one-third of the primary generation,
Using test plant data in Equation 3,
𝑄𝑝=
1308 ∗ 0.75
1000 ∗ 9.8 ∗ 5 = 0.016 𝑚 3/𝑠
second peak is about two-third of the primary generation, Qp = 0.016 m3/s while at 2.616 kW, Qp = 0.04 m3/s.
Considering losses in the pipe, an average flow of 0.03 m3/s was achieved for the lifting of water from the lower to the upper reservoir.
In 8hr pumping operation,
Volume to be lifted = 0.03*3600*8 = 864 m3
A pipe diameter to account for losses, not more that 10% hydraulic, was selected; 0.2 m for suction line and 0.15 m for delivery line.
Surface area of suction pipe
As =
(0.22) ∗𝜋
4 = 0.03142 𝑚 2
Surface area of delivery pipe
Ad =
(0.152) ∗𝜋
4 = 0.0177 𝑚 2
But𝑉 =𝑄 (4) 𝐴 From Equation 4,
Therefore 𝑉𝑠=𝑄 𝐴 𝑠 =
0.03
0.03142 = 0.955 𝑚 𝑠
And also, 𝑉𝑑 =𝑄 𝐴 𝑑 =
0.03
0.0177 = 1.7 𝑚 𝑠
Figure 3 is used to generate losses in the pumping mode, there is need to find the friction factor f using the values of Reynolds number Re and relative roughness 𝜀 𝐷. The value of 𝜀 for a steel pipe = 0.045*10-3
𝜀 𝐷
= 0.0000450.2 = 0.225𝑒−3 (5) Now calculating the Reynolds Re,
Res = 𝑉𝑠∗ 𝐷𝑠/𝜗
ϑ, kinematic viscosity of water at 20°C = 1.004𝑒−6 Res = 0.955∗ 0.2/1.004𝑒−6 = 1.95𝑒5
Red = 1.7∗ 0.15/1.004𝑒−6 = 2.54𝑒5 Using Moody‟s diagram,
fs = 0.015
fd = 0.017
Losses were calculated at the entrance, elbows, valve, pump, pipes (suction and delivery) and at the exit. Details of this were not presented in this manuscript, but the values will be used in relevant calculations [29].
Major head losses hmajor 𝑓 ∗𝑙
𝐷∗ 𝑉2
2𝑔(Ksuction + Kdelivery) (6)
𝑓𝑠∗ 𝑙𝑠 𝐷𝑆∗
𝑉𝑠2 2𝑔+ 𝑓𝑑∗
𝑙𝑑 𝐷𝑑∗
𝑉𝑑2 2𝑔
ls and ld are suction and delivery lengths respectively
0.015*3 0.2∗
0.9552
2𝑔 + 0.017 ∗ 5 0.15∗
1.72 2𝑔
0.006975 + 0.0833
Minor head losses, hminor,
= 𝑉2
2𝑔∗(Kentrance+ Kvalve+ 2Kbend+ Kexit) (7)
Using Equation 7,
= 𝑉2
2𝑔∗[(0.5+ f* Lev
Dv +2*f∗ 𝐿𝑒𝑏
𝐷𝑏+ 1)]
For a gate valve, f*Lev
Dv= 0.019* 8
For the two elbows, 2*f ∗𝐿𝑒𝑏
𝐷𝑏 = 2*0.019* 30
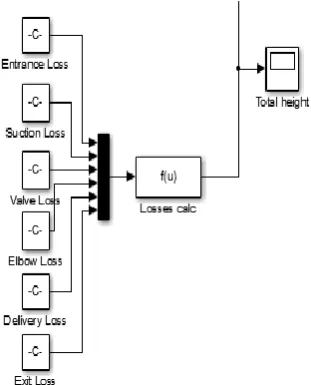
Total minor losses = 0.0232+0.0446+0.0838+0.0147 These values were entered into the MatLab Simulink model (Figure 4) to achieve optimum results.
[image:3.595.301.505.172.428.2] [image:3.595.349.505.505.698.2]Figure 4: Amalgamated Simulink for entire hybrid plant
Three parameters were used for controls‟ design; time, volume of water available and power available to pump water during pumping mode. Figure 5 is a flowchart designed using Flowcode V5 to model time allocation in the operation of the plant, equally generating codes based on allocated time of plant operation.
Proteus ISIS was used to design controls, based on available volume in both reservoir II and III. For example, it might be the pumping time from reservoir II to III based on the flow code programme as seen in Figure 6, where power available for pumping was low;
Proteus over-rode Flowcode. If reservoir III was full, a sensor attached to the top floater as seen in Figures 7 and 8 would also override the decision to avoid overflow in III. The two floaters controlled water volume in reservoir III, received from II and also generated extra power at peak time. If the volume in reservoir III was low at PSH generation, Proteus would also override the Flowcode decision with the aid of a sensor attached to a bottom floater. This software modelled the plant‟s entire control system.
Figure 5. Flowcode V5 flow control chart.
IV. RESULTS
[image:4.595.58.285.51.235.2]Results from MATLAB Simulink showed in Figure 4 that the while 300 kW is obtainable from the runoff river plant, 150.668 kW is require to lift water to a height of 10 m. At the same height of 10m, 139.457 kW is obtainable from the pumped storage plant, see Figure 5. Figure 6 illustrates the Proteus control diagram, showing the operations of the pump, turbine and the two floater that control water level in the upper reservoir during both pumping and generation modes.
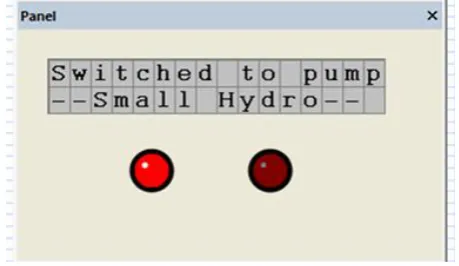
[image:4.595.53.505.526.767.2]Figure 7: Display when the pump is on and the PSH off.
V. CONCLUSION
From the result and discussion above, the proposed model is able to store energy at off peak hours which is released of peak hours when the price and demand is on the high side. The recovered stored energy is also worth the investment and effort. The control system was able to prevent overflow at pumping mode likewise prevent dirt from escaping into the turbine as water level in the upper reservoir reduces. This automation device also provides monitoring of the system operation with the LED indicator as shown in Figure 7. This indicators will show the operator which activity is taking place per time, either pump or generation from the pumped storage plant. This project can be handled easily by private investors with little and simple operational supervision and maintenance.
REFERENCES
[1] Balat, H., A renewable perspective for sustainable energy development in Turkey: The case of small hydropower plants. Renewable and Sustainable Energy Reviews, 2007. 11(9): p. 2152-2165.
[2] Billinton, R. and R. Karki, Maintaining supply reliability of small isolated power healthy marginal systems using renewable energy. IEE Proc.-Gener. Transin. Distribution, 2001. 148( 6): p. 503-534.
[3] IEA, Key World Energy Statistics. 2012. International Energy Agency, 9, rue de la Fédération 75739 Paris Cedex 15: p. 5-60.
[4] Kusakana, K., A survey of innovative technologies increasing the viability of micro-hydropower as a cost effective rural electrification option in South Africa. Renewable and Sustainable Energy Reviews, 2014. 37(0): p. 370-379.
[5] Research Channel, South Africa's Electricity Industry 2010. Report compiled by the Research unit of Creamer's Media (Pty) Ltd, Johannesburg based on information form Engineering News and Mining Wekly reports., 2010: p. 1-38.
[6] Laghari, J.A., et al., A comprehensive overview of new designs in the hydraulic, electrical equipments and controllers of mini hydro power plants making it cost effective technology. Renewable and Sustainable Energy Reviews, 2013, p. 279-293.
[7] Punys, P. and B. Pelikan, Review of small hydropower in the new Member States and Candidate Countries in the
context of the enlarged European Union. Renewable and Sustainable Energy Reviews, 2007. 11(7): p. 1321-1360. [8] Shi, Q. and X. Lai, Identifying the underpin of green
and low carbon technology innovation research: A literature review from 1994 to 2010. Technological Forecasting and Social Change, 2013. 80(5): p. 839-864.
[9] Koo, C., H. Kim, and T. Hong, Framework for the analysis of the low-carbon scenario 2020 to achieve the national carbon Emissions reduction target: Focused on educational facilities. Energy Policy, 2014. 73(0): p. 356-367.
[10] Joy, J., E.A. Jasmin, and V.R. John, Challenges of Smart Grid. International Journal of Advanced Research in Electrical, Electronics and Instrumentation Engineering, 2013.2(3): p. 976-981.
[11] Schoenung, S.M. and W.V. Hassenzahl, Long vs. Short-term energy storage technologies analysis—a life-cycle cost study. 2003.
[12] Sims, R.E.H., et al., Energy supply. In Climate Change 2007: Mitigation. 2007, Cambridge University Press, Cambridge: United Kingdom and New York, NY, USA. p. 252-293.
[13] Andaroodi, M., Standardization of civil engineering works of small high-head hydropower plants and development of an optimization tool. Thesis, École Polytechnique Federale de Lausanne, 2006.
[14] Paish, O., Small hydro power: technology and current status. Renewable and Sustainable Energy Reviews, 2002. 6: p. 537–556.
[15] Libya, Hydropower Resource Assessment of Africa. Ministerial Conference on Water for Agriculture and Energy in Africa:The challenges of climate change, 2008: p. 7-34.
[16] Bekele, G. and G. Tadesse, Feasibility study of small Hydro/PV/Wind hybrid system for off-grid rural electrification in Ethiopia. Applied Energy, 2012. 97(0): p. 5-15.
[17] De Marchis, M., et al., Energy Recovery in Water Distribution Networks. Implementation of Pumps as Turbine in a Dynamic Numerical Model. Procedia Engineering, 2014. 70: p. 439-448.
[18] Kucukali, S. and K. Baris, Assessment of small hydropower (SHP) development in Turkey: Laws, regulations and EU policy perspective. Energy Policy, 2009. 37(10): p. 3872-3879.
[19] Ohunakin, O.S., S.J. Ojolo, and O.O. Ajayi, Small hydropower (SHP) development in Nigeria: An assessment. Renewable and Sustainable Energy Reviews, 2011. 15(4): p. 2006-2013.
[20] Katsaprakakis, D., et al., Pumped storage systems introduction in isolated power production systems. Renewable Energy 2008. 33: p. 467–490.
[21] David, F., Hydro Potential, Pumped Storage and Hydro-Specific Issues. Contribution to the seminar «frontiers in energy research», 2012.
[22] ESKOM, Homeflex: Time-of-use (TOU) tariff, D.o. Energy, Editor 2011: Pretoria, South africa. p. 1-49. [23] Sivakumar, N., et al., Status of pumped hydro-storage
[24] Hessami, M. and D.R. Bowly, Economic feasibility and optimisation of an energy storage system for Portland Wind Farm (Victoria, Australia). Applied Energy 2011. 88: p. 2755–2763.
[25] Louwinger, F., Case study of Ingula and Lima Pumped Storage Schemes. Energize, 2008. Generation: Hydropower plants (May, 2008 edition): p. 40-44. [26] ESKOM, Pumped Storage Hydroelectric schemes and
water transfer. Generation Communication HY 0001 Revision 3 2010.
[27] Rehman, S., L.M. Al-Hadhrami, and M.M. Alam, Pumped hydro energy storage system: A technological review. Renewable and Sustainable Energy Reviews, 2015. 44(0): p. 586-598.
[28] Munoz-Hernandez G. A and J.D. I., Modelling, simulation and control of a hydroelectric pumped Storage power station. Control, 2004.