Question Difficulty Estimation in Community Question Answering Services
∗Jing Liu† Quan Wang‡ Chin-Yew Lin♯ Hsiao-Wuen Hon♯ †Harbin Institute of Technology, Harbin 150001, P.R.China
‡Peking University, Beijing 100871, P.R.China ♯Microsoft Research Asia, Beijing 100080, P.R.China
[email protected] [email protected] {cyl,hon}@microsoft.com
Abstract
In this paper, we address the problem of estimating question difficulty in community question answering services. We propose a competition-based model for estimating ques-tion difficulty by leveraging pairwise compar-isons between questions and users. Our ex-perimental results show that our model sig-nificantly outperforms a PageRank-based ap-proach. Most importantly, our analysis shows that the text of question descriptions reflects the question difficulty. This implies the pos-sibility of predicting question difficulty from the text of question descriptions.
1 Introduction
In recent years, community question answering (C-QA) services such as Stackoverflow1 and Yahoo! Answers2 have seen rapid growth. A great deal of research effort has been conducted on CQA, in-cluding: (1) question search (Xue et al., 2008; Du-an et al., 2008; SuryDu-anto et al., 2009; Zhou et al., 2011; Cao et al., 2010; Zhang et al., 2012; Ji et al., 2012); (2) answer quality estimation (Jeon et al., 2006; Agichtein et al., 2008; Bian et al., 2009; Liu et al., 2008); (3) user expertise estimation (Jurczyk and Agichtein, 2007; Zhang et al., 2007; Bouguessa et al., 2008; Pal and Konstan, 2010; Liu et al., 2011); and (4) question routing (Zhou et al., 2009; Li and King, 2010; Li et al., 2011).
∗This work was done when Jing Liu and Quan Wang were
visiting students at Microsoft Research Asia. Quan Wang is currently affiliated with Institute of Information Engineering, Chinese Academy of Sciences.
1http://stackoverflow.com 2
http://answers.yahoo.com
However, less attention has been paid toquestion difficulty estimationin CQA. Question difficulty es-timation can benefit many applications: (1) Experts are usually under time constraints. We do not want to bore experts by routing every question (including both easy and hard ones) to them. Assigning ques-tions to experts by matching question difficulty with expertise level, not just question topic, will make better use of the experts’ time and expertise (Ack-erman and McDonald, 1996). (2) Nam et al. (2009) found that winning the point awards offered by the reputation system is a driving factor in user partici-pation in CQA. Question difficulty estimation would be helpful in designing a better incentive mechanis-m by assigning higher point awards to mechanis-more diffi-cult questions. (3) Question diffidiffi-culty estimation can help analyze user behavior in CQA, since users may make strategic choices when encountering questions of different difficulty levels.
To the best of our knowledge, not much research has been conducted on the problem of estimating question difficulty in CQA. The most relevant work is a PageRank-based approach proposed by Yang et al. (2008) to estimate task difficulty in crowdsourc-ing contest services. Their key idea is to construct a graph of tasks: creating an edge from a taskt1 to a taskt2 when a useru wins taskt1 but loses task
t2, implying that taskt2 is likely to be more
diffi-cult than taskt1. Then the standard PageRank
al-gorithm is employed on the task graph to estimate PageRank score (i.e., difficulty score) of each task. This approach implicitly assumes that task difficulty is the only factor affecting the outcomes of competi-tions (i.e. the best answer). However, the outcomes of competitions depend on both the difficulty levels of tasks and the expertise levels of competitors (i.e.
other answerers).
Inspired by Liu et al. (2011), we propose a competition-based approach which jointly models question difficulty and user expertise level. Our ap-proach is based on two intuitive assumptions: (1) given a question answering thread, the difficulty s-core of the question is higher than the expertise ss-core of the asker, but lower than that of the best answerer; (2) the expertise score of the best answerer is higher than that of the asker as well as all other answer-ers. Given the two assumptions, we can determine the question difficulty score and user expertise score through pairwise comparisons between (1) a ques-tion and an asker, (2) a quesques-tion and a best answerer, (3) a best answerer and an asker, and (4) a best an-swerer and all other non-best anan-swerers.
The main contributions of this paper are:
•We propose a competition-based approach to es-timate question difficulty (Sec. 2). Our model signif-icantly outperforms the PageRank-based approach (Yang et al., 2008) for estimating question difficulty on the data of Stack Overflow (Sec. 3.2).
•Additionally, we calibrate question difficulty s-cores across two CQA services to verify the effec-tiveness of our model (Sec. 3.3).
•Most importantly, we demonstrate that different words or tags in the question descriptions indicate question difficulty levels. This implies the possibil-ity of predicting question difficulty purely from the text of question descriptions (Sec. 3.4).
2 Competition based Question Difficulty Estimation
CQA is a virtual community where people can ask questions and seek opinions from others. Formally, when an asker ua posts a questionq, there will be
several answerers to answer her question. One an-swer among the received ones will be selected as the best answer by the askerua or voted by the
com-munity. The user who provides the best answer is called the best answererub, and we denote the set of
all non-best answerers asS ={uo1,· · ·, uoM}.
As-suming that question difficulty scores and user ex-pertise scores are expressed on the same scale, we make the following two assumptions:
•The difficulty score of questionqis higher than the expertise score of askerua, but lower than that
of the best answererub. This is intuitive since the
best answerub correctly responds to questionqthat
askeruadoes not know.
•The expertise score of the best answerer ub is
higher than that of askerua and all answerers inS.
This is straightforward since the best answerer ub
solves questionq better than askerua and all
non-best answerers inS.
Let’s view question q as a pseudo useruq.
Tak-ing a competitive viewpoint, each pairwise compar-ison can be viewed as a two-player competition with one winner and one loser, including (1) one compe-tition between pseudo useruqand askerua, (2) one
competition between pseudo user uq and the best
answererub, (3) one competition between the best
answererub and askerua, and (4)|S|competitions
between the best answererub and all non-best
an-swers inS. Additionally, pseudo user uq wins the
first competition and the best answererub wins all
remaining(|S|+ 2)competitions.
Hence, the problem of estimating the question d-ifficulty score (and the user expertise score) is cast as a problem of learning the relative skills of play-ers from the win-loss results of the generated two-player competitions. Formally, letQdenote the set of all questions in one category (or topic), andRq
de-note the set of all two-player competitions generated from questionq ∈Q, i.e.,Rq ={(ua≺uq),(uq ≺
ub),(ua ≺ ub),(uo1 ≺ ub),· · ·,(uo|S| ≺ ub)},
wherej ≺ i means that user ibeats user j in the competition. Define
R= ∪ q∈Q
Rq (1)
as the set of all two-player competitions. Our prob-lem is then to learn the relative skills of players from
R. The learned skills of the pseudo question users are question difficulty scores, and the learned skills of all other users are their expertise scores.
TrueSkill In this paper, we follow (Liu et al.,
2011) and apply TrueSkill to learn the relative skill-s of playerskill-s from the skill-set of generated competitionskill-s
R (Equ. 1). TrueSkill (Herbrich et al., 2007) is a Bayesian skill rating model that is developed for es-timating the relative skill levels of players in games. In this paper, we present a two-player version of TrueSkill with no-draw.
distribu-tionN(µ, σ2), where µmeans the skill level of the
player andσmeans the uncertainty of the estimated skill level. Basically, TrueSkill learns the skill lev-els of players by leveraging Bayes’ theorem. Giv-en the currGiv-ent estimated skill levels of two players (priori probability) and the outcome of a new game between them (likelihood), TrueSkill model updates its estimation of player skill levels (posterior prob-ability). TrueSkill updates the skill levelµand the uncertaintyσintuitively: (a) if the outcome of a new competition is expected, i.e. the player with higher skill level wins the game, it will cause small updates in skill levelµand uncertaintyσ; (b) if the outcome of a new competition is unexpected, i.e. the player with lower skill level wins the game, it will cause large updates in skill levelµand uncertaintyσ. Ac-cording to these intuitions, the equations to update the skill levelµand uncertaintyσare as follows:
µwinner=µwinner+
σ2winner
c ·v (
t c,
ε c )
, (2)
µloser=µloser−
σ2loser c ·v
(
t c,
ε c
)
, (3)
σwinner2 =σwinner2 ·
[
1−σ
2
winner
c2 ·w
(
t c,
ε c
)]
,
(4)
σ2loser=σ2loser·
[
1− σ
2
loser
c2 ·w
(
t c,
ε c
)]
, (5)
where t = µwinner − µloser and c2 = 2β2 +
σwinner2 +σloser2 . Here,εis a parameter representing the probability of a draw in one game, and v(t, ε)
and w(t, ε) are weighting factors for skill level µ
and standard deviationσ respectively. Please refer to (Herbrich et al., 2007) for more details. In this paper, we set the initial values of the skill level µ
and the standard deviationσof each player the same as the default values used in (Herbrich et al., 2007).
3 Experiments
3.1 Data Set
In this paper, we use Stack Overflow (SO) for our experiments. We obtained a publicly available da-ta set3 of SO between July 31, 2008 and August 1,
2012. SO contains questions with various topics, such as programming, mathematics, and English. In this paper, we use SO C++ programming (SO/CPP)
3
http://blog.stackoverflow.com/category/ cc-wiki-dump/
and mathematics4(SO/Math) questions for our main experiments. Additionally, we use the data of Math Overflow5 (MO) for calibrating question difficulty scores across communities (Sec. 3.3). The statistics of these data sets are shown in Table 1.
SO/CPP SO/Math MO
# of questions 122,012 51,174 27,333
# of answers 357,632 94,488 65,966
[image:3.612.75.300.308.537.2]# of users 67,819 16,961 12,064
Table 1: The statistics of the data sets.
To evaluate the effectiveness of our proposed model for estimating question difficulty scores, we randomly sampled 300 question pairs from both SO/CPP and SO/Math, and we asked experts to compare the difficulty of every pair. We had two graduate students majoring in computer science an-notate the SO/CPP question pairs, and two gradu-ate students majoring in mathematics annotgradu-ate the SO/Math question pairs. When annotating each question pair, only the titles, descriptions, and tags of the questions were shown, and other information (e.g. users, answers, etc.) was excluded. Given each pair of questions (q1 and q2), the annotators were
asked to give one of four labels: (1)q1 ≻q2, which
means that the difficulty ofq1 was higher than q2; (2)q1 ≺ q2, which means that the difficulty of q1
was lower than q2; (3)q1 = q2, which means that
the difficulty ofq1 was equal to q2; (4) Unknown, which means that the annotator could not make a decision. The agreements between annotators on both SO/CPP (kappa value = 0.741) and SO/Math (kappa value= 0.873) were substantial. When eval-uating models, we only kept the pairs that annotators had given the same labels. There were260SO/CPP question pairs and280SO/Math question pairs re-maining.
3.2 Accuracy of Question Difficulty Estimation
We employ a standard evaluation metric for infor-mation retrieval: accuracy (Acc), defined as follows:
Acc= the number of correct pairwise comparisons
the total number of pairwise comparisons .
We use the PageRank-based approach proposed by Yang et al. (2008) as a baseline. As described in
4http://math.stackexchange.com 5
[image:4.612.100.271.54.154.2]
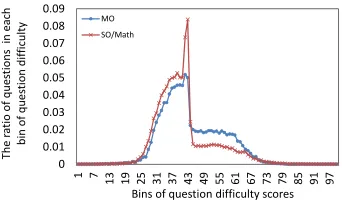
! "!#
Figure 1: The distributions of calibrated question d-ifficulty scores of MO and SO/Math.
Sec. 1, this is the most relevant method for our prob-lem. Table 2 gives the accuracy of the baseline and our Competition-based approach on SO/CPP and SO/Math. From the results, we can see that (1) the proposed Competition-based approach significant-ly outperformed the PageRank-based approach on both data sets; (2) PageRank-based approach only achieved a similar performance as randomly guess-ing. This is because thePageRank-based approach only models the outcomes of competitions affected by question difficulty. However, the outcomes of competitions depend on both the question difficulty levels and the expertise levels of competitors. Our Competition-based approach considers both these factors for modeling the competitions. The exper-imental results demonstrate the advantage of our ap-proach.
Acc@SO/CPP Acc@SO/Math
PageRank 50.38% 48.93%
Competition 66.54% 71.79%
Table 2: Accuracy on SO/CPP and SO/Math.
3.3 Calibrating Question Difficulty across
CQA Services
Both MO and SO/Math are CQA services for asking mathematics questions. However, these two services are designed for different audiences, and they have different types of questions. MO’s primary goal is asking and answering research level mathemat-ics questions6. In contrast, SO/Math is for people studying mathematics at any level in related field-s7. Usually, the community members in MO are not interested in basic mathematics questions. If
6
http://mathoverflow.net/faq
7
http://area51.stackexchange.com/ proposals/3355/mathematics
a posted question is too elementary, someone will suggest moving it to SO/Math. Similarly, if a post-ed question is advancpost-ed, the community members in SO/Math will recommend moving it to MO. Hence, it is expected that the ratio of difficult questions in MO is higher than SO/Math. In this section, we ex-amine whether our competition-based model can i-dentify such differences.
We first calibrate the estimated question difficul-ty scores across these two services on a same scale. The key idea is to link the users who participate in both services. In both MO and SO/Math, users can specify their home pages. We assume that if a us-eru1 on MO and a user u2 on SO/Math have the
same home page URL, they should be linked as one natural person in the real world. We successfully linked633users. They provided18,196answers in SO/Math among which 10,993 (60.41%) were se-lected as the best answers. In contrast, they provided
8,044answers in MO among which3,215(39.97%) were selected as the best answers. This shows that these users reflect more competitive contests in MO. After the common users are linked, we have a joint data set of MO and SO/Math. Then, we can calibrate the estimated question difficulty scores across the two services by performing the competition-based model on the joint data set. Figure 1 shows the dis-tributions of the calibrated question difficulty scores of MO and SO/Math on the same scale. As expect-ed, we observed that the ratio of difficult question-s in MO waquestion-s higher than SO/Math. Additionally, these two distributions were significantly differen-t (Kolmogorov-Smirnov Tesdifferen-t, p-value<0.05). This demonstrates that our competition-based model suc-cessfully identified the difference between questions on two CQA services.
3.4 Analysis on the Question Descriptions
In this section, we analyze the text of question de-scriptions on the scale of question difficulty scores estimated by the competition model.
Micro LevelWe first examine the frequency
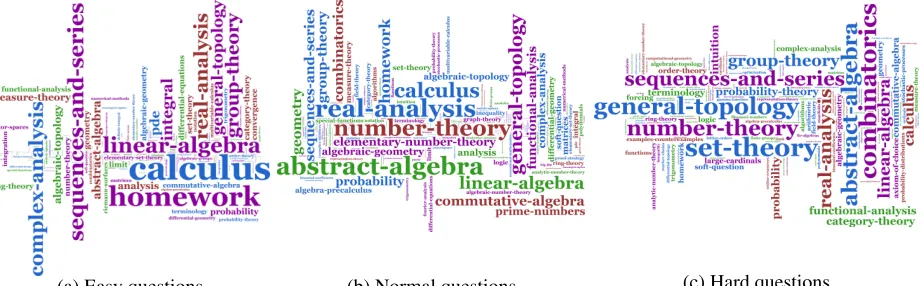
(a) Easy questions (b) Normal questions (c) Hard questions
Figure 2: Tag clouds on SO/Math questions with different difficulty levels
!"#" #
$ %""
Figure 3: The frequency distributions of words on the scale of question difficulty scores (SO/CPP).
to basic concepts in programming language, while ’virtual’and’gcc’are related to more advanced top-ics. It can be observed that the order of the means of the difficulty scores of these words are well aligned to our learning process.
Macro LevelWe evenly split the range of
ques-tion difficulty scores intonbuckets, and we grouped the questions into thenbuckets according to which bucket their difficulty scores were in. Then, we had
nquestion buckets and each bucket corresponded to a word distribution of questions. Let variableX de-note the distance between the difficulty scores in two question buckets (which is the difference between the average difficulty scores of questions in the two buckets), and variableY denote the Jensen-Shannon distance between word distributions in two question buckets. We examined the correlation between vari-able X and variable Y. The experimental results showed that the correlation between these two vari-ables were strongly positive. Specifically, the cor-relation coefficient on SO/CPP was0.8129and on SO/Math was0.7412. In other words, when the dis-tance between the difficulty scores of two buckets become larger, the two word distributions in the two buckets become less similar, and vice versa.
We further visualized the word distribution in each question bucket. We set n as 3, and we had three question buckets: (1) easy questions; (2) nor-mal questions; and (3) hard questions. Figure 3.4 plots the tag clouds of SO/Math questions in the three buckets. The size of tags is proportional to the frequency of tags in each bucket. We observed that (1) the tag’homework’and’calculus’become s-maller from easy questions to hard questions; (2) the tag’set-theory’becomes larger. These observations also reflect our learning process.
The above experimental results show that differ-ent words or tags of question descriptions reflect the question difficulty levels. This implies the possibil-ity of predicting question difficulty purely from the text of question descriptions.
4 Conclusion and Future Work
In this paper, we address the problem of estimating question difficulty in CQA services. Our proposed competition-based model for estimating question difficulty significantly outperforms the PageRank-based approach. Most importantly, our analysis shows that the text of question descriptions reflect-s the quereflect-stion difficulty. In the future, we would like to explore predicting question difficulty from the text of question descriptions. We also will inves-tigate non-technical areas, where there might be no strongly distinct notion of experts and non-experts.
Acknowledgments
References
M.S. Ackerman and D.W. McDonald. 1996. Answer garden 2: merging organizational memory with col-laborative help. InProceedings of CSCW.
E. Agichtein, C. Castillo, D. Donato, A. Gionis, and G. Mishne. 2008. Finding high-quality content in so-cial media. InProceedings of WSDM.
J. Bian, Y. Liu, D. Zhou, E. Agichtein, and H. Zha. 2009. Learning to recognize reliable users and content in so-cial media with coupled mutual reinforcement. In Pro-ceedings of WWW.
M. Bouguessa, B. Dumoulin, and S. Wang. 2008. Iden-tifying authoritative actors in question-answering fo-rums: the case of yahoo! answers. InProceeding of SIGKDD.
Xin Cao, Gao Cong, Bin Cui, and Christian S Jensen. 2010. A generalized framework of exploring category information for question retrieval in community ques-tion answer archives. InProceedings of WWW. H. Duan, Y. Cao, C.Y. Lin, and Y. Yu. 2008. Searching
questions by identifying question topic and question focus. InProceedings of ACL.
R. Herbrich, T. Minka, and T. Graepel. 2007. Trueskil-l: A bayesian skill rating system. InProceedings of NIPS.
J. Jeon, W.B. Croft, J.H. Lee, and S. Park. 2006. A framework to predict the quality of answers with non-textual features. InProceedings of SIGIR.
Zongcheng Ji, Fei Xu, Bin Wang, and Ben He. 2012. Question-answer topic model for question retrieval in community question answering. In Proceedings of CIKM.
P. Jurczyk and E. Agichtein. 2007. Discovering au-thorities in question answer communities by using link analysis. InProceedings of CIKM.
B. Li and I. King. 2010. Routing questions to appropriate answerers in community question answering services. InProceedings of CIKM.
B. Li, I. King, and M.R. Lyu. 2011. Question routing in community question answering: putting category in its place. InProceedings of CIKM.
Y. Liu, J. Bian, and E. Agichtein. 2008. Predicting in-formation seeker satisfaction in community question answering. InProceedings of SIGIR.
J. Liu, Y.I. Song, and C.Y. Lin. 2011. Competition-based user expertise score estimation. InProceedings of SI-GIR.
K.K. Nam, M.S. Ackerman, and L.A. Adamic. 2009. Questions in, knowledge in?: a study of naver’s ques-tion answering community. InProceedings of CHI. A. Pal and J.A. Konstan. 2010. Expert identification in
community question answering: exploring question s-election bias. InProceedings of CIKM.
M.A. Suryanto, E.P. Lim, A. Sun, and R.H.L. Chiang. 2009. Quality-aware collaborative question answer-ing: methods and evaluation. InProceedings of WSD-M.
Xiaobing Xue, Jiwoon Jeon, and W Bruce Croft. 2008. Retrieval models for question and answer archives. In Proceedings of SIGIR.
Jiang Yang, Lada Adamic, and Mark Ackerman. 2008. Competing to share expertise: the taskcn knowledge sharing community. InProceedings of ICWSM. J. Zhang, M.S. Ackerman, and L. Adamic. 2007.
Ex-pertise networks in online communities: structure and algorithms. InProceedings of WWW.
Weinan Zhang, Zhaoyan Ming, Yu Zhang, Liqiang Nie, Ting Liu, and Tat-Seng Chua. 2012. The use of depen-dency relation graph to enhance the term weighting in question retrieval. InProceedings of COLING. Y. Zhou, G. Cong, B. Cui, C.S. Jensen, and J. Yao. 2009.
Routing questions to the right users in online commu-nities. InProceedings of ICDE.