Original Article
The transcriptome difference between vulnerable
and stable carotid atherosclerotic plaque
Tongxun Li1, Xiaoping Zhang2, Jinqian Zhang3, Rui Liu4, Chengxiong Gu1
Departments of 1Cardiothoracic Surgery, 2Beijing Institute of Heart, Lung and Blood Vessel Diseases, Beijing Anzhen Hospital, Capital Medical University, Beijing 100029, China; 3Department of Laboratory Medicine and Central Laboratories, Guangdong Second Provincial General Hospital, Guangzhou 510317, China; 4Department of Rehabilitation, Tangdu Hospital, Fourth Military Medical University, Xi’an 710038, Shaanxi, China
Received July 27, 2017; Accepted April 30, 2018; Epub September 15, 2018; Published September 30, 2018
Abstract: In recent years, the instability of atherosclerotic plaques is a hotspot of basic and clinical research. More-over, it is imperative necessary to accurately identify the vulnerable plaques, and give effectively intervention before acute cardiovascular events. In this work, the stability of atherosclerotic plaques and vulnerable plaques were col-lected and performed with next-generation of RNA-seq, then data were analyzed. We performed a transcriptome sequence analysis of the vulnerable and stable carotid atherosclerotic plaque by next generation sequencing (NGS)
using the Illumina Deep Sequencing technology. We obtained 5,473,799, 3,766,914, 7,713,565 qualified Illumina reads from three vulnerable carotid atherosclerotic plaque, or 5,598,305, 7,249,629, and 5,623,320 qualified
Illumina reads from stable carotid atherosclerotic plaque, respectively. Comparative trancriptome analysis differen-tially revealed 781 genes between vulnerable and stable carotid atherosclerotic plaque, 318 expression of genes was up-regulated and 363 expressions of genes were down-regulated. The volcano plot was used to further identify differential genes expression between the two groups. Cluster analysis was performed, and spearman correlation
coefficient was calculated and analyzed. Our work demonstrated differential transcriptomes between vulnerable
and stable carotid atherosclerotic plaque. Numbers of genes will serve as a promising resource for revealing the regulatory molecular mechanisms of expression associated with the pathophysiology and pathogenesis of
vulner-able atherosclerosis plaque, even their implications in the field of therapy.
Keywords: Atherosclerosis (AS), vulnerable plaque, next-generation sequencing (NGS), transcriptome
Introduction
Atherosclerosis (AS) is a risk factor for cardio-vascular disease, which is one of the most se- rious diseases to harm human health. In re- cent years, the instability of atherosclerotic plaques is a hotspot of basic and clinical re- search [1, 2]. However, it is imperative neces-sary to accurately identify the vulnerable pl- aques, and give effectively intervention befo- re acute cardiovascular events [3, 4]. In this work, the stability of atherosclerotic plaques and vulnerable plaques were collected and per-formed with next-generation of RNA-seq, then data were analyzed.
Carotid atherosclerotic disease represents a well-established cause of ischaemic stroke, accounting for up to 20% of strokes or transient
ischaemic attacks (TIA) [5]. Stroke constitutes a major cause of acquired disability in adults and the second most frequent cause of mortal-ity in developed nations [6]. Nevertheless, cur-rent research has concluded that plaque fea-tures other than degree of stenosis contribute to the occurrence of neurologic symptoms, jus-tifying the introduction of the term “vulnerable plaque” [7], responsible for almost half of stroke cases [8].
The plaque surface morphology is among th- ose features related to the risk for embolic stroke and characterising vulnerability. Based on this criterion, carotid plaques are typically
classified into smooth, irregular or ulcerated
[9, 10]. The presence of ulceration itself is a well-known feature of vulnerability with high
for neurologic symptoms. Beyond grading of stenosis with widely accepted velocity criteria [11].
Moreover, how mRNA expression regulation at translation level in vulnerable plaques remains unclear. This present study is to highlight the role of transcriptomes in the pathophysiology and pathogenesis of vulnerable plaques. Materials and methods
Patients and Specimens
Symptomatic group: The study consisted of three diagnosed with vulnerable carotid athero-sclerotic plaque by pathology companied with symptoms of cerebral ischemia, and diagnosed at vulnerable plaque.
Asymptomatic group: Three patients with sta-ble carotid atherosclerotic plaque with pathol-ogy were not acompanied with symptoms of cerebral ischemia.
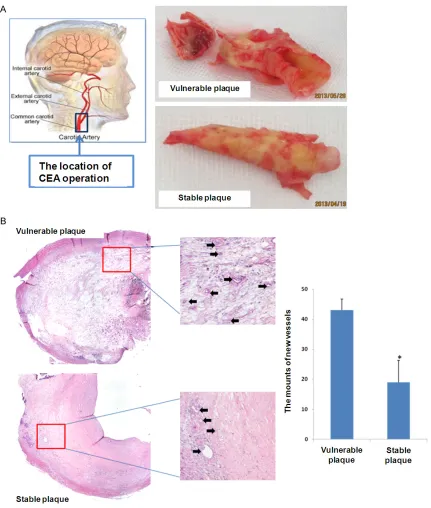
All included patients were referred to Beijing Anzhen Hospital, Capital Medical University from January, 2011 to December, 2016. Their all demographic features, or clinical and ca- rotid artery characteristic were documented and analyzed. All these patients were per-formed with carotid endarterectomy (CEA) (Figure 1A). At the operation day of CEA, the samples of plaque were collected and handled immediately.
This study and use of human specimens in this research were approved by the Ethics Com- mittee of Beijing Anzhen Hospital, Capital Me- dical University on the basis of the Declara-
tion of Helsinki. We clearly confirmed that
informed consents were obtained from all patients. We had record and document partici-pant consent in our hospital. And the ethics committees of our hospital had approved this consent procedure.
HE staining
HE staining was conducted according to routine
protocols. Briefly, after deparaffinization and
rehydration, 5 μm longitudinal sections were stained with hematoxylin solution for 5 min fol-lowed by 5 dips in 1% acid ethanol (1% HCl in 70% ethanol) and then rinsed in distilled water. Then the sections were stained with eosin
solu-tion for 3 min and followed by dehydrasolu-tion with graded alcohol and clearing in xylene. The mounted slides were then examined and ph-
otographed using an Olympus BX53 fluores -cence microscope (Tokyo, Japan). The staining intensity of the trabecular bone was analyzed by Image-Pro Plus 6.0 software and expressed
as IOD value.
Library preparation
Overview of RNA-Seq: The general steps to pre-pare a complementary DNA (cDNA) library for sequencing are described below, but often vary between platforms [12, 13].
RNA isolation: RNA is isolated from tissue and mixed with deoxyribonuclease (DNase). DNase reduces the amount of genomic DNA. The amount of RNA degradation is checked with gel and capillary electrophoresis and is used to assign an RNA integrity number to the sample. This RNA quality and the total amount of start-ing RNA are taken into consideration durstart-ing the subsequent library preparation, sequencing, and analysis steps.
RNA selection/depletion: To analyze signals of interest, the isolated RNA can either be kept
as is, filtered for RNA with 3’ polyadenylated
(poly(A)) tails to include only mRNA, depleted
ofribosomal RNA (rRNA), and/or filtered for RNA that binds specific sequences. The RNA with 3’
poly(A) tails are mature, processed, coding sequences. Poly(A) selection is performed by mixing RNA with poly(T) oligomers covalently attached to a substrate, typically magnetic beads [14, 15], and the website http://www. protocol-online.org/prot/Molecular_Biology/ RNA/RNA_Extraction/mRNA_Isolation/index.
html, which is the Protocol Online and provides
a list of several protocols relating to mRNA iso-lation Poly(A) selection ignores noncoding RNA
and introduces 3’ bias [16], which is avoided
with the ribosomal depletion strategy. The rRNA is removed because it represents over 90% of the RNA in a cell, which if kept would drown out other data in the transcriptome.
that are the appropriate length for the sequ- encing machine. The RNA, cDNA, or both are fragmented with enzymes, sonication, or
nebu-lizers. Fragmentation of the RNA reduces 5’
bias of randomly primed-reverse transcription
and the influence of primer binding sites [15], with the downside that the 5’ and 3’ ends are converted to DNA less efficiently. Fragmentation
[image:3.612.92.523.68.576.2]sequence lengths are selected. Because small RNAs like miRNAs are lost, these are analyzed independently. The cDNA for each experiment can be indexed with a hexamer or octamer bar-code, so that these experiments can be pooled into a single lane for multiplexed sequencing. Direct RNA sequencing
As converting RNA into cDNA using reverse transcriptase has been shown to introduce biases and artifacts that may interfere with
both the proper characterization and quantifi -cation of transcripts [17], single molecule Direct RNA Sequencing (DRSTM) technolo- gy was under development by Helicos (now bankrupt). DRSTM sequences RNA molecul- es directly in a massively-parallel manner with-out RNA conversion tocDNA or other biasing sample manipulations such as ligation and
amplification.
Transcriptome assembly
Two methods are used to assign raw sequence reads to genomic features (i.e., assemble the transcriptome):
De novo: This approach does not require a ref-erence genome to reconstruct the transcrip-tome, and is typically used if the genome is unknown, incomplete, or substantially altered compared to the reference [18]. Challenges when using short reads for de novo assembly include 1) determining which reads should be joined together into contiguous sequences
Metrics to assess the quality of a de novo assembly include median contig length, num-ber of contigs and N50 [22].
RNA-seq mapping of short reads in exon-exon
junctions. The final mRNA is sequenced,
whi-ch is missing the intronic sections of the pre-mRNA.
Genome guided: This approach relies on the same methods used for DNA alignment, with the additional complexity of aligning reads that cover non-continuous portions of the reference genome [23]. These non-continuous reads are the result of sequencing spliced transcripts. Typically, alignment algorithms have two ste- ps: 1) align short portions of the read (i.e., se- ed the genome), and 2) use dynamic
program-ming to find an optimal alignment, sometimes
in combination with known annotations. So- ftware tools that use genome-guided alignment include Bowtie [24], TopHat (which builds on BowTie results to align splice junctions) [25,
26], Subread [27], STAR [23], Sailfish [28],
Kallisto [29] and GMAP [30]. The quality of a genome guided assembly can be measured with both 1) de novo assembly metrics (e.g., N50) and 2) comparisons to known transcript, splice junction, genome, and protein sequenc-es using precision, recall, or their combination (e.g., F1 score) [22].
A note on assembly quality: The current con-sensus is that 1) assembly quality can vary depending on which metric is used, 2) assem-blies that scored well in one species do not nec-Table 1. Compared to the baseline clinical characteristics of
patients between the two groups
Symptomatic
group (n=13) Asymptomatic group (n=10) P value
Age (mean ± SD) 66.23±6.92 69.45±9.18 0.371
Sex (male/female) 7/2 10/2 0.134
BMI (Kg/m2) 25.5±0.62 24±0.73 0.382
SP (mmHg, mean ± SD) 147.14±12.38 138.34±11.26 0.263
DP (mmHg, mean ± SD) 81.29±10.57 78.38±12.08 0.367
TG (mmol/L) 1.42±0.43 1.37±0.51 0.886
CHO (mmol/L) 4.31±0.44 3.62±0.87 0.119
HDL (mmol/L) 1.05±0.59 1.01±0.63 0.675
LDL (mmol/L) 2.6±0.39 2.07±0.74 0.098
HCY (μmol/L) 11.21±0.64 22.64±0.18 0.033
Note: BMI, Body Mass Index; SP, systolic pressure; TG, triglyceride; CHO,
cholesterol; HDL, high density lipoprotein; LDL, low density lipoprotein; HCY, homocysteine.
(contigs), 2) robustness to sequenc-ing errors and other artifacts, and 3)
computational efficiency. The prima -ry algorithm used for de novo assem-bly transitioned from overlap graphs, which identify all pair-wise overlaps between reads, tode Bruijn graphs, which break reads into sequences of length k and collapse all k-mers into
a hash table. Overlap graphs were
used with Sanger sequencing, but do not scale well to the millions of reads generated with RNA-Seq. Examples of assemblers that use de Bruijn graphs are Velvet [19], Trinity
[18], Oases [20], and Bridger [21].
Paired end and long read sequenc-ing of the same sample can mitigate
the deficits in short read sequencing
[image:4.612.91.348.96.253.2]essarily perform well in the other species, and 3) combining different approaches might be the most reliable [31, 32].
Gene expression
Expression is quantified to study cellular chang -es in r-esponse to external stimuli, differenc-es between healthy and diseased states, and other research questions. Gene expression is often used as a proxy for protein abundance, but these are often not equivalent due to post transcriptional events such as RNA interfer-ence and nonsense-mediated decay [33].
Expression is quantified by counting the num -ber of reads that mapped to each locus in the transcriptome assembly step. Expression can
be quantified for exons or genes using contigs
or reference transcript annotations [12]. These observed RNA-Seq read counts have been robustly validated against older technologies, including expression microarrays and qPCR
[33, 34]. Tools that quantify counts are HTSeq [35], FeatureCounts [36], Rcount [37], max-counts [38], FIXSEQ [39], and Cuffquant. The read counts are then converted into appropri-ate metrics for hypothesis testing, regressions, and other analyses. Parameters for this conver-sion are:
Library size: Although sequencing depth is
pre-specified when conducting multiple RNA-Seq
experiments, it will still vary widely between experiments [40]. Therefore, the total number of reads generated in a single experiment (library size) is typically adjusted by converting counts to fragments, reads, or counts per mil-lion mapped reads (FPM, RPM, or CPM).
Gene length: Longer genes will have more fragments/reads/counts than shorter genes if transcript expression is the same. This is adjusted by dividing the FPM by the length of a gene, resulting in the metric fragments per kilo-base of transcript per million mapped reads (FPKM) [41].
Total sample RNA output: Because the same amount of RNA is extracted from each sample, samples with more total RNA will have less RNA per gene. These genes appear to have de- creased expression, resulting in false positives in downstream analyses [40].
Variance for each gene’s expression: is mod -eled to account for sampling error (important for genes with low read counts), increase power, and decrease false positives. Variance can be estimated as a normal, Poisson, or negative binomialdistribution [42-44].
Differential expression and absolute quantifi-cation of transcripts
RNA-Seq is generally used to compare gene expression between conditions, such as a drug
[image:5.612.91.524.98.192.2]treatment vs. non-treated, and find out which Table 2. Compared to the carotid arterial characteristics of patients determined by ultrasound be-tween the two groups
Symptomatic group
(n=13) Asymptomatic group (n=10) P value
Stroke history n (%) 13 (100) 0 (0) 0.000
Rate of carotid stenosis n (%) 10 (76.92) 7 (70.00) 0.064
Blood flow in the carotid artery (cm/s, mean ± SD) 378±23.34 296±31.08 0.297
Carotid artery diameter (cm, mean ± SD) 0.12±0.03 0.19±0.04 0.021*
Carotid plaque thickness(cm, mean ± SD) 0.53±0.08 0.43±0.09 0.918
[image:5.612.90.289.234.329.2]*P<0.05.
Table 3. The capacity of sequencing
Sample Read (#) Data (bp)
Vulnerable plaque 1 5,473,799 197,056,764 Vulnerable plaque 2 3,766,914 135,608,904 Vulnerable plaque 3 7,713,565 277,688,340 Stable plaque 1 5,598,305 201,538,980
Stable plaque 2 7,249,629 260,986,644
Stable plaque 3 5,623,320 202,439,520
Table 4. The quality of sequencing
Sample Q20 (%) Q30 (%)
Vulnerable plaque 1 99.17 97.55
Vulnerable plaque 2 99.31 97.82
Vulnerable plaque 3 99.55 98.24
Stable plaque 1 99.53 98.20
Stable plaque 2 99.09 97.41
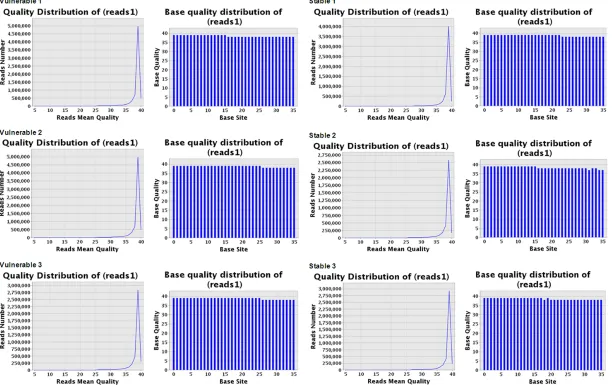
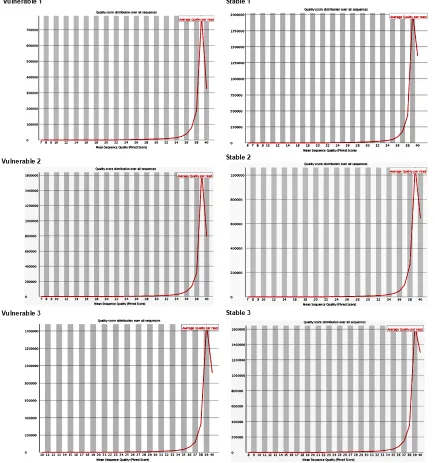
[image:5.612.92.289.361.455.2]Figure 2. Quality of sequencing. The statistical analysis demonstrated that the average quality of every sample was larger than 20, and indicated that the quality
genes are up- or down-regulated in each condi-tion. In principle, RNA-Seq will make it possible to account for all the transcripts in the cell for each condition. Differently expressed genes
can be identified using tools that count the
sequencing reads per gene and compare them between samples. Many packages are avail-able for this type of analysis [45]; some of the most commonly used tools are DESeq [46] and edger [44], packages from Bioconductor [47, 48]. Both these tools use a model based on the negative binomial distribution [44, 46].
It is not possible to do absolute quantification
using the common RNA-Seq pipeline, because it only provides RNA levels relative to all tran-scripts. If the total amount of RNA in the cell changes between conditions, relative normal-ization will misrepresent the changes for
indi-vidual transcripts. Absolute quantification of
mRNAs is possible by performing RNA-Seq with added spike ins, samples of RNA at known con-centrations. After sequencing, the read count of the spike ins sequences is used to determine the direct correspondence between read count and biological fragments [49, 50]. In develop-mental studies, this technique has been used in Xenopus tropicalis embryos at a high tempo-ral resolution, to determine transcription kinet-ics [51].
Coexpression networks
Coexpression networks are data-derived repre-sentations of genes behaving in a similar way across tissues and experimental conditions [52]. Their main purpose lies in hypothesis gen-eration and guilt-by-association approaches for inferring functions of previously unknown genes [53]. RNASeq data has been recently used to
infer genes involved in specific pathways based
on Pearson correlation, both in plants [54] and mammals [55]. The main advantage of RNASeq data in this kind of analysis over the microarray
based on RNA seq data. Co-expression mod-ules may corresponds to cell types or pathways. Highly connected intramodular hubs can be interpreted as representatives of their respec-tive module. Variance-Stabilizing Transforma- tion approaches for estimating correlation co-
efficients based on RNA seq data have been
proposed.
Statistical analysis
Welch t-test-paired was performed for com- parison of transcriptome difference between the two groups.False discovery rate (FDR) was used to evaluate the errors due to multiple comparisons. On the basis of the expression profiles, Hierarchical clustering of selected mRNAs was conducted using Ward’s agglom -eration method.
Results
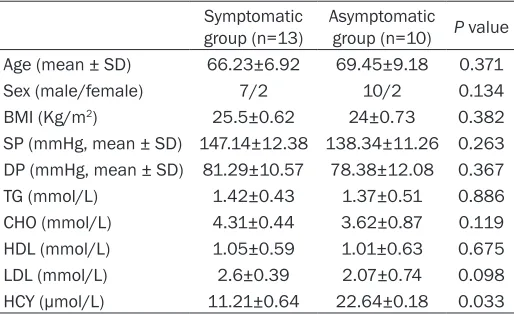
Compared to the baseline characteristics of patients in the two groups
The demographic and clinical features of patients in the two groups were compared,
including age, sex, BMI, SP, DP, TG, CHO, HDL, LDL, HCY. Moreover, it did not show significantly
different of these characteristics between symptomatic group with vulnerable plaque and asymptomatic group with stable plaque (Table 1). Furthermore, the carotid arterial character-istic of patients determined by ultrasound were
compared. Our results indicated that there
were stroke history in symptomatic group, and obviously more than asymptomatic patients (13 vs. 0; P=0.000). The carotid artery
diame-ter in asymptomatic group was significantly
lower than symptomatic group (0.12±0.03 vs. 0.19±0.04; P=0.021). But, there were not obvi-ously different of characteristics, including rate
of carotid stenosis, blood flow in the carotid
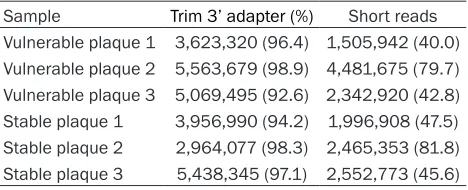
[image:7.612.91.325.84.179.2]artery, and carotid plaque thickness between Table 5. Data Pre-processing of NGS
Sample Trim 3’ adapter (%) Short reads
Vulnerable plaque 1 3,623,320 (96.4) 1,505,942 (40.0) Vulnerable plaque 2 5,563,679 (98.9) 4,481,675 (79.7) Vulnerable plaque 3 5,069,495 (92.6) 2,342,920 (42.8) Stable plaque 1 3,956,990 (94.2) 1,996,908 (47.5) Stable plaque 2 2,964,077 (98.3) 2,465,353 (81.8) Stable plaque 3 5,438,345 (97.1) 2,552,773 (45.6)
symptomatic group with vulnerable plaque and asymptomatic group with stable plaque (Table 2).
Morphological observation of plaques
The patients in this work were all performed with carotid endarterectomy (CEA) (Figure 1A). The typical plaque of vulnerable and stable were showed in Figure 1A. It demonstrated that the vulnerable plaque looks like fragile and
uncomplete. As shown in Figure 1B, HE stain-ing demonstrated that the amounts of new ves-sels in symptomatic patients with vulnerable plaque were much more than those in asymp-tomatic patients with stable plaque.
Capacity and quality of transcriptome se-quencing of plaques
We obtained 5,473,799, 3,766,914, 7,713,565
[image:8.612.91.526.77.540.2]qualified Illumina reads from three vulnerable Figure 3. Per sequence quality scores. We used fastq_quality_filter program to remove the reads of lower quality, so
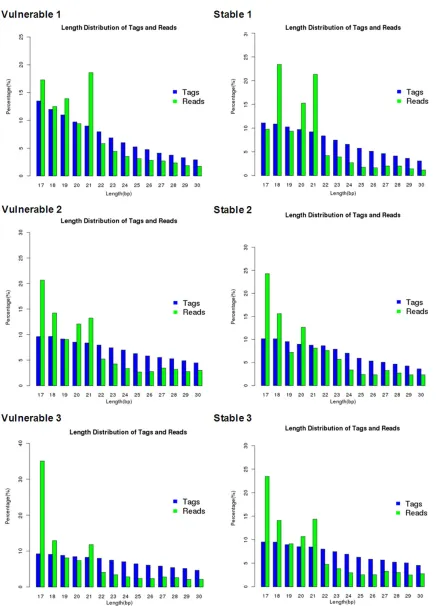
Figure 4. The length distribution of tags and reads. The cluster was performed to mark all identical sequences as
one tag. The results showed that the length of all the filtered mature transcriptome sequences distributed range
carotid atherosclerotic plaque, or 5,598,305,
7,249,629, and 5,623,320 qualified Illumina
reads from stable carotid atherosclerotic pla- que, respectively (Table 3). The statistical anal-ysis demonstrated that the average quality of every sample was larger than 20, and indicated
that the quality was very fine (Table 4 and Figure 2).
Pre-processing of NGS data of plaques
Firstly, the 3’-adapter sequence (AGATCGGA-AGAGCACACGTCT) was identified from raw data
of NGS (Table 5) by fastx_cliper program. Then
we used fastq_quality_filter program to remove
[image:10.612.87.518.64.576.2]the reads of lower quality, so that the short reads was obtained (Table 5) and the quality Figure 5. The sRNA length distribution. The length distribution of tags and reads were showed in Figure. The Figure
indicated that there was no significant difference in length distribution of tags and reads between vulnerable and
score of at least 95% base was not low than 20 (Figure 3). Then the cluster was performed to mark all identical sequences as one tag. The
results showed that the length of all the filtered
mature transcriptome sequences distributed range from 17-30 nt, and then sequences in the range was analyzed follow up (Figure 4). The length distribution of tags and reads were showed in Figure 5.
Sequencing data analysis of small RNA with rfam
All the marked tags were mapped onto se- quence of Homo sapiens genome in PubMed, by the match software bowtie 0.12.7. Table 6 displayed the mapped tags and reads comput-ed on account of 17~30 nt reads or tags. Figure 5 showed the genome-mapped rates of sam-ples. Then we used the database Rfam 11.0 of RNA family to analyse sundry RNAs in the samples.
Mirdeep analysis of transcriptome and differ-ent transcriptome between the two groups with edgeR
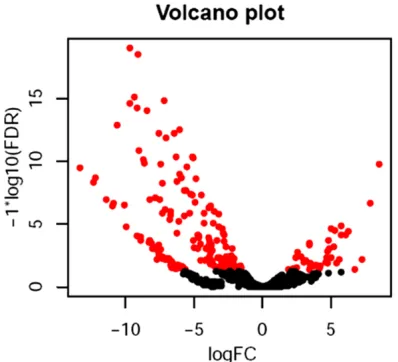
The Mirdeep (version 2) was utilized to forecast the transcriptome of these samples. The differ-ential transcriptome were analyzed with edgeR software for differential expression analysis (Table 7). Then the major different transcrip-tome between Vulnerable group and Stable control group were analyzed. Comparative tran-criptome analysis differentially revealed 781 genes between vulnerable and stable carotid atherosclerotic plaque, 318 expression of genes was up-regulated and 363 expressions of genes were down-regulated. The volcano plot was used to further identify differential tran-scriptome expression between the two groups (Figure 6). Moreover, the cluster analysis was
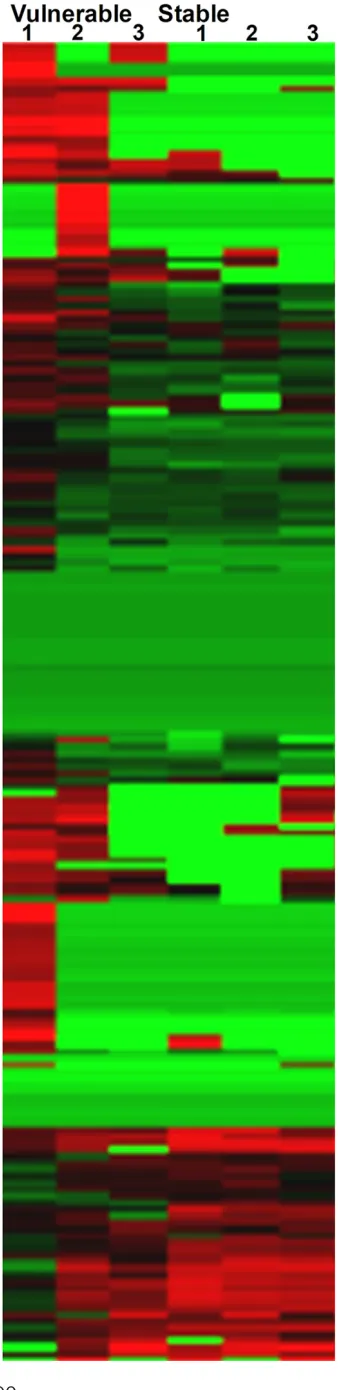
performed (Figure 7). Furthermore, the gene
ontology (GO) consortium and data was used to
analyze the targets gene of different transcrip-tome (Figure 8).
Discussion
The absolute quantification of next generation
sequencing (NGS) is just modestly accurate. The advance of high-throughput sequencing was driven by the high demand of low-cost sequencing, which is known as NGS. Thousan- ds of sequences concurrently manufactured in NGS process. In recent years, the computa-tional analysis of genome-wide scale is increas-ingly functioned as a backbone to facilitate more novel biomedical discovery. However, owing to the exponential increase of the quanti-ties of sequence data, the analysis bottleneck remains yet to be solved.
In this study, we performed a transcriptome sequencing analysis of the plasma transcrip-tome of vulnerable and stable plaque by NGS, using the Illumina Deep Sequencing tech- nology. We obtained 5,473,799, 3,766,914,
7,713,565 qualified Illumina reads from three
vulnerable carotid atherosclerotic plaque, or 5,598,305, 7,249,629 and 5,623,320
quali-fied Illumina reads from stable carotid athero -sclerotic plaque, respectively. The average quality of more than 99 percent of reads was larger than 20, indicative of good quality of these data. Then we used the fastx cliper pro-gram to perform data pre-processing of NGS, and removed the lower quality reads using
fastq quality filter program. Subsequently, clus -ter was carried out; the distribution of the le- ngth of mature transcriptome sequence rang- ed from 18-30 nt and mapped onto the se- quence of Homo sapiens genome. Then we used the Miranda software to predict the target Table 6. Genome mapped tags and reads
Sample Processed Reads Alignment (1 ≤ md ≤ 5) Failed Alignment suppressed
(md > 5)
Vulnerable plaque 1 4,363,223 2,449,906 (56.15) 440,633 (10.10) 1,472,684 (33.75)
Vulnerable plaque 2 3,731,781 2,042,342 (54.73) 337,887 (9.05) 1,351,552 (36.22)
Vulnerable plaque 3 2,202,752 1,405,721 (63.82) 245,822 (11.16) 551,209 (25.02)
Stable plaque 1 1,141,645 653,446 (57.24) 330,057 (28.91) 158,142 (13.85)
Stable plaque 2 3,045,532 2,229,938 (73.22) 414,763 (13.62) 400,831 (13.16)
Stable plaque 3 2,260,972 1,455,027 (64.35) 242,198 (10.71) 563,747 (13.16)
genes of transcriptome (score > 150, energy < -15).
Rfam is a database of RNA families, and known as a collection of multiple sequence alignments and covariance models.It is available on the US and the UK website. These websites can enable the users to probe a query sequence against the library of covariance models, and to browse family annotation and multiple sequence align-ments.The users could download the database
in flat file form and search locally by the INFERNAL package (http://infernal.wustl.edu/). Comparative transcriptome analysis revealed those 781 transcriptome differentially between vulnerable and stable carotid atherosclerotic plaque, including 318 expression of transcrip-tome was up-regulated and 363 expression of transcriptome were down-regulated. The volca-no plot was used to further identify differen- tial transcriptome expression between the two groups. Moreover, the cluster analysis was
per-formed, and the spearman correlation
coeffici-ent was calculated and analyzed. Furthermore,
the gene ontology (GO) consortium and data
[image:12.612.91.521.85.388.2]was used to analyze the targets gene of differ-ential transcriptome.
Figure 6. The volcano plot. The volcano plot was used to further identify differential transcriptome expres-sion between the two groups. The Figure indicated
that there was significant difference in transcriptome
[image:12.612.90.289.413.594.2]expression between vulnerable (red points) and sta-ble plaques (black points).
Table 7. The data of reads by Rfam analysis
Vulnerable 1 Vulnerable 2 Vulnerable 3 Stable 1 Stable 2 Stable 3
MiRNA 579912 6931 77782 76903 72272 115245
Misc_RNA 35382 3154 15126 29170 22500 6023
Protein_coding 36531 10850 56657 97571 77146 27970
Mt_tRNA 9148 92 2216 2223 1873 1164
rRNA 203083 41636 603626 874030 939094 81202
Mt_rRNA 1435 567 7832 16153 12048 806
snoRNA 88520 4091 74057 89938 63807 39126
Processed_transcript 48805 2199 36374 41951 31649 20100
Processed_pseudogene 2485 1250 9586 11155 9933 1800
lincRNA 3896 1107 5863 8388 6776 2448
snRNA 7313 725 7364 14921 10793 2352
Antisense 2519 477 3320 4763 3860 1219
Unprocessed_pseudogene 722 123 722 1307 913 247
Transcribed_unprocessed_pseudogene 231 83 407 775 538 165
TEC 207 63 184 443 295 152
Sense_intronic 336 33 279 419 306 117
Sense_overlapping 103 56 175 196 169 172
Transcribed_processed_pseudogene 85 51 275 445 332 64
Unitary_pseudogene 39 15 22 39 37 18
Known_ncrna 23 6 28 61 26 1
IG_C_gene 92 44 252 567 610 144
The edger software, an achievement of methol-ogy designed by Smyth and Robinson [58, 59], is a bio-conductor package for analysing differ-ential gene expression [60]. The software and methods can also be applied to emerging tech-nologies like RNA-seq [61, 62] to obtain digital expression data. Statistically, a volcano plot can quickly examine differences in large datas-ets consisted of replicate data [63]. It displays
fold-change and significance on the x- and
y-axes, respectively. It can combine a
measure-ment of statistical significance from a statisti -cal test (e.g., a p-value of ANOVA test) with the
magnitude of the change enabling quick visual
identification of those data-points (genes, etc.) that display statistically significant large-magni -tude changes.
Plenty of studies about transcriptome aber-rances primarily focused on the analysis of canonical, reference transcriptome, while iso- miRs required more advanced technologies, like NGS and laborious analysis of all the ac- quired data. Hence, our study employed NGS to acquire transcriptome data come from be- tween pediatric patients and healthy controls by next generation sequencing techniques. Numbers of transcriptome will be pivotal for revealing the molecular regulatory mechanisms of expression relevant to the pathogenesis and pathophysiology of vulnerable carotid athero-sclerotic plaque.
Vulnerable plagues have been defined as pre -cursors to lesions that rupture. However, coro-nary thrombosis may occur from other lesions
like plaque erosion and calcified nodules,
al-though to a lesser frequency than rupture.
Therefore, the definition of vulnerable plaque
should be all-inclusive. Using descriptive
termi-nology, the researches define the precursor lesion of plaque rupture as “thin-cap fibroath -eroma” (TCFA). Morphologically, TCFAs have a
necrotic core with an overlying thin fibrous
cap (< 65 mm) consisting of collagen type I,
which is infiltrated by macrophages. These
[image:13.612.105.274.57.752.2]lesions are most frequent in the coronary tree of patients dying with acme myocardial infarc-tion and least common in those with plaque erosion. TCFAs are more common in patients with high serum total cholesterol (TC) and a high TC to high density cholesterol ratio, in women > 50 years, and in those patients with Figure 7. The cluster analysis. The cluster analysis was performed. The Figure indicated that there was
elevated levels of high sensitivity C-reactive protein. TCFAs are mostly found in the proximal left anterior descending coronary arteries and less commonly in the proximal right or the
proxi-mal left circumflex coronary arteries. In TCFAs,
necrotic core length is ~ 2-17 mm (mean 8 mm) and the underlying cross-sectional luminal nar-rowing in over 75% of cases is < 75% (< 50% diameter stenosis). The area of the necrotic
core in at least 75% of cases is ≤ 3 mm2. Clinical
studies of TCFAs are limited as angiography and intravascular ultrasound (TVUS) catheters cannot precisely identify these lesions. Newer catheters and other techniques are at various
stages of development and will play a signifi -cant role in the understanding of plaque pro-gression and the development of symptomatic coronary artery disease [64].
In our work, the demographic and clinical fea-tures of patients in the two groups were
com-pared, including age, sex, BMI, SP, DP, TG, CHO,
HDL, LDL, HCY. Moreover, it did not show sig-
nificantly different of these characteristics
between symptomatic group with vulnerable
plaque and asymptomatic group with stable plaque. Furthermore, the carotid arterial char-acteristic of patients determined by ultrasou-
nd were compared. Our results indicated that
there were stroke history in symptomatic gro- up, and obviously more than asymptomatic patients. The carotid artery diameter in
asymp-tomatic group was significantly lower than
symptomatic group (0.12±0.03 vs. 0.19±0.04; P=0.021) (Table 2).
In our study, all patients received CEA opera-tion. The typical plaque of vulnerable and sta-ble were showed in Figure 1A. t demonstrated that the vulnerable plaque looks like fragile and uncomplete. As shown in Figure 1B, HE stain-ing demonstrated that the amounts of new ves-sels in symptomatic patients with vulnerable plaque were much more than those in asymp-tomatic patients with stable plaque.
[image:14.612.95.524.73.358.2]Ischemic strokes and transient ischemic at- tacks (TIAs) are frequently caused by cerebr- al embolism from an atherothrombotic plaque or thrombosis at the site of plaque rupture. Figure 8. The gene ontology (GO) consortium and data. The gene ontology (GO) consortium and data was used to analyze the targets gene of different transcriptome. The Figure indicated that there was significant expression
Although the degree of lumen obstruction is a relevant marker of the risk of stroke, the recog-nition of the role of the vulnerable plaque has
opened new avenues in the field of athero -thrombotic stroke. The vulnerability is dictated in part by plaque morphology, which, in turn, is
influenced by pathophysiologic mechanisms
at the cellular and molecular level. A multimod-al assessment of plaque vulnerability involv- ing the combination of systemic markers,
new imaging methods that target
inflamma-tory and thrombotic components, and the potential of emerging therapies may lead to a
new stratification system for atherothrombotic
risk and to a better prevention of atherothrom-botic stroke [65].
In conclusion, our work demonstrated differen-tial transcriptomes between vulnerable and stable carotid atherosclerotic plaque. Numb- ers of genes will serve as a promising resource for revealing the regulatory molecular mecha-nisms of expression associated with the patho-physiology and pathogenesis of vulnerable ath-erosclerosis plaque, even their implications in
the field of therapy. Limitations
The major limitation was the small samples due to the complicated technical and expensive costs, which might introduce certain bias. The expression levels of transcriptome will be de- tected between vulnerable and stable carotid atherosclerotic plaque basing on the results of this research later.
Acknowledgements
This work was supported by grants from Na- tional Natural Science Foundation of China (No. 30600524, No. 81200966 and No. 815- 00365), and Beijing Natural Science Founda- tion (No. 7172040), and Shanxi Province Social Development Science and Technology Attack Project (No. 2016SF-132).
Disclosure of conflict of interest
None.
Address correspondence to: Chengxiong Gu, De- partment of Cardiothoracic Surgery, Beijing An- zhen Hospital, Capital Medical University, No. 2 Anzhen Road, Chaoyang District, Beijing 100045, China. Tel: 86-010-64412431; 86-010-64432606; E-mail: [email protected]
References
[1] Barquera S, Pedroza-Tobias A, Medina C, Her-nandez-Barrera L, Bibbins-Domingo K, Lozano R and Moran AE. Global overview of the epide-miology of atherosclerotic cardiovascular dis-ease. Arch Med Res 2015; 46: 328-338. [2] Hansson GK and Libby P. The immune
re-sponse in atherosclerosis: a double-edged sword. Nat Rev Immunol 2006; 6: 508-519. [3] Zaid M, Fujiyoshi A, Kadota A, Abbott RD and
Miura K. Coronary artery calcium and carotid artery intima media thickness and plaque:
clinical use in need of clarification. J Athero -scler Thromb 2017; 24: 227-239.
[4] Woo SY, Joh JH, Han SA and Park HC. Preva-lence and risk factors for atherosclerotic ca-rotid stenosis and plaque: a population-based screening study. Medicine (Baltimore) 2017; 96: e5999.
[5] Fairhead JF and Rothwell PM. The need for
ur-gency in identification and treatment of symp -tomatic carotid stenosis is already established. Cerebrovasc Dis 2005; 19: 355-358.
[6] Bonati LH and Nederkoorn PJ. Clinical perspec-tive of carotid plaque imaging. Neuroimaging Clin N Am 2016; 26: 175-182.
[7] Saba L, Anzidei M, Marincola BC, Piga M, Raz E, Bassareo PP, Napoli A, Mannelli L, Catalano C and Wintermark M. Imaging of the carotid artery vulnerable plaque. Cardiovasc Intervent Radiol 2014; 37: 572-585.
[8] Adams HP Jr, Bendixen BH, Kappelle LJ, Biller J, Love BB, Gordon DL and Marsh EE 3rd.
Clas-sification of subtype of acute ischemic stroke. definitions for use in a multicenter clinical trial. TOAST. Trial of org 10172 in acute stroke treat -ment. Stroke 1993; 24: 35-41.
[9] Saba L, Anzidei M, Sanfilippo R, Montisci R, Lu-catelli P, Catalano C, Passariello R and Mallari-ni G. Imaging of the carotid artery. Atheroscle-rosis 2012; 220: 294-309.
[10] Saba L, Caddeo G, Sanfilippo R, Montisci R
and Mallarini G. CT and ultrasound in the study of ulcerated carotid plaque compared with sur-gical results: potentialities and advantages of multidetector row CT angiography. AJNR Am J Neuroradiol 2007; 28: 1061-1066.
[11] Grant EG, Benson CB, Moneta GL, Alexandrov AV, Baker JD, Bluth EI, Carroll BA, Eliasziw M, Gocke J, Hertzberg BS, Katanick S, Needleman L, Pellerito J, Polak JF, Rholl KS, Wooster DL and Zierler RE. Carotid artery stenosis: gray-scale and Doppler US diagnosis-society of radi-ologists in ultrasound consensus conference. Radiology 2003; 229: 340-346.
[13] Wang Z, Gerstein M and Snyder M. RNA-Seq: a revolutionary tool for transcriptomics. Nat Rev Genet 2009; 10: 57-63.
[14] Morin R, Bainbridge M, Fejes A, Hirst M, Krzy-winski M, Pugh T, McDonald H, Varhol R, Jones
S and Marra M. Profiling the HeLa S3 transcrip -tome using randomly primed cDNA and mas-sively parallel short-read sequencing. BioTech-niques 2008; 45: 81-94.
[15] Mortazavi A, Williams BA, McCue K, Schaeffer L and Wold B. Mapping and quantifying mam-malian transcriptomes by RNA-seq. Nat Meth-ods 2008; 5: 621-628.
[16] Chen EA, Souaiaia T, Herstein JS, Evgrafov OV,
Spitsyna VN, Rebolini DF, Knowles JA. Effect of RNA integrity on uniquely mapped reads in RNA-Seq. BMC Research Notes 2014; 7: 753. [17] Liu D and Graber JH. Quantitative comparison
of EST libraries requires compensation for sys-tematic biases in cDNA generation. BMC Bioin-formatics 2006; 7: 77.
[18] Zhao QY, Wang Y, Kong YM, Luo D, Li X and Hao
P. Optimizing de novo transcriptome assembly
from short-read RNA-Seq data: a comparative study. BMC Bioinformatics 2011; 12: S2. [19] Zerbino DR and Birney E. Velvet: algorithms for
de novo short read assembly using de Bruijn graphs. Genome Res 2008; 18: 821-829. [20] Oases: a de novo transcriptome assembler for
very short reads.
[21] Chang Z, Li G, Liu J, Zhang Y, Ashby C, Liu D, Cramer CL and Huang X. Bridger: a new frame-work for de novo transcriptome assembly us-ing RNA-seq data. Genome Biol 2015; 16: 30. [22] Li B, Fillmore N, Bai Y, Collins M, Thomson JA,
Stewart R and Dewey CN. Evaluation of de novo transcriptome assemblies from RNA-Seq data. Genome Biol 2014; 15: 553.
[23] Dobin A, Davis CA, Schlesinger F, Drenkow J, Zaleski C, Jha S, Batut P, Chaisson M and Gin-geras TR. STAR: ultrafast universal RNA-seq aligner. Bioinformatics 2013; 29: 15-21. [24] Langmead B, Trapnell C, Pop M and Salzberg
SL. Ultrafast and memory-efficient alignment
of short DNA sequences to the human ge-nome. Genome Biol 2009; 10: R25.
[25] Trapnell C, Pachter L and Salzberg SL. TopHat: discovering splice junctions with RNA-Seq. Bio-informatics 2009; 25: 1105-1111.
[26] Trapnell C, Roberts A, Goff L, Pertea G, Kim D, Kelley DR, Pimentel H, Salzberg SL, Rinn JL and Pachter L. Differential gene and transcript expression analysis of RNA-seq experiments
with TopHat and cufflinks. Nat Protoc 2012; 7:
562-578.
[27] Liao Y, Smyth GK and Shi W. The subread align-er: fast, accurate and scalable read mapping by seed-and-vote. Nucleic Acids Research 2013; 41: e108.
[28] Patro R, Mount SM and Kingsford C. Sailfish enables alignment-free isoform quantification
from RNA-seq reads using lightweight algo-rithms. Nat Biotechnol 2014; 32: 462-464. [29] Bray NL, Pimentel H, Melsted P and Pachter L.
Near-optimal probabilistic RNA-seq quantifica -tion. Nat Biotechnol 2016; 34: 525-527. [30] Wu TD and Watanabe CK. GMAP: a genomic
mapping and alignment program for mRNA
and EST sequences. Bioinformatics (Oxford,
England) 2005; 21: 185918-185975.
[31] Lu B, Zeng Z and Shi T. Comparative study of de novo assembly and genome-guided assem-bly strategies for transcriptome reconstruction based on RNA-Seq. Sci China Life Sci 2013; 56: 143-155.
[32] Bradnam KR, Fass JN, Alexandrov A. Assemb-lathon 2: evaluating de novo methods of ge-nome assembly in three vertebrate species. Gigascience 2013; 2: 10.
[33] Li H, Lovci MT, Kwon YS, Rosenfeld MG, Fu XD and Yeo GW. Determination of tag density re-quired for digital transcriptome analysis: appli-cation to an androgen-sensitive prostate can-cer model. Proc Natl Acad Sci U S A 2008; 105: 20179-20184.
[34] Zhang ZH, Jhaveri DJ, Marshall VM, Bauer DC, Edson J, Narayanan RK, Robinson GJ, Lund-berg AE, Bartlett PF, Wray NR and Zhao QY. A comparative study of techniques for differen-tial expression analysis on RNA-Seq data”.
PLoS One 2014; 9: e103207.
[35] Anders S, Pyl PT and Huber W. HTSeq--a python framework to work with high-throughput se-quencing data. Bioinformatics 2015; 31: 166-169.
[36] Liao Y, Smyth GK and Shi W. featureCounts: an
efficient general purpose program for assign -ing sequence reads to genomic features. Bio-informatics 2014; 30: 923-930.
[37] Schmid MW and Grossniklaus U. Rcount:
sim-ple and flexible RNA-Seq read counting. Bioin -formatics 2015; 31: 436-437.
[38] Finotello F, Lavezzo E, Bianco L, Barzon L, Maz-zon P, Fontana P, Toppo S and Di Camillo B. Reducing bias in RNA sequencing data: a novel approach to compute counts. BMC Bioinfor-matics 2014; 15: S7.
[39] Hashimoto TB, Edwards MD and Gifford DK. Universal count correction for high-throughput sequencing. PLoS Comput Biol 2014; 10: e1003494.
[40] Robinson MD and Oshlack A. A scaling normal -ization method for differential expression anal-ysis of RNA-seq data. Genome Biol 2010; 11: R25.
[41] Trapnell C, Williams BA, Pertea G, Mortazavi A, Kwan G, van Baren MJ, Salzberg SL, Wold BJ and Pachter L. Transcript assembly and
quan-tification by RNA-Seq reveals unannotated
[42] Law CW, Chen YS, Shi W and Smyth GK. voom: precision weights unlock linear model analysis tools for RNA-seq read counts. Genome Biol 2014; 15: R29.
[43] Anders S and Huber W. Differential expression analysis for sequence count data. Genome Biol 2010; 11: R106.
[44] Robinson MD, McCarthy DJ and Smyth GK. edgeR: a bioconductor package for differential expression analysis of digital gene expression
data. Bioinformatics (Oxford, England) 2010;
26: 139-140.
[45] Soneson C and Delorenzi M. A comparison of methods for differential expression analysis of RNA-seq data. BMC Bioinformatics 2013; 14: 91.
[46] Jiangfeng F, Yuzhu L, Sijiu Y, Yan C, Gengquan X, Libin W, Yangyang P and Honghong H.
Tran-scriptional profiling of two different
physio-logical states of the yak mammary gland us-
ing RNA sequencing. PLoS One 2018; 13:
e0201628.
[47] Zacher B, Abnaof K, Gade S, Younesi E, Tresch A, Fröhlich H. Joint Bayesian inference of
con-dition-specific miRNA and transcription factor
activities from combined gene and microRNA expression data. Bioinformatics 2012; 28: 1714-1720.
[48] Bioconductor-Open source software for Bioin -formatics.
[49] Huber W, Carey VJ, Gentleman R, Anders S, Carlson M, Carvalho BS, Bravo HC, Davis S, Gatto L, Girke T, Gottardo R, Hahne F, Hansen KD, Irizarry RA, Lawrence M, Love MI,
MacDon-ald J, Obenchain V, Oleś AK, Pagès H, Reyes A,
Shannon P, Smyth GK, Tenenbaum D, Waldron
L and Morgan M. Orchestrating high-through -put genomic analysis with bioconductor. Nat Methods 2015; 12: 115-121.
[50] Mortazavi A, Williams BA, McCue K, Schaeffer L and Wold B. Mapping and quantifying mam-malian transcriptomes by RNA-Seq. Nat Meth-ods 2008; 5: 621-628.
[51] Marguerat S, Schmidt A, Codlin S, Chen W, Ae-bersold R and Bähler J. Quantitative analysis
of fission yeast transcriptomes and proteomes
in proliferating and quiescent cells. Cell 2012; 151: 671-683.
[52] Owens ND, Blitz IL, Lane MA, Patrushev I, Over -ton JD, Gilchrist MJ, Cho KW and Khokha MK. Measuring absolute RNA copy numbers at high temporal resolution reveals transcriptome ki-netics in development. Cell Rep 2016; 14: 632-647.
[53] Marcotte EM, Pellegrini M, Thompson MJ,
Yeates TO and Eisenberg D. A combined algo -rithm for genome-wide prediction of protein function. Nature 1999; 402: 83-86.
[54] Giorgi FM. Comparative study of RNA-seq- and Microarray-derived coexpression networks in Arabidopsis thaliana. Bioinformatics 2013; 29: 717-724.
[55] Iancu OD. Utilizing RNA-Seq data for de novo
coexpression network inference. Bioinformat-ics 2012; 28: 1592-1597.
[56] Eksi R, Li HD, Menon R, Wen Y, Omenn GS,
Kretzler M and Guan Y. Systematically differen-tiating functions for alternatively spliced iso-forms through integrating RNA-seq data. PLoS Comput Biol 2013; 9: e1003314.
[57] Li HD, Menon R, Omenn GS and Guan Y. The
emerging era of genomic data integration for analyzing splice isoform function. Trends Gen-et 2014; 30: 340-347.
[58] Robinson MD and Smyth GK. Moderated sta-tistical tests for assessing differences in tag abundance. Bioinformatics 2007; 23: 2881-2887.
[59] Robinson MD and Smyth GK. Small-sample es-timation of negative binomial dispersion, with applications to SAGE data. Biostatistics 2008; 9: 321-332.
[60] Fröhlich H. biRte: Bayesian inference of
con-text-specific regulator activities and transcrip -tional networks. Bioinformatics 2015; 31: 3290-3298.
[61] Li H, Lovci MT, Kwon YS, Rosenfeld MG, Fu XD and Yeo GW. Determination of tag density re-quired for digital transcriptome analysis: appli-cation to an androgen-sensitive prostate can-cer model. Proc Natl Acad Sci U S A 2008; 105: 20179-20184.
[62] Marioni JC, Mason CE, Mane SM, Stephens M and Gilad Y. RNA-seq: an assessment of tech-nical reproducibility and comparison with gene expression arrays. Genome Res 2008; 18: 1509-1517.
[63] Cui X and Churchill GA. Statistical tests for dif-ferential expression in cDNA microarray experi-ments. Genome Biol 2003; 4: 210.
[64] Virmani R, Burke AP, Kolodgie FD and Farb A. Vulnerable plaque: the pathology of unstable coronary lesions. J Interv Cardiol 2002; 15: 439-446.