Of words, eyes and brains:
Correlating image-based distributional semantic models
with neural representations of concepts
Andrew J. Anderson, Elia Bruni, Ulisse Bordignon, Massimo Poesio and Marco Baroni Center for Mind/Brain Sciences (University of Trento, C.so Bettini 31, Rovereto, Italy)
Abstract
Traditional distributional semantic models ex-tract word meaning representations from co-occurrence patterns of words in text cor-pora. Recently, the distributional approach has been extended to models that record the co-occurrence of words with visual features in image collections. These image-based models should be complementary to text-based ones, providing a more cognitively plausible view of meaning grounded in visual perception. In this study, we test whether image-based mod-els capture the semantic patterns that emerge from fMRI recordings of the neural signal. Our results indicate that, indeed, there is a significant correlation between image-based and brain-based semantic similarities, and that image-based models complement text-based ones, so that the best correlations are achieved when the two modalities are combined. De-spite some unsatisfactory, but explained out-comes (in particular, failure to detect differ-ential association of models with brain areas), the results show, on the one hand, that image-based distributional semantic models can be a precious new tool to explore semantic repre-sentation in the brain, and, on the other, that neural data can be used as the ultimate test set to validate artificial semantic models in terms of their cognitive plausibility.
1 Introduction
Many recent neuroscientific studies have brought support to the view that concepts are represented in terms of patterns of neural activation over broad
areas, naturally encoded as vectors in a neural se-mantic space (Haxby et al., 2001; Huth et al., 2012). Similar representations are also widely used in com-putational linguistics, and in particular in distribu-tional semantics (Clark, 2012; Erk, 2012; Turney and Pantel, 2010), that captures meaning in terms of vectors recording the patterns of co-occurrence of words in large corpora, under the hypothesis that words that occur in similar contexts are similar in meaning.
Since the seminal work of Mitchell et al. (2008), there has thus being interest in investigating whether corpus-harvested semantic representations can con-tribute to the study of concepts in the brain. The relation is mutually beneficial: From the point of view of brain activity decoding, a strong correlation between corpus-based and brain-derived conceptual representations would mean that we could use the former (much easier to construct on a very large scale) to make inferences about the second: e.g., us-ing corpus-based representations to reconstruct the likely neural signal associated to words we have no direct brain data for. From the point of view of com-putational linguistics, neural data provide the ulti-mate testing ground for models that strive to cap-ture important aspects of human semantic mem-ory (much more so than the commonly used ex-plicit semantic rating benchmarks). If we found that a corpus-based model of meaning can make non-trivial predictions about the structure of the semantic space in the brain, that would make a pretty strong case for the intriguing idea that the model is approx-imating, in interesting ways, the way in which hu-mans acquire and represent semantic knowledge.
We take as our starting point the extensive experi-ments reported in Murphy et al. (2012), who showed that purely corpus-based distributional models are at least as good at brain signal prediction tasks as ear-lier models that made use of manually-generated or controlled knowledge sources (Chang et al., 2011; Palatucci et al., 2009; Pereira et al., 2011), and we evaluate a very recent type of distributional model, namely one that is not extracted from textual data but from image collections through automated vi-sual feature extraction techniques. It has been ar-gued that this new generation of image-based dis-tributional models (Bruni et al., 2011; Bruni et al., 2012b; Feng and Lapata, 2010; Leong and Mihal-cea, 2011) provides a more realistic view of mean-ing, since humans obviously acquire a large propor-tion of their semantic knowledge from perceptual data. The first question that we ask, thus, is whether the more “grounded” image-based models can help us in interpreting conceptual representations in the brain. More specifically, we will compare the per-formance of different image-based representations, and we will test whether text- and image-based rep-resentations are complementary, so that when used together they can better account for patterns in neu-ral data. Finally, we will check for differences be-tween anatomical regions in the degree to which text and/or image models are effective, as one might ex-pect given the well-known functional specializations of different anatomical regions.
2 Brain data
We use the data that were recorded and preprocessed by Mitchell et al. (2008), available for download in their supporting online material.1 Full details of the experimental protocol, data acquisition and prepro-cessing can be found in Mitchell et al. (2008) and the supporting material. Key points are that there were nine right-handed adult participants (5 female, age between 18 and 32). The experimental task was to actively think about the properties of sixty objects that were presented visually, each as a line drawing in combination with a text label. The entire set of objects was presented in a random order in six ses-sions, each object remained on screen for 3 seconds with a seven second fixation gap between
presenta-1
http://www.cs.cmu.edu/˜tom/science2008/
tions.
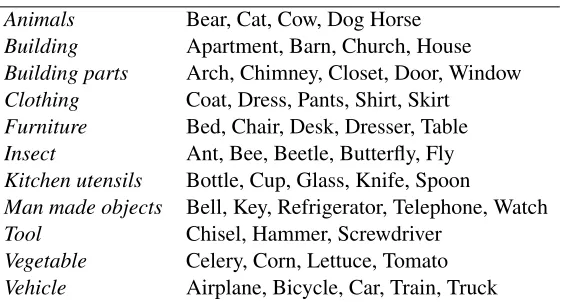
Mitchell and colleagues examined 12 categories, five objects per category, for a total of 60 concepts (words). Due to coverage limitations, we use 51/60 words representing 11/12 categories. Table 1 con-tains the full list of 51 words organized by category.
fMRI acquisition and preprocessing Mitchell et al. (2008) acquired functional images on a Siemens Allegra 3.0T scanner using a gradient echo EPI pulse sequence with TR=1000 ms, TE=30 ms and a 60◦ angle. Seventeen 5-mm thick oblique-axial slices were imaged with a gap of 1-mm between slices. The acquisition matrix was 64×64 with 3.125×3.125×5-mm voxels. They subsequently corrected data for slice timing, motion, linear trend, and performed temporal smoothing with a high-pass filter at 190s cutoff. The data were normalized to the MNI template brain image, spatially normalized into MNI space and resampled to 3×3×6 mm3 vox-els. The voxel-wise percent signal change relative to the fixation condition was computed for each object presentation. The mean of the four images acquired 4s post stimulus presentation was used for analysis.
To create a single representation per object per participant, we took the voxel-wise mean of the six presentations of each word. Likewise to create a sin-gle representation per category per participant, we took the voxel-wise mean of all word models per category, per participant.
com-Animals Bear, Cat, Cow, Dog Horse
Building Apartment, Barn, Church, House
Building parts Arch, Chimney, Closet, Door, Window
Clothing Coat, Dress, Pants, Shirt, Skirt
Furniture Bed, Chair, Desk, Dresser, Table
Insect Ant, Bee, Beetle, Butterfly, Fly
Kitchen utensils Bottle, Cup, Glass, Knife, Spoon
Man made objects Bell, Key, Refrigerator, Telephone, Watch
Tool Chisel, Hammer, Screwdriver
Vegetable Celery, Corn, Lettuce, Tomato
[image:3.612.168.449.55.206.2]Vehicle Airplane, Bicycle, Car, Train, Truck
Table 1: The 51 words represented by the brain and the distributional models, organized by category.
bination of the two, and Window2 is a text-based model.
Theoccipitallobe houses the primary visual pro-cessing system and consequently it is reasonable to expect some bias toward image-based semantic models. Furthermore, given that experimental stim-uli incorporated line drawings of the object,and the visual cortex has a well-established role in process-ing low-level visual statistics includprocess-ing edge detec-tion (Bruce et al., 2003), we naturally expected a good performance from Object (formulated from edge orientation histograms of similar objects).
Following Goodale and Milner (1992)’s influ-ential perception-action model (see McIntosh and Schenk (2009) for recent discussion), visual infor-mation is channeled from the occipital lobe in two streams: a perceptual stream, serving object identi-fication and recognition; and an action stream, spe-cialist in processing egocentric spatial relationships and ultimately supporting interaction with the world. The perceptual stream leads to thetemporal lobe. Here the fusiform gyrus (shared with the occipital lobe) plays a general role in object categorisation (e.g., animals and tools (Chao et al., 1999), faces (Kanwisher and Yovel, 2006), body parts (Peelen and Downing, 2005) and even word form percep-tion (McCandliss et al., 2003)). As the parahip-pocampus is strongly associated with scene repre-sentation (Epstein, 2008), we expect both the Object and Context models to capture variability in the tem-poral lobe. Of wider relevance to semantic process-ing, the medial temporal gyrus, inferior temporal gyrus and ventral temporal lobe have generally been implicated to have roles in supramodal integration
and concept retrieval (Binder et al., 2009). Given this, we expected that incorporating text would also be valuable and that the Window2&Object&Context combination would be a good model.
The visual action stream leads from the occipi-tal lobe to theparietal lobe to support spatial cog-nition tasks and action control (Sack, 2009). In that there seems to be an egocentric frame of ref-erence, placing actor in environment, it is tempt-ing to speculate that the Context model is more ap-propriate than the Object model here. As the pari-etal lobe also contains the angular gyrus, thought to be involved in complex, supra-modal information integration and knowledge retrieval (Binder et al., 2009), we might again forecast that integrating text and image information would boost performance, so Window2&Context was earmarked as a strong can-didate.
The frontal lobe, is traditionally associated with high-level processing and manipulation of abstract knowledge and rules and controlled behaviour (Miller et al., 2002). Regarding semantics, the dor-somedial prefrontal cortex has been implicated in self-guided retrieval of semantic information (e.g., uncued speech production), the ventromedial pre-frontal cortex in motivation and emotional process-ing, the inferior frontal gyrus in phonological and syntactic processing, (Binder et al., 2009) and in-tegration of lexical information (Hagoort, 2005). Given the association with linguistic processing we anticipated a bias in favour of Window2.
Voxel selection The set of 500 most stable voxels, both within the whole brain and from within each region of interest were identified for analysis. The most stable voxels were those showing consistent variation across the different stimuli between scan-ning sessions. Specifically, and following a similar strategy to Mitchell et al. (2008), for each voxel, the set of 51 words from each unique pair of scanning sessions were correlated using Pearson’s correlation (6 sessions and therefore 15 unique pairs), and the mean of the 15 resulting correlation coefficients was taken as the measure of stability. The 500 voxels with highest mean correlations were selected.
3 Distributional models
Distributional semantic models approximate word meaning by keeping track of word co-occurrence statistics from large textual input, relying on the dis-tributional hypothesis: The meaning of a word can be induced by the context in which it occurs (Turney and Pantel, 2010). Despite their great success, these models still rely on verbal input only, while humans base their meaning representation also on perceptual information (Louwerse, 2011).
Thanks to recent developments in computer vi-sion, it is nowadays possible to take the visual per-ceptual channel into account, and build new com-putational models of semantics enhanced with vi-sual information (Feng and Lapata, 2010; Bruni et al., 2011; Leong and Mihalcea, 2011; Bergsma and Goebel, 2011; Bruni et al., 2012a). Given a set of target concepts and a collection of images depicting those concepts, it is indeed possible to first encode the image content into low-level features, and subse-quently convert it into a higher-level representation based on the bag-of-visual-words method (Grauman and Leibe, 2011). Recently, Bruni et al. (2012b) have shown that better semantic representations can be extracted if we first localize the concept in the image, and then extract distinct higher-level features (visual words) from the box containing the concept and from the surrounding context. We also follow this strategy here.
In our experiments we utilize both traditional text-based models and experimental image-text-based mod-els, as well as their combination.
3.1 Textual models
Verb We experiment with the original text-based semantic model used to predict fMRI patterns by Mitchell et al. (2008). Each object stimulus word is represented as a 25-dimensional vector, with each value corresponding to the normalized sentence-wide co-occurrence of that word with one of 25 manually-picked sensorimotor verbs (such as see,
hear,eat, . . . ) in a trillion word text corpus.
Window2 To create this model, we collect text co-occurrence statistics from the freely available ukWaC and Wackypedia corpora combined (about 3 billion words in total).2 As collocates of our distri-butional model we select a set of 30K words, namely the top 20K most frequent nouns, 5K most frequent adjectives and 5K most frequent verbs.
In the tradition of HAL (Lund and Burgess, 1996), the model is based on co-occurrence statistics with collocates within a fixed-size window of 2 to the left and right of each target word. Despite their sim-plicity, narrow-window-based models have shown to achieve state-of-the-art results in various stan-dard semantic tasks (Bullinaria and Levy, 2007) and to outperform both document-based and syntax-based models trained on the same corpus (Bruni et al., 2012a). Moreover, in Murphy et al. (2012) a window-based model very similar to ours was not significantly worse than their best model for brain decoding. We tried also a few variations, e.g., us-ing a larger window or different transformations on the raw co-occurrences from those presented below, but with little, insignificant changes in performance. Given that our focus here is on visual information, we only report results for Window2 and its combi-nation with visual models.
3.2 Visual models
Our visual models are inspired by Bruni et al. (2012b), that have explored to what extent extract-ing features from images where objects are local-ized results in better semantic representations. They found that extracting visual features separately from the object and its surrounding context leads to bet-ter performance than not using localization, and us-ing only object- and, more surprisus-ingly, context-extracted features also results in performant models
(especially when evaluating inter-object similarity, the context in which an object is located can signif-icantly contribute to semantic representation, in cer-tain cases carrying even more information than the depicted object itself).
More in detail, with localization the visual fea-tures (visual words) can be extracted from the ob-ject bounding box (in our experiments, theObject
model) or from only outside the object box (the
Context model). A combined model is obtained by concatenating the two feature vectors (the Ob-ject&Contextmodel).
Visual model construction pipeline To extract visual co-occurrence statistics, we use images from ImageNet (Deng et al., 2009),3 a very large im-age database organized on top of the WordNet hi-erarchy (Fellbaum, 1998). ImageNet has more than 14 million images, covering 21K WordNet nominal synsets. ImageNet stands out for the high quality of its images, both in terms of resolution and concept annotations. Moreover, for around 3K concepts, an-notations of object bounding boxes is provided. This last feature allows us to exploit object localization within our experiments.
To build visual distributional models, we utilize the bag-of-visual-words (BoVW) representation of images (Sivic and Zisserman, 2003; Csurka et al., 2004). Inspired by NLP, BoVW discretizes the im-age content in terms of a histogram of visual word counts. Differently from NLP, in vision there is not a natural notion of visual words, hence a visual vocab-ulary has to be built from scratch. The process works as follows. First, a large set of low-level features is extracted from a corpus of images. The low-level feature vectors are subsequently clustered into dif-ferent regions (visual words). Given then a new im-age, each of the low-level feature vectors extracted from the patches that compose it is mapped to the nearest visual word (e.g., in terms of Euclidean dis-tance from the cluster centroid) such that the image can be represented with a histogram counting the in-stances of each visual word in the image.
As low-level features we use SIFT, the Scale In-variant Feature Transform (Lowe, 2004). SIFT fea-tures are good at capturing parts of objects and are designed to be invariant to image transformations
3http://www.image-net.org/
such as change in scale, rotation and illumination. To construct the visual vocabulary, we cluster the SIFT features into 25K different clusters.4 We add also spatial information by dividing the image into several subregions, representing each of them in terms of BoVW and then stacking the resulting his-tograms (Lazebnik et al., 2006). We use in total 8 different regions, obtaining a final vector of 200K dimensions (25K visual words×8 regions). Since each concept in our dataset is represented by mul-tiple images, we pool the visual word occurrences across images by summing them up into a single vector.
To perform the entire visual pipeline we use VSEM, an open library for visual semantics (Bruni et al., 2013).5
3.3 Model transformations and combination
Once both the textual and the visual models are built, we perform two different transformations on the raw co-occurrence counts. First, we transform them into nonnegative Pointwise Mutual Information (PMI) association scores (Church and Hanks, 1990). As a second transformation, we apply dimensionality re-duction to the two matrices. In particular, we adopt the Singular Value Decomposition (SVD), one of the most effective methods to approximate the original data in lower dimensionality space (Sch¨utze, 1997), and reduce the vectors to 50 dimensions.
To combine text- and image-based semantic mod-els in a joint representation, we separately normalize their vectors to unit length, and concatenate them, along the lines of Bruni et al. (2011). More sophis-ticated combination models have been proposed in the recent literature on multimodal semantics. For example, Bruni et al. (2012a) use SVD as a mix-ing strategy, given its ability to smooth the matrices and uncover latent dimensions. Another example is Silberer and Lapata (2013), where Canonical Corre-lation Analysis is used. We reserve the exploration of more advanced combination methods for further studies.
Finally, to represent the 11 categories we experi-ment with (see Table 1), we average the vectors of the concepts they include.
4
We usek-means, the most commonly employed clustering algorithm for this task.
4 Experiments
A question is posed over how to evaluate the rela-tionship between the different distributional models and brain data. Comparing each model’s predictive performance using the same strategy as Mitchell et al. (2008) (also followed by Murphy et al. (2012)) is one possibility: they used multiple regression to relate distributional codes to individual voxel activa-tions, thus allowing brain states to be estimated from previously unseen distributional codes. Regression models were trained on 58/60 words and in testing the regression models estimated the brain state as-sociated with the 2 unseen distributional codes. The predicted brain states were compared with the actual fMRI data, and the process repeated for each per-mutation of left-out words, to build a metric of pre-diction accuracy. For our purposes, a fair compari-son of models using this strategy is complicated by differences in dimensionality between both seman-tic models and lobes (which we compare to other lobes) in association with the comparatively small number of words in the fMRI data set. Large dimen-sionality models risk overfitting the data, and it is a nuisance to try to reliably correct for the effects of overfitting in performance comparisons. Not least, to thoroughly evaluate all possible cross-validation permutations is demanding in processing time, and we have many models to compare.
An alternative approach, and that which we have adopted, is representational similarity analy-sis (Kriegeskorte et al., 2008). Representational similarity analysis circumvents the previous prob-lems by abstracting each fMRI/distributional data source to a common structure capturing the inter-relationships between each pair of data items (e.g., words). Specifically, for each model/participant’s fMRI data/anatomical region, the similarity struc-ture was evaluated by taking the pairwise correla-tion (Pearson’s correlacorrela-tion coefficient) between all unique category or word combinations. This pro-duced a list of 55 category pair correlations and 121 word pair correlations for each data source. For all brain data, correlation lists were averaged across the nine participants to produce a single list of mean word pair correlations and a single list of mean cat-egory pair correlations for each anatomical region and the whole brain. Then to provide a measure of
similarity between models and brain data, the cor-relation lists for respective data sources were them-selves correlated using Spearman’s rank correlation. Statistical significance was tested using a permuta-tion test: The word-pair (or category-pair) labels were randomly shuffled 10,000 times to estimate a null distribution when the two similarity lists are not correlated. Thep-value is calculated as the pro-portion of random correlation coefficients that are greater than or equal to the observed coefficient.
5 Results
5.1 Category-level analyses
Do image models correlate with brain data? Ta-ble 2 displays results of Spearman’s correlations be-tween the per-category similarity structure of dis-tributional models and brain data. There is a sig-nificant correlation between every purely image-based model and the occipital, parietal and tempo-ral lobes, and also the whole brain (.38≤ρ ≥.51, allp≤.01). The frontal lobe is less well described. Still, whilst not significant, correlations are only marginally above the conventional p = .05 cutoff (all are less thanp=.064). This strongly suggests that the answer to our first question is yes: distri-butional models derived from images can be used to explain concept fMRI data. Otherwise Window2 significantly correlates with the whole brain and all anatomical regions except for the frontal lobe where ρ=.34, p=.07. In contrast Verb (the original, par-tially hand-crafted model used by Mitchell and col-leagues) captures inter-relationships poorly and nei-ther correlates with the whole brain or any lobe.
Frontal Parietal Occipital Temporal Whole-Brain Verb 0.00 (0.51) 0.06 (0.37) 0.24 (0.10) 0.07 (0.35) 0.17 (0.17) Window2 0.34 (0.06) 0.49 (0.00) 0.47 (0.01) 0.47 (0.00) 0.44 (0.00) Object 0.27 (0.07) 0.38 (0.02) 0.45 (0.00) 0.47 (0.00) 0.43 (0.01) Context 0.33 (0.06) 0.50 (0.00) 0.44 (0.00) 0.44 (0.01) 0.44 (0.01) Object&Context 0.32 (0.05) 0.48 (0.00) 0.51 (0.00) 0.49 (0.00) 0.49 (0.00) Window2&Object 0.32 (0.06) 0.45 (0.00) 0.52 (0.00) 0.53 (0.00) 0.49 (0.00) Window2&Context 0.39 (0.04) 0.57 (0.00) 0.53 (0.00) 0.55 (0.00) 0.51 (0.00) Window2&Object&Context 0.37 (0.04) 0.52 (0.00) 0.55 (0.00) 0.55 (0.00) 0.53 (0.00)
Table 2: Matrix of correlations between each pairwise combination of distributional semantic models and brain data. Correlations correspond to the pairwise similarity between the 11 categories. In each column the first value corre-sponds to Spearman’s rank correlation coefficient and the value in parenthesis is thep-value.
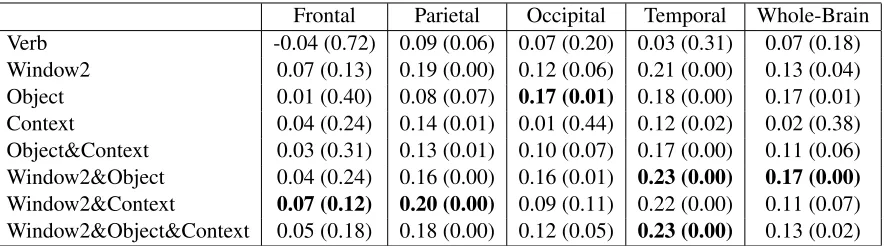
Frontal Parietal Occipital Temporal Whole-Brain Verb -0.04 (0.72) 0.09 (0.06) 0.07 (0.20) 0.03 (0.31) 0.07 (0.18) Window2 0.07 (0.13) 0.19 (0.00) 0.12 (0.06) 0.21 (0.00) 0.13 (0.04) Object 0.01 (0.40) 0.08 (0.07) 0.17 (0.01) 0.18 (0.00) 0.17 (0.01) Context 0.04 (0.24) 0.14 (0.01) 0.01 (0.44) 0.12 (0.02) 0.02 (0.38) Object&Context 0.03 (0.31) 0.13 (0.01) 0.10 (0.07) 0.17 (0.00) 0.11 (0.06) Window2&Object 0.04 (0.24) 0.16 (0.00) 0.16 (0.01) 0.23 (0.00) 0.17 (0.00)
Window2&Context 0.07 (0.12) 0.20 (0.00) 0.09 (0.11) 0.22 (0.00) 0.11 (0.07) Window2&Object&Context 0.05 (0.18) 0.18 (0.00) 0.12 (0.05) 0.23 (0.00) 0.13 (0.02)
Table 3: Matrix of correlations between each pairwise combination of distributional semantic models and brain data. Correlations correspond to the pairwise similarity between the 51 words. In each column the first value corresponds to Spearman’s rank correlation coefficient and the value in parenthesis is thep-value.
other significant differences between models. How-ever there was a highly significant difference be-tween lobes F(3,12)=13.77, p <.001. Post-hoc 2-tailed t-tests comparing lobe pairs found that the frontal lobe yielded significantly different correla-tions (lower) than each other lobe. When the frontal lobe (mean±sd over models = .25±.14) was com-pared to the second weakest anatomical region, the parietal lobe (mean±sd=.38±.19), the difference was highly significant, t=-8, df=3, p <.01. This introduces the question of whether this difference in correlations is the result of differences in neural cat-egory organisation and representation, or differences in the quality of the signal, which we address next.
Category-level inter-correlations between lobes were all relatively strong and highly significant. The occipital lobe was found to be the most distinct, be-ing similar to the temporal lobe (ρ=.71, p <.001), but less so to the parietal and frontal lobes (ρ=.53, p <.001 and ρ=.57, p <.001 respectively). The
temporal lobe shows roughly similar levels of cor-relation to each other lobe (all .71≤ ρ ≥.73, all p <.001). The frontal and parietal lobes are related most strongly to each other (ρ=.77, p <.001), to a slightly lesser extent to the temporal lobe (in both casesρ=.73, p <.001) and least so to the occipital lobe. These strong relationships are consistent with there being a broadly similar category organisation across lobes.
[image:7.612.87.529.239.362.2]in-sects and clothing, because all have legs and arms and curves (of course we would not expect a strong relationship between insects and clothes in function or other modalities such as sound), buildings to be similar to building parts and vehicles (hard edges and windows), building parts to be similar to furni-ture (e.g., from Table 1 we see there is some overlap in category membership between these categories, such as closet and door) and tools to be similar to kitchen utensils. All of these relationships are main-tained in the occipital lobe, and many are visible in the frontal lobe (including the similarity between in-sects and clothes), however there are exceptions that are difficult to explain e.g., within the frontal lobe, building parts are not similar to furniture, kitchen utensils are closer to clothing than to tools and ve-hicles are more similar to clothing than anything else. As such we conclude thatcategory-level rep-resentations were similar across lobes with differ-ences likely due to variation in signal quality be-tween lobes.
Are text- and image-based semantic models com-plementary? Turning to the question of whether text- and image-derived semantic information can be complementary, we observe from Table 2 that there is not a single instance of a joint model with a weaker correlation than its pure-image counter-part. The Window2 model showed a stronger cor-relation than the Window2&Object model for the frontal and parietal lobes, but was weaker than Win-dow2&Object&Context and Window2&Context in all tests and was also weaker than any joint model in whole-brain comparisons. The mean±sd correla-tions for all purely image-based results pooled over lobes (3 models * 4 lobes) was .42±.08 in com-parison to .49±.08 for the joint models. The rel-ative performance of Object vs. Context vs. Ob-ject&Context on the four different lobes is preserved between image-based and joint models: correlating the 12 combinations using Spearman’s correlation gives ρ=.85, p <.001. Differences can be statis-tically quantified by pooling all image related cor-relation coefficients for each anatomical region (3 models * 4 regions), as for the respective joint mod-els, and comparing with a 2-tailed Wilcoxon signed rank test. Differences were highly significant (W=0, p <.001,n=12). This evidence accumulates to
sug-Figure 1: Similarity (Pearson correlation) between each category pair in (top) occipital and (bottom) frontal lobes.
gest thattext and image-derived semantic informa-tion can be complementaryin interpreting concept fMRI data.
5.2 Word-level analyses
[image:8.612.312.529.69.451.2]of per-word image-based models correlated with three lobes and the whole brain. Correlations corre-sponding to significance values ofp <.05 were ob-served in the temporal and parietal lobes, for Con-text, Object&Context and Window2 whereas Ob-ject was correlated with the occipital and temporal lobes (p <.05). 2-way ANOVA without replica-tion was used to test for differences between mod-els and lobes. This revealed a significant differ-ence between models (F(4,12)=4.05,p=.027). Post-hoc t-tests showed that the Window2 model signifi-cantly differed from (was stronger than) the Context (t=3.8, p =.03, df=3) and Object&Context models (t=4.5,p=.02, df=3). There were no other signifi-cant differences between models. There was again a significant difference between lobes (F(3,12)=7.89, p < .01), with the frontal lobe showing the weak-est correlations. Post-hoc 2-tailed t-tweak-ests comparing lobe-pairs found that the frontal lobe differed signif-icantly (correlations were weaker) from the parietal (t=-9,p <.001, df=4) and temporal lobes (t=-6.4, p <.01, df=4) but not from the occipital lobe (t= -2.18,p=.09, df=4). No other significant differences between lobes were observed.
Are there differences between models/lobes?
Word-level inter-correlations between lobes were all significant and the pattern of differences in correla-tion strength largely resembled that of the category-level analyses. The occipital lobe was again most similar to the temporal lobe (ρ=.57, p <.001), but less so to the parietal and frontal lobes (ρ=.47, p <.001 and ρ=.34, p <.001 respectively). The temporal lobe this time showed stronger correlation to the parietal (ρ=.68, p <.001) and frontal lobes (ρ=.61,p <.001) than the occipital lobe. The frontal and parietal lobes were again strongly related to one another (ρ=.67, p <.001). These results echo the category-level findings, thatword-level brain activ-ity is also organised in a similar way across lobes. Consequently this diminishes our chances of uncov-ering neat interactions between models and brain ar-eas (where for instance the Window2 model corre-lates with the frontal lobe and Object model matches the occipital lobe). It is however noteworthy that we can observe some interpretable selectivity in lobe*model combinations. In particular the Con-text model better matches the parietal lobe than the
Object model, which in turn better captures the oc-cipital and temporal lobes (Observations are quali-tative). Also as we see next, adding text informa-tion boosts performance in both parietal and tempo-ral lobes (see Section 2 on our expectations about information encoded in the lobes).
Does joining text and image models help word-level interpretation? As concerns the benefits of joining Text and Image information,per-word joint models were generally stronger than the respective image-based models. There was one exception: adding text to the Object model weakened corre-lation with the occipital lobe. Joint models were exclusively stronger than Window2 for the tempo-ral and occipital lobes, and were stronger in 1/3 of cases for the frontal and parietal lobes. In an anal-ogous comparison to the per-category analysis, a Wilcoxon signed rank test was used to examine the difference made by adding text information to image models (pooling 3 models over 4 anatomical areas for both image and joint models). The mean±sd of image models was .1±.06 whereas for Joint models it was .15±.07. The difference was highly signifi-cant (W=1,p <.001, n=12).
6 Conclusion
the text models, which are likely relevant for com-putational semantic tasks.
The weak comparative performance of the origi-nal Mitchell et al.’s Verb model is perhaps surprising given its previous success in prediction (Mitchell et al., 2008), but a useful reminder that a good predic-tor does not necessarily have to capture the internal structure of the data it predicts.
The lack of finding organisational differences be-tween anatomical regions differentially described by the various models is perhaps disappointing, but not uncontroversial, given that the dataset was not origi-nally designed to tease apart visual information from linguistic context. It is however interesting that in the more challenging word-level analysis some meaningful trend was visible. In future experiments it may prove valuable to configure a fMRI stimulus set where text-based and image-based interrelation-ships are maximally different. Collecting our own fMRI data will also allow us to move beyond ex-ploratory analysis, to test sharper predictions about distributional models and their brain area correlates. There are also many opportunities for focusing anal-yses on different subsets of brain regions, with the semantic system identified by Binder et al. (2009) in particular presenting one interesting avenue for in-vestigation.
Acknowledgments
This research was partially funded by a Google Re-search Award to the fifth author.
References
Shane Bergsma and Randy Goebel. 2011. Using visual information to predict lexical preference. In Proceed-ings of RANLP, pages 399–405, Hissar, Bulgaria. Jeffrey R. Binder, Rutvik H. Desai, William W. Graves,
and Lisa L. Conant. 2009. Where is the semantic system? a critical review and meta-analysis of 120 functional neuroimaging studies. Cerebral Cortexl, 12:2767–2796.
Vicki Bruce, Patrick R Green, and Georgeson Mark A. 2003. Visual perception: Physiology, psychology, and ecology. Psychology Pr.
Elia Bruni, Giang Binh Tran, and Marco Baroni. 2011. Distributional semantics from text and images. In Pro-ceedings of the EMNLP GEMS Workshop, pages 22– 32, Edinburgh, UK.
Elia Bruni, Gemma Boleda, Marco Baroni, and Nam Khanh Tran. 2012a. Distributional semantics in Technicolor. InProceedings of ACL, pages 136–145, Jeju Island, Korea.
Elia Bruni, Jasper Uijlings, Marco Baroni, and Nicu Sebe. 2012b. Distributional semantics with eyes: Us-ing image analysis to improve computational represen-tations of word meaning. InProceedings of ACM Mul-timedia, pages 1219–1228, Nara, Japan.
Elia Bruni, Ulisse Bordignon, Adam Liska, Jasper Ui-jlings, and Irina Sergienya. 2013. Vsem: An open li-brary for visual semantics representation. In Proceed-ings of ACL, Sofia, Bulgaria.
John Bullinaria and Joseph Levy. 2007. Extract-ing semantic representations from word co-occurrence statistics: A computational study. Behavior Research Methods, 39:510–526.
Kai-min Chang, Tom Mitchell, and Marcel Just. 2011. Quantitative modeling of the neural representation of objects: How semantic feature norms can account for fMRI activation.NeuroImage, 56:716–727.
Linda L Chao, James V Haxby, and Alex Martin. 1999. Attribute-based neural substrates in temporal cortex for perceiving and knowing about objects. Nature neu-roscience, 2(10):913–919.
Kenneth Church and Peter Hanks. 1990. Word asso-ciation norms, mutual information, and lexicography.
Computational Linguistics, 16(1):22–29.
Stephen Clark. 2012. Vector space models of lexical meaning. In Shalom Lappin and Chris Fox, editors,
Handbook of Contemporary Semantics, 2nd edition. Blackwell, Malden, MA. In press.
Gabriella Csurka, Christopher Dance, Lixin Fan, Jutta Willamowski, and C´edric Bray. 2004. Visual cate-gorization with bags of keypoints. InIn Workshop on Statistical Learning in Computer Vision, ECCV, pages 1–22, Prague, Czech Republic.
Jia Deng, Wei Dong, Richard Socher, Lia-Ji Li, and Li Fei-Fei. 2009. Imagenet: A large-scale hierarchi-cal image database. InProceedings of CVPR, pages 248–255, Miami Beach, FL.
Russell A Epstein. 2008. Parahippocampal and ret-rosplenial contributions to human spatial navigation.
Trends in cognitive sciences, 12(10):388–396. Katrin Erk. 2012. Vector space models of word meaning
and phrase meaning: A survey. Language and Lin-guistics Compass, 6(10):635–653.
Melvyn A. Goodale and David Milner. 1992. Separate visual pathways for perception and action. Trends in Neurosciences, 15:20–25.
Kristen Grauman and Bastian Leibe. 2011.Visual Object Recognition. Morgan & Claypool, San Francisco. Peter Hagoort. 2005. On Broca, brain, and
bind-ing: a new framework. Trends in cognitive sciences, 9(9):416–423.
James Haxby, Ida Gobbini, Maura Furey, Alumit Ishai, Jennifer Schouten, and Pietro Pietrini. 2001. Dis-tributed and overlapping representations of faces and objects in ventral temporal cortex.Science, 293:2425– 2430.
Alexander Huth, Shinji Nishimoto, An Vu, and Jack Gal-lant. 2012. A continuous semantic space describes the representation of thousands of object and action cate-gories across the human brain. Neuron, 76(6):1210– 1224.
Nancy Kanwisher and Galit Yovel. 2006. The fusiform face area: a cortical region specialized for the percep-tion of faces.Philosophical Transactions of the Royal Society B: Biological Sciences, 361(1476):2109–2128. Nikolaus Kriegeskorte, Marieke Mur, and Peter Ban-dettini. 2008. Representational similarity analysis– connecting the branches of systems neuroscience.
Frontiers in systems neuroscience, 2.
Svetlana Lazebnik, Cordelia Schmid, and Jean Ponce. 2006. Beyond bags of features: Spatial pyramid matching for recognizing natural scene categories. In
Proceedings of CVPR, pages 2169–2178, Washington, DC.
Chee Wee Leong and Rada Mihalcea. 2011. Going beyond text: A hybrid image-text approach for mea-suring word relatedness. InProceedings of IJCNLP, pages 1403–1407.
Max Louwerse. 2011. Symbol interdependency in sym-bolic and embodied cognition. Topics in Cognitive Science, 3:273–302.
David G Lowe. 2004. Distinctive Image Features from Scale-Invariant Keypoints. International Journal of Computer Vision, 60:91–110.
Kevin Lund and Curt Burgess. 1996. Producing high-dimensional semantic spaces from lexical co-occurrence.Behavior Research Methods, 28:203–208. Bruce D McCandliss, Laurent Cohen, and Stanislas De-haene. 2003. The visual word form area: expertise for reading in the fusiform gyrus. Trends in cognitive sciences, 7(7):293–299.
Robert D McIntosh and Thomas Schenk. 2009. Two vi-sual streams for perception and action: Current trends.
Neuropsychologia, 47(6):1391–1396.
Earl K Miller, David J Freedman, and Jonathan D Wal-lis. 2002. The prefrontal cortex: categories, con-cepts and cognition. Philosophical Transactions of
the Royal Society of London. Series B: Biological Sci-ences, 357(1424):1123–1136.
Tom Mitchell, Svetlana Shinkareva, Andrew Carlson, Kai-Min Chang, Vincente Malave, Robert Mason, and Marcel Just. 2008. Predicting human brain activ-ity associated with the meanings of nouns. Science, 320:1191–1195.
Brian Murphy, Partha Talukdar, and Tom Mitchell. 2012. Selecting corpus-semantic models for neurolinguistic decoding. InProceedings of *SEM, pages 114–123, Montreal, Canada.
Mark Palatucci, Dean Pomerleau, Geoffrey Hinton, and Tom Mitchell. 2009. Zero-shot learning with seman-tic output codes. InProceedings of NIPS, pages 1410– 1418, Vancouver, Canada.
Marius V Peelen and Paul E Downing. 2005. Selectivity for the human body in the fusiform gyrus. Journal of Neurophysiology, 93(1):603–608.
Francisco Pereira, Greg Detre, and Matthew Botvinick. 2011. Generating text from functional brain images.
Frontiers in Human Neuroscience, 5(72). Published
online: http://www.frontiersin.org/
human_neuroscience/10.3389/fnhum.
2011.00072/abstract.
Alexander T Sack. 2009. Parietal cortex and spatial cog-nition.Behavioural brain research, 202(2):153–161. Hinrich Sch¨utze. 1997. Ambiguity Resolution in Natural
Language Learning. CSLI, Stanford, CA.
Carina Silberer and Mirella Lapata. 2013. Models of semantic representation with visual attributes. In Pro-ceedings of ACL, Sofia, Bulgaria.
Josef Sivic and Andrew Zisserman. 2003. Video Google: A text retrieval approach to object matching in videos. In Proceedings of ICCV, pages 1470–1477, Nice, France.
Peter Turney and Patrick Pantel. 2010. From frequency to meaning: Vector space models of semantics. Jour-nal of Artificial Intelligence Research, 37:141–188. N Tzourio-Mazoyer, B Landeau, D Papathanassiou,