Abstract— Consequently, an experimental research program has been conducted on many aspect and parameters to evaluate the performance and emissions characteristic of unmodified common-rail diesel engine operating with biodiesel. Conventional twin turbo V6 diesel engine has been used on this research where the modern technologies equipped to the engine including exhaust gas recirculation (EGR), variable geometry turbine (VGT) and common rail fuel injection systems. In this research report, the effect of boost air temperature has been investigated at low and part load as a key parameter that possibly affect the combustion of RME due to EGR operations, VGT as well as the change of charge air density. The results have been carefully revise and the analysis are includes in-cylinder pressure, rate of heat release, fuel injection parameters as well as emissions level. The overall results have shown that boost air temperature has significantly affected the performance as well as emissions of the engine especially at high load. The in-cylinder peak pressure is increase as boost air temperature increase resulted to increase NOx emissions.
Key words: Boost temperature, diesel engine, rapeseed methyl ester
I. INTRODUCTION
It is apparent that the engines power decreases as the air intake mass flow rate diminish. In diesel engine, supercharger or turbocharger is widely used to increase air flow rate to the engines, and hence the volumetric efficiency. Many researches have been conducted on the effect of charge temperature to diesel engine [1-3]. Moreover, the effect of charge air intake is extremely important to the recent development of HCCI engines worldwide [4-9]. The properties of air that affect the mass flow rate is among others is the density of air which is linked to the air temperature. The volumetric efficiency is increased as the charge air temperature reduces. However, the increase of charge air temperature is in another way could possibly improve the fuel vaporisation in engine cylinders. This is extremely important for the diesel engine operating with biodiesel. Many researches have been conducted to explain the effect of fuel vaporisation for biodiesel. Biodiesel is consists of the mono alkyl esters of vegetable oils and animal fats. The different in chemical structure demonstrates distinctive
Manuscript received March 2, 2010. Rizalman Mamat with Universiti Malaysia Pahang, 25000 Kuantan, Malaysia, Tel: 609-424 2303 e-mail: [email protected].
Nik Rosli Abdullah, Hongming Xu, Miroslaw L. Wyszynski, A. Tsolakis with University of Birmingham, B15 2TT Edgbaston, Birmingham, United Kingdom, e-mail: [email protected].
impacts on the chemical reaction pathways during ignition and combustion [10].
The increase of inlet temperature promoted to the reductions of in-cylinder trap mass (thermal trottling effect). Therefore, the capacity of oxygen and heat capacity of air charge significantly reduced. Many researches have been conducted on the effect of charge air inlet temperature on diesel engines. Maiboom et al. has conducted a series of experiment on inline-4 diesel engine[2]. The engine was equipped with cooled EGR system, common-rail injection system and VGT. The engine was operated with mineral diesel fuel at constant engine speed, EGR ratio and inlet boost pressure. The charge inlet temperature was varied from 20oC to 38oC. He concluded that the increase of inlet temperature at constant boost pressure results in a slight decrease of the ROHR. He suggests that at constant boost pressure, the fuel jet entrains less air with reduced in-cylinder gas density, resulting in a lower oxygen-fuel mixing therefore lower ROHR. Torregrosa et al. constructed a fully controlled diesel engine to study the influence of inlet air charge temperature on the performance and emissions of a diesel engine. The intake temperatures were varies but the coolant temperature was controlled to isolate the effect of cylinder walls temperature effect. The report concludes that the increase of intake temperature results to increase NOx emissions.
RME has a higher tendency to form fuel rich zones at low load conditions than the other fuels due to higher viscosity and fuel distillation curves [11]. In addition, RME has a possibility of poor fuel atomization and vaporization, due to higher density, kinematic viscosity and distillation temperature than those of diesel fuel [12]. A research conducted by Stovell on a spark ignited natural gas engine also suggest that the small change in air intake temperature have changed the engine response, performance as well as exhaust gas emissions [13]. He used to test with three different intake air temperatures (50oF, 80oF and 130oF) to evaluate their impact upon engine performance and emissions.
Therefore, this paper is intends to figure out this phenomenon and their effect on the progress of combustion quality as well as emissions on a conventional V6 diesel engine. The studies are focused on the details of engine response into the effect of boost temperature.
Effect of Boost Temperature on the Performance
and Emissions of a Common Rail Diesel Engine
Operating with Rapeseed Methyl Ester (RME)
II. EXPERIMENTAL SET-UP
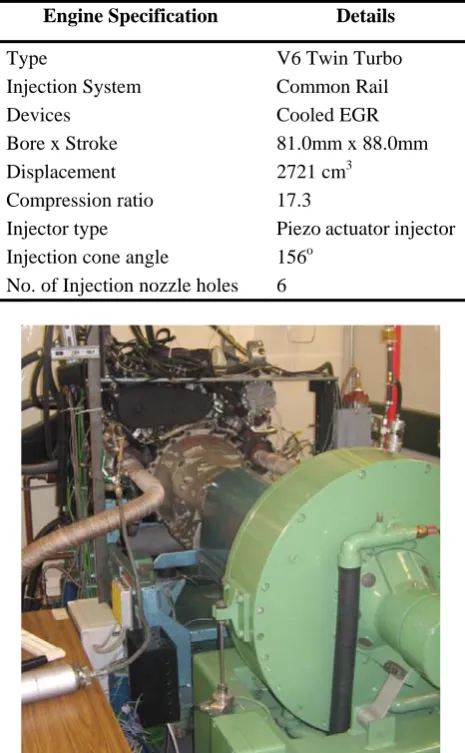
[image:2.595.308.552.73.253.2]The experimental work was performed on a V6 diesel engine. The engine was water-cooled, fitted with a high pressure direct fuel injection system from common rail and equipped with twin variable-geometry turbine (VGT) turbochargers and a cooled exhaust gas recirculation (EGR) system. Details of the engine are described in Table 1. Figure 1 shows the photograph of the test engine used in this study. An eddy-current water-cooled Schenck dynamometer model W230 with a series S2000 control system was used to load the engine. The in-cylinder pressure was measured by piezometric glow-plug high pressure transducers supplied by AVL, with model number AVL GU13G wired to AVL Piezo Amplifiers model 3066A03 where pressure was read at crankshaft positions recorded by a shaft encoder. The piezo sensor used has a sensitivity of 15pC/bar. Both data series (pressure and crank angle degrees) were recorded through a National Instrument data acquisition system NI PCI-6023E installed in a Windows XP - based PC. Pressure was measured in cylinders 2 and 5 as depicted in Figure 2. Temperature was measured in all exhaust manifolds by k-type thermocouples with data recorded by a second National Instrument data acquisition system NI PCI-6224 and monitored through a LabVIEW-coded graphic user interface.
Table 1. Specification of test engine
Engine Specification Details
Type V6 Twin Turbo
Injection System Common Rail
Devices Cooled EGR
Bore x Stroke 81.0mm x 88.0mm
Displacement 2721 cm3
Compression ratio 17.3
Injector type Piezo actuator injector Injection cone angle 156o
No. of Injection nozzle holes 6
Figure 1. Photograph of test engine
Figure 2. Schematic diagram of a V6 engine system
An off-line steady state analysis based on in-cylinder pressure was carried out using an in-house LabVIEW code and the analysis included peak pressure, indicated power, indicated mean effective pressure (IMEP) and coefficient of variation of IMEP. Furthermore, the analysis of mass fraction burn, rate of heat release, brake specific fuel consumption (bsfc), thermal efficiency and ignition delay were performed to evaluate the overall parameters of combustion.
The analysis of emissions data, was carried out using an AVL CEB200 analyser and recorded in Excel file. The exhaust gas was sampled at 30cm downstream of the turbine exit. The measurement methods included non-dispersive infrared method (NDIR) for CO and CO2, heated flame ionization detector (HFID) for total unburned hydrocarbon and heated chemiluminescence detector (HCLD) for nitrogen oxides.
[image:2.595.53.286.395.772.2]The engine was controlled by an ETAS unit. It was operated with the boost air temperature and fuel temperature kept constant at 35oC. The EGR rate suitable for specific engine operating conditions was controlled by the Engine Management System (EMS) and the data was recorded by INCA software in a portable computer, together with other parameters from the EMS such as start of injection, fuel injection rate, boost air pressure, engine speed and EGR set-point.
Table 2. Boost temperature in air intake systems
Mode BMEP (bar)
Boost temperature (oC)
7.8 3.1 35
7.9 3.1 40
7.10 3.1 45
7.11 4.7 35
7.12 4.7 40
[image:2.595.309.543.649.761.2]Table 2 shows the details of test condition. The experiments have been conducted on the Lion V6 engine operated with ULSD and RME. The EGR operation was switch off to isolated the effect of dilution and temperature of exhaust gas to the air intake. The engine was operated at low load (BMEP 3.1 bar) and part load (BMEP 4.7 bar).
The engine was fuelled with biodiesel (RME) and ULSD. Both fuels were supplied by Shell Global Solutions UK, details of the properties of the test fuels are summarized in Table 3. The main differences in comparing RME with ULSD are (i) an increase in cetane number by 1.5%, (ii) an increase in density by 6.8%, (iii) an increase in viscosity by nearly 81%, (iv) a decrease in lower calorific value (LCV) by 8.7% and (v) a large decrease in sulfur content by 89.1%.
Table 3. Fuel properties
Property ULSD RME
Cetane number 53.9 54.7
Density at 15oC [kg/m3] 827.1 883.7 Viscosity at 40oC [cSt] 2.467 4.478
50% distillation point (oC) 264 335 90% distillation point (oC) 329 342
LCV [MJ/kg] 42.7 39.0
Sulfur [mg/kg] 46 5
Molecular mass (equivalent) 209 296
C (% wt.) 86.5 77.2
H (% wt.) 13.5 12.0
O (% wt.) - 10.8
The engine operating conditions are based on the NEDC (New European Driving Cycle). The experiment was conducted under controlled environment. Air temperature was controlled between 23C and 27C and the relative humidity was measured by RH sensor and recorded by Window based PC. Air inlet temperature and atmospheric pressure were measured and calculated to comply with the test validity as explained in Directive 1999/96/EC, 2000 [14].
III. RESULT AND DISCUSSIONS
Figure 3 (a) and (b) show fuel flow rate of a V6 diesel engine operating with RME and ULSD at low load and part load respectively. At low load, the fuel flow rate is increased as boost air temperature increase. At part load, the fuel flow rate is decreased as boost air temperature increases. Figure 3 clearly shows that the fuel flow rate is slightly higher for RME as compared to ULSD for all test conditions. Low heating value for RME is 8.7% lower as compared to ULSD, therefore the ECU commanded the fuel injector to inject more fuel to gain similar brake torque to ULSD.
50 55 60 65 70
LT1 LT2 LT3 Mode
F
uel
f
low
[
g/
m
in]
75 80 85 90 95
PT1 PT2 PT3
Mode
F
u
el
f
low
[
g/
m
in]
RME ULSD
(a) (b) Figure 3 Fuel flow rate (a) low load, (b) part load
Figure 4 shows that the engine operating with ULSD consumed higher air flow rate at all engine load and boost air temperature. Both fuels show similar trend where the air fuel ratio is reduced as boost temperature decreases. However, the air flow rate reduced significantly as boost temperature increases for ULSD.
2000 2100 2200 2300 2400 2500
LT1 LT2 LT3
Mode
A
ir
fl
o
w
[g
/m
in
]
2200 2300 2400 2500 2600
PT1 PT2 PT3
Mode
Ai
r fl
o
w
[g
/m
in
]
RME ULSD
(a) (b) Figure 4 Air flow rate (a) low load, (b) part load
Figure 5 shows the engine excess air ratio (lambda) as a consequences of engine load and boost air temperature. It shows that the diesel engine operated with low lambda when RME is used to fuel the engine. Figure 5 also shows that the lambda for RME is almost constant at 2.6 and 2.2 for low load and part load respectively. The lambda is reduced for ULSD at low load, when boost air temperature increased. However when the engine operating at part load, the lambda is slightly increased as boost air temperature increases from 35oC to 45oC.
0 1 2 3 4
LT1 LT2 LT3
Mode
Lam
b
da
0 1 2 3
PT1 PT2 PT3
Mode
La
m
bd
a
RME ULSD
(a) (b) Figure 5 Engine excess air ratio (a) low load, (b) part load
46.0 46.5 47.0 47.5
LT1 LT2 LT3 Mode In jec ti o n pr es s ur e [ M p a] 47 48 49 50 51 52
PT1 PT2 PT3
Mode In je c ti o n p re s s u re [M pa ] RME ULSD (a) (b) Figure 6 Fuel injection pressure (a) low load, (b) part load
Figure 7 shows the bsfc for the engine operating with RME and ULSD as consequences of boost air temperature. It shows that the bsfc is higher for RME at all test conditions. At low load, bsfc is increased as boost air temperature increases. At part load, the bsfc is decreased as boost air temperature increases. Figure 7 also shows that the bsfc is higher at low load as compared to part load for both fuels. The bsfc for ULSD changes significantly when boost air temperature increases as compared to RME.
280 300 320 340 360 380 400
LT1 LT2 LT3
Mode b s fc [g /k W h ] 260 280 300 320 340
PT1 PT2 PT3
Mode b s fc [g /k W h ] RME ULSD (a) (b) Figure 7 Brake specific fuel consumption (a) low load, (b)
part load
Figure 8 shows the engine efficiency as consequences of engine load and boost air temperature. Figure 8 shows that ULSD operated at higher engine efficiency as compared to RME. This is due to low energy content for RME as compared to mineral diesel. At low load, the engine efficiency reduced as boost air temperature increases from 35oC to 45oC. At part load, the engine efficiency is increased as boost air temperature increases. The engine efficiency change significantly over the boost air temperature for ULSD as compared to RME both at low load, and part load.
22 23 24 25 26 27 28 29
LT1 LT2 LT3 Mode E ngi n e e ff ic ien c y [ % ] 26 27 28 29 30 31 32
PT1 PT2 PT3
Mode E ngi ne ef fi c ienc y [ % ] RME ULSD (a) (b) Figure 8 Engine efficiency (a) low load, (b) part load
IV. EXHAUST GAS EMISSIONS
Figure 9 shows the exhaust gas emission produces from the combustion of RME and ULSD at low load and part load. It clearly shows that the RME produces higher emissions of NOx as compared to ULSD. This is in agreement with many reports in literatures when the engine operating with biodiesel [10-11, 15-19]. The engine produces higher NOx at part load as compared to low load for both fuels. The emission of NOx is slightly increased as boost air temperature increases for ULSD but considerably level for RME. 2.0 2.5 3.0 3.5 4.0
LT1 LT2 LT3
Mode N O x [g /kW h ] 2.0 2.5 3.0 3.5 4.0 4.5 5.0
PT1 PT2 PT3
Mode N O x [g /k W h ] RME ULSD (a) (b) Figure 9 Exhaust emission of NOx (a) low load, (b) part load
Figure 10 shows the exhaust gas emission of CO at low load and part load when the boost air temperature is increases. At low load, the CO is increased as boost air temperature increases, whereas at part load, the CO decreased as boost air temperature increases. Generally, the RME produces less CO as compared to ULSD at 35oC but it produces significantly higher CO when boost air temperature is increase more than 35oC.
0 1 2 3 4 5
LT1 LT2 LT3
Mode CO [ g /k W h ] 0 1 2 3
PT1 PT2 PT3
Mode C O [ g /kW h ] RME ULSD (a) (b) Figure 10 Exhaust emission of CO (a) low load, (b) part load
Figure 11 shows the emission of THC at low load and part load when the engine operating with RME and ULSD. It clearly shows that the engine operating with RME produces less THC as compared to ULSD. The THC is slightly increased when boost air temperature increases for both fuels. 0.0 0.5 1.0 1.5 2.0
LT1 LT2 LT3 Mode T H C [g /k W h ] 0.0 0.5 1.0 1.5
PT1 PT2 PT3 Mode T H C [g /k W h ] RME ULSD (a) (b) Figure 11 Exhaust emission of THC (a) low load, (b) part
V. CONCLUSION
In this article, the effect of boost temperature of the intake air is discussed in detail. It can be concluded that the increase of inlet temperature led to the reductions of in-cylinder trap mass and therefore reduced the oxygen and heat capacity of the charged air. This has resulted in an increase of bsfc at low load but slightly lowered the bsfc at part load when the charge air temperature is increased. The exhaust gas emissions are slightly increased for ULSD but remain leveled for RME. The emission of CO is decreased and the emission of THC is increased when the charge air temperature increases.
ACKNOWLEDGMENT
The authors want to thank to the Government of Malaysia for PhD. scholarship awarded to Mr. Rizalman Mamat and Mr. Nik Rosli Abdullah. Jaguar Car Ltd for technical support and Shell Global Solutions (UK) for the provision of fuels are gratefully acknowledged. The authors are grateful to the Future Power Group members of Birmingham University for cooperation in this study.
REFERENCES
[1] Beatrice, C., G. Avolio, and C. Guido, Experimental Analysis of the Operating Parameter Influence on the application of Low Temperature Combustion in the Modern Diesel Engines. SAE Technical Paper 2007-01-1839, 2007.
[2] Maiboom, A., et al., Various Effects of EGR on Combustion and Emissions on an Automotive DI Diesel Engine : Numerical and Experimental Study. 2007-01-1834, 2007.
[3] Torregrosa, A.J., et al., Experiments on the Influence of Inlet Charge and Coolant Temperature on Performance and Emissions of a DI Diesel Engine. Experimental Thermal and Fluid Science, 2006. 30(7): p. 633. [4] Iida, M., et al., The Effect of Intake Air Temperature, Compression Ratio and Coolant Temperature on the Start of Heat Release in an HCCI (Homogeneous Charge Compression Ignition) Engine. SAE Technical Paper 2001 01 1880/4278, 2001.
[5] Sjöberg, M. and J.E. Dec, Combined Effects of Fuel-Type and Engine Speed on Intake Temperature Requirements and Completeness of Bulk-Gas Reactions for HCCI Combustion. SAE Technical Paper 2003-01-3173, 2003.
[6] Iverson, R.J., et al., The Effects of Intake Charge Preheating in a Gasoline-Fueled HCCI Engine. SAE Technical Paper 2005-01-3742, 2005.
[7] Shibata, G. and T. Urushihara, The Interaction Between Fuel Chemicals and HCCI Combustion Characteristics Under Heated Intake Air Conditions. SAE Technical Paper 2006-01-0207, 2006.
[8] Dubreuil, A., F. Foucher, and C. Mounaïm-Rousselle, Effect of EGR Chemical Components and Intake Temperature on HCCI Combustion Development. SAE Technical Paper 2006-32-0044, 2006.
[9] Andreae, M.M., et al., Effect of Air Temperature and Humidity on Gasoline HCCI Operating in the Negative-Valve-Overlap Mode. SAE Technical Paper 2007-01-0221, 2007.
[10] Szybist, J.P., et al., Biodiesel Combustion, Emissions and Emission Control. Fuel Processing Technology 88 (2007) 679–691, 2007. [11] Horn, U., et al., Detailed Heat Release Analyses with Regard to
Combustion of RME and Oxygenated Fuels in an HSDI Diesel Engine. SAE Technical Paper 2007-01-0627, 2007.
[12] Kawano, D., et al., Application of Biodiesel Fuel to Modern Diesel Engine. SAE Technical Paper 2006-01-0233, 2006.
[13] Stovell, C., et al., Effect of Reduced Boost Air Temperature on Knock Limited Brake Mean Effective Pressure (BMEP). SAE Technical Paper 2001-01-3682, 2001.
[14] The approximation of the laws of the Member States relating to measures to be taken against the emission of gaseous and particulate
pollutants from compression ignition engines for use in vehicles, and the emission of gaseous pollutants from positive ignition engines fuelled with natural gas or liquefied petroleum gas for use in vehicles and amending Council Directive 88/77/EEC Official Journal of the European Union, 2000. Directive 1999/96/EC (2000)(L44: 1 - 155). [15] Rizalman, M., et al., Effect of Exhaust Gas Temperature on Engine
Performance and Emissions of a Conventional V6 Diesel Engine Operating on Biodiesel & Diesel Fuel with Exhaust Gas Recirculation (EGR), in Proceedings of United Kingdom-Malaysia Engineering Congress. 2008: London.
[16] Lapuerta, M., O. Armas, and R. Ballesteros, Diesel Particulate Emissions from Biofuels Derived from Spanish Vegetable Oils. SAE Technical Paper 2002-01-1657, 2002.
[17] Labeckas, G. and S. Slavinskas, The Effect of Rapeseed Oil Methyl Ester on Direct Injection Diesel Engine Performance and Exhaust Emissions. Energy Conversion and Management 47 (2006) 1954-1967, 2006.
[18] Senatore, A., et al., A Comparative Analysis of Combustion Process in D.I. Diesel Engine Fueled with Biodiesel and Diesel Fuel. SAE Technical Journal 2000-01-0691, 2000.