Original Article
Exploring the multiple miliary osteoma cutis-related
genes by gene expression analysis
Jiaxiao Shi1*, Ang Li2*, Zhijian Wei1*, Yang Liu1, Cong Xing1, Hongyu Shi1, Han Ding1, Dayu Pan1, Guangzhi
Ning1, Shiqing Feng1
1Department of Orthopaedics, Tianjin Medical University General Hospital, Tianjin Neurological Institute, Key Laboratory of Post-Neuroinjury Neuro-Repair and Regeneration in Central Nervous System, Ministry of Education and Tianjin City, No. 154 Anshan Road, Heping District, Tianjin 300052, PR China; 2Department of Orthopedics, Henan Provincial People’s Hospital, Zhengzhou, PR China. *Equal contributors.
Received January 30, 2018; Accepted October 12, 2018;Epub November 15, 2018; Published November 30, 2018
Abstract: Objective: The aim of this study was to identify potential genes associated with formation of bone focus in the dermis and subcutis in cases of multiple miliary osteoma cutis (MMOC) through web-available microarrays. Ma-terials and methods: GSE48129 was downloaded from the Gene Expression Omnibus (GEO), and it contained three patients and two controls. The ten samples came from the patients’ osteoma affected skin area and unaffected healthy skin area. Differentially expressed genes (DEGs) between the affected group and the unaffected groups were identified by |logFC| > 1 and P < 0.05. GO and KEGG pathway enrichment analysis were conducted for DEGs by DAVID Functional Annotation Bioinformatics Microarray Analysis. Further, the PPI (protein-protein interaction) network was constructed by the STRING database. Result: We identified 340 upregulated genes and 265 down-regulated genes in the MMOC sample. The 605 genes mainly act on G-protein-coupled receptor activity, protein ubiquitination, apoptotic process, protein binding by GO enrichment analysis, and KEGG pathway enrichment, which showed that genes were significantly involved in metabolic pathways and calcium signaling pathways. In the PPI network, ACTA2, PRKACG and PIK3CG appeared at higher degrees. Conclusions: The identified genes may provide a new direction on research focusing on bone formation in MMOC and will lay the foundation for future research.
Keywords: Multiple miliary osteoma cutis (MMOC), differentially expressed genes, microarray, PPI network
Introduction
Osteoma cutis is a benign dermatosis that occurs primarily in the dermis and subcutane-ous tissue. It is characterized by imaging and histological confirmation of the formation of bone deposits [1, 2]. Based on these features, patients are classified into four groups: (1) sin-gle nodule, (2) plate-like lesion, (3) sinsin-gle or multiple depth lesion, trans-epidermal, and (4) disseminated lesions of various sizes [1]. Ana- lysis of the cases in the previous articles shows that the disease frequently occurs in women and is mostly located on the face, scalp and other specific places [3, 4]. Irrespective of the existence of other existing skin diseases at the site, we divided osteoma into primary and sec-ondary [5]. Multiple miliary osteoma cutis (MMOC) is a type of osteoma cutis, first report-ed by Virchow in 1864, and it is easily confusreport-ed
with other diseases. It is usually expressed as hard papule on the skin surface [6]. MMOCs are generally visible on patients or are found during the process of diagnosing and treating other issues such as a toothache, so the real epidemiological statistics may not accurately reflect instances of the disease [3]. In the course of disease progression, the size and number of pimples gradually increase, causing discomfort to the face [7]. Therefore, it is nec-essary to explore the pathogenesis or treat-ment of MMOC.
(FOP), which are all caused by the mutation in the GNAS gene or ACVR1 genes. Mutation of the GNAS reduces the protein Gas, and then Gas induces ossification of the human mesen-chymal stem cells. However, unlike GNAS, ACVR1 encodes the BMP4 receptor found in the heterotopic bone [7]. Secondary MMOC occurs after acne, trauma, scar, etc. and is related to chronic inflammation. Some doctors use tretinoin and tetracycline therapy [5, 8]. In pathogenesis, histological samples of the biop-sy exhibit smaller bone, surrounded by some lymphocytes, fibrovascular and fewer osteo-cytes [7]. Currently, ultrasound examinations reveal the bright echoes under permanent focus, and CT scans can confirm the multiple high-density lesions [1, 9]. Some reports men-tion that there are two possible presentamen-tions of the formation of the bone in this disease. One theory illustrates that primitive mesenchy-mal cells differentiate into osteoblasts and then migrate to inappropriate places. However, only a few people support this point of view. Another theory is that the bone is produced during the transformation of mesenchymal cells into osteoblasts [10].
To explore the key genes in the pathogenesis of MMOC, skin biopsies from three patients and two controls were used to analyze the expression profile. In this study, microarray data had been selected for differential expres-sion genes (DEGs). Subsequently, DEGs were manipulated by gene ontology (GO) and Kyoto Encyclopedia of Genes and Genomes (KEGG) pathway enrichment analysis. Finally, we used the Search Tool for the Retrieval of Interacting Genes (STRING) database to map the protein-protein interaction (PPI) network, aiming to determine the role of DEGs in the development of MMOC.
Materials and methods
Data resource
Gene expression of GSE48129 was download-ed from the Gene Expression Omnibus of NCBI, which was performed on the Affymetrix Human Genome U133 Plus 2.0 Array platform. In the expression profile, they compared patients’ osteoma-affected skin areas to both unaffect-ed healthy skin areas and skin from other healthy controls. Next, the gene expression profile was obtained for further analysis.
Identification of DEGs
First, the data were analyzed with the GE- O2R, the Gene Expression Omnibus online tool (http://www.ncbi.nlm.nih.gov/geo/geo2r/). Next, we selected ‘Define groups’ and assigned five samples to each group named the ‘affect-ed group’ and ‘unaffect‘affect-ed group’. Third, we selected the ‘TOP250’ button for calculation usicngs. Fourth, the results were presented as genes tables sorted by significance and we then saved the file [11]. Differentially expressed genes (DEGs) were determined by |logFC| of no less than 1 and t-tests with P < 0.05 [12, 13].
GO Terms and KEGG pathways analysis
The DEGs analysis of the GO [14] and KEGG pathways [15] were performed by DAVID (http:// david.abcc.ncifcrf.gov/). We limited the p-value < 0.05 and the number of genes ≥ 2 to statisti-cally significant. DAVID is an essential founda-tion for the analysis of high throughput gene function and helps by providing the biological characteristics on genes [16].
Construction of PPI Network and module analysis
STRING (http://string.embl.de/) [15] was ap- plied to construct PPI networks based on sig-nificantly up- and downregulated DEGs follow- ed by functional interactions. Then, the data from STRING was entered in the Cytoscape software (version 3.5.1; www.cytoscape.org). The plug-in Molecular Complex Detection (MC- ODE) was used to screen the modules of PPI network in Cytoscape [13]. The inclusion crite-ria are as follows: MCODE score > 3, number of nodes > 4.
Samples
From the summary on the GSE48129 content, we were able to study the skin biopsies contain-ing affected skin area and unaffected healthy skin area that were taken from three patients and two controls.
Result
DEG Identification by microarray expression profiling
GEO2R, a web page analysis program, to ana-lyze the DEGs. Based on the initial data, we included the inclusion criteria: P < 0.05 and |logFC| ≥ 1.0. Finally, 605 genes were select-ed, of which 340 were upregulatselect-ed, and 265 were downregulated.
Go term enrichment analysis
All DEGs were collated and uploaded to the DAVID to pick out the representative GO cate-gories and KEGG pathways. The GO analysis provided results in three parts: biological pro-cesses (BP), molecular function (MF) and cell component (CC). In part one (BP), upregulat- ed DEGs were mainly enriched in epidermal development, protein ubiquitination, negative regulation of peptidase activity, etc. The down-regulated DEGs were mainly enriched by the negative regulation of the intrinsic apoptotic signaling pathway, ossification, innate immune response, etc. In part two (MF), upregulated DEGs were mainly enriched in NADPH binding, apoptotic processes, protein binding, etc. The downregulated DEGs were mainly enriched in
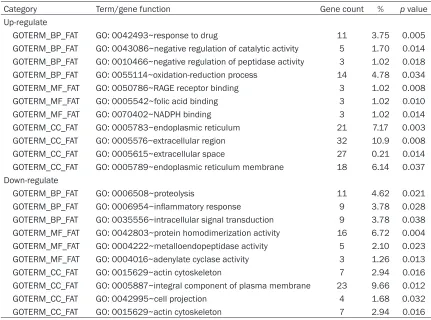
calcium channel activity, protein homodimer-ization activity, etc. In part three (CC), upregu-lated DEGs were mainly rich in protease, bind-ing structural molecule activity, endoplasmic reticulum, and ATP binding, and downregulated DEGs have effects on the actin cytoskeleton and postsynaptic membrane (Table 1).
KEGG pathway analysis
Table 2 includes the enrichment pathways for upregulation and downregulation of DEGs iden-tified by DAVID. Upregulated DEGs were mainly concentrated in metabolic pathways and in another weakly relative pathways: fatty acid degradation and purine metabolism. However, the downregulated DEGs were enriched in cal-cium and cAMP signaling pathways. They also participated in other pathways, though these are not mentioned in detail.
Module screening from the PPI network
We uploaded the data to the STRING database, which is able to construct the PPI network. Table 1. GO analysis of DEGs in MMOC
Category Term/gene function Gene count % p value Up-regulate
GOTERM_BP_FAT GO: 0042493~response to drug 11 3.75 0.005 GOTERM_BP_FAT GO: 0043086~negative regulation of catalytic activity 5 1.70 0.014 GOTERM_BP_FAT GO: 0010466~negative regulation of peptidase activity 3 1.02 0.018 GOTERM_BP_FAT GO: 0055114~oxidation-reduction process 14 4.78 0.034 GOTERM_MF_FAT GO: 0050786~RAGE receptor binding 3 1.02 0.008 GOTERM_MF_FAT GO: 0005542~folic acid binding 3 1.02 0.010 GOTERM_MF_FAT GO: 0070402~NADPH binding 3 1.02 0.014 GOTERM_CC_FAT GO: 0005783~endoplasmic reticulum 21 7.17 0.003 GOTERM_CC_FAT GO: 0005576~extracellular region 32 10.9 0.008 GOTERM_CC_FAT GO: 0005615~extracellular space 27 0.21 0.014 GOTERM_CC_FAT GO: 0005789~endoplasmic reticulum membrane 18 6.14 0.037 Down-regulate
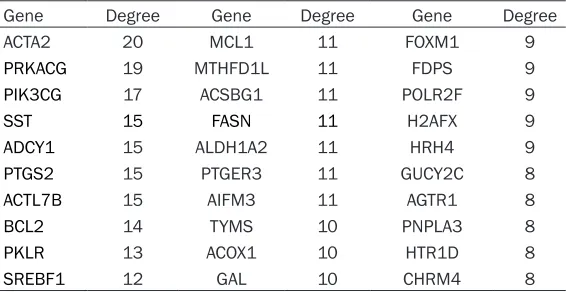
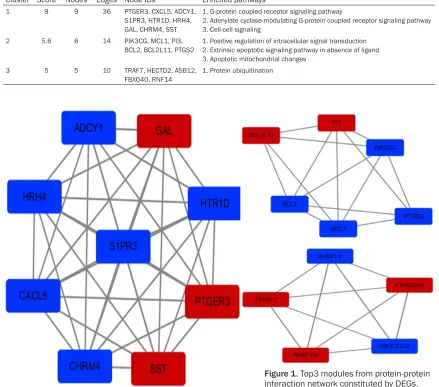
Next, the information of PPI network was intro-duced in the Cytoscape software, and we ob- tained some nodes of each degree (Table 3). In addition, we used the MCODE analysis nod- es and edges that were given restrictions. Finally, we selected the top 3 modules and high degree genes for analysis. The genes from module 1 showed the relationship with G pro-tein-coupled receptor signaling pathways; mod-ule 2 related to apoptotic signaling pathways; module 3 was associated with the protein ubiq-uitination (Table 4; Figure 1).
Discussion
MMOC is a rare disease reported in dermatol-ogy, which brings concern to patients. The relat-ed literature has reportrelat-ed some methods for treating the disease [9]. Treatment methods include retinoids, tretinoin, tetracycline and estrogens, which were effective against inflam-mation, but the curative effects were not good [17]. More traumatic treatment methods, such as the needle microincision, YAG or CO2 lasers are effective, but they also irritated the skin [8,
PIK3CG, SST, ADCY1, PTS2, ACTL1B, Bcl2, PKLR and SREBF1. ACTA2 was the most high- ly connected. ACTA2 (Alpha 2 actin, smooth muscle), an epithelial-mesenchymal transition-associated gene, was involved in cell motility, structure and integrity, and it also influenc- ed the migration and invasion of tumor cells [18]. Few reports have described the ACTA2’s function in bone metabolism. Benjamin H. Mullin reported, in the osteoclast-like cells and osteoblast-like cells, ACTA2 might be regulated by the RhoA signaling pathway [19]. Further- more, ACTA2 is the main expression protein of blood vessels in the plaque-deposited Alzhei- mer’s mouse model which may be associated with CD105 positive cells that were mentioned by initial researcher [20]. In addition, as the marker of osteoprogenitor cells, which undergo osteogenic differentiation induced by BMP-2 in vivo and in vitro [21], and α-SMA-positive MSCs exhibited differentiation potential limit- ed to osteogenesis [22]. The second gene, PRKACG, which encodes the cAMP-dependent protein kinase catalytic subunity, is usually cor-Table 2. KEGG pathway analysis of DEGs in MMOC
Pathway ID Name Gene count % p value Up-regulate
hsa01100 Metabolic pathways 31 10.58 0.0002 hsa00561 Glycerolipid metabolism 5 1.70 0.006 hsa00230 Purine metabolism 8 2.73 0.007 hsa00071 Fatty acid degradation 4 1.37 0.019 Down-regulate
[image:4.612.91.373.83.231.2]hsa04024 cAMP signaling pathway 9 3.78 0.0005 hsa04020 Calcium signaling pathway 7 2.94 0.006 hsa05200 Pathways in cancer 9 3.78 0.03 hsa04015 Rap1 signaling pathway 6 2.52 0.046
Table 3. Degree of differentially expressed genes in the protein-protein network
Gene Degree Gene Degree Gene Degree ACTA2 20 MCL1 11 FOXM1 9
PRKACG 19 MTHFD1L 11 FDPS 9
PIK3CG 17 ACSBG1 11 POLR2F 9
SST 15 FASN 11 H2AFX 9
ADCY1 15 ALDH1A2 11 HRH4 9
PTGS2 15 PTGER3 11 GUCY2C 8
ACTL7B 15 AIFM3 11 AGTR1 8
BCL2 14 TYMS 10 PNPLA3 8
PKLR 13 ACOX1 10 HTR1D 8
SREBF1 12 GAL 10 CHRM4 8
9]. Understanding the molecu-lar pathogenesis has impor-tant implications for better treatment options.
In the MMOC samples, we identified 340 upregulated and 265 downregulated gen- es. The GO analysis showed that the upregulated DEGs were mainly involved in pro- tein phosphorylation, apoptot-ic processes and ATP bind- ing. Downregulated DEGs were mainly involved in calcium channel activity, protein bind-ing and innate immune res- ponse. Additionally, the KEGG analysis supported the Wnt signaling pathway, pathways in cancer, the PI3K-Akt sig- naling pathway and the MAPK signaling pathway. These func-tions and pathways were cor-related with reports of the bone and cell proliferation and apoptosis.
[image:4.612.91.374.277.423.2]related with platelet-associated disease [23, 24]. Zhang S reported that it might affect the regulation of cell function and improve prolifer-ation through NF-rB pathway [25]. The third gene, PIK3CG, plays a key role in the PI3K sig-naling pathway. PI3k-Akt/PKB is a pathway involved in cell survival, proliferation and metastasis, and PI3K/Akt/mTOR is relevant for psoriasis [26]. PIK3CG as a direct downstream target of miR-502 in hepatocellular carcinoma cells interacts with G protein-coupled recep-tors during the proliferation of hepatocellular carcinoma cells [27]. Additionally, PIK3CG ubiq-uitination occurring during apoptosis in cervi-cal cancer cells is mediated through the PIK3 pathway and is also related to the formation of carotid plaques [28, 29]. Apoptosis of
osteo-blasts can be regulated by the VDR/PI3K/Akt survival pathway [30]. SST is a regulatory pep-tide and has an anti-proliferative and pro-apop-totic effects [31, 32]. It has 5 receptors that are typical G-protein-coupled receptors that act through the MAPK pathway or methylation in the cancer [33]. ADCY1 is also mediated by G-protein-coupled receptors in cell growth and is an isoform of adenylyl cyclase that synthetiz-es cAMP. cAMP plays an extended role in cell functions as a second messenger [34]. In the proteomic analysis of osteosarcoma tissue and bone tumors, ADCY1 is downregulated [35]. The PTGS2 gene encodes the cyclo-oxygen-ase2 (COX2), which mainly induces the inflam-matory response. Inhibiting COX2 blocks the mitogenic effect in osteoblasts, which metasta-Table 4. Top3 modules from Protein-protein interaction network constituted by DEGs and the enriched pathways respectively
Cluster Score Nodes Edges Node IDs Enriched pathways
1 9 9 36 PTGER3, CXCL5, ADCY1,
S1PR3, HTR1D, HRH4, GAL, CHRM4, SST
1. G-protein coupled receptor signaling pathway
2. Adenylate cyclase-modulating G-protein coupled receptor signaling pathway 3. Cell-cell signaling
2 5.6 6 14 PIK3CG, MCL1, PI3,
BCL2, BCL2L11, PTGS2 1. Positive regulation of intracellular signal transduction 2. Extrinsic apoptotic signaling pathway in absence of ligand 3. Apoptotic mitochondrial changes
3 5 5 10 TRAF7, HECTD2, ASB12,
FBXO40, RNF14
1. Protein ubiquitination
[image:5.612.87.526.104.491.2]size to bone and growth in cancer [36-38]. BMP-2 can regulated COX-2 to influence the for-mation of osteoclast 10334922. ACTL7B is an actin-like gene of ARP family involving similar cellular processes has been found in the testis and prostate. It has a site for cAMP/cGMP-dependent phosphorylation [39]. Bcl2, which is overexpressed in the osteoblast, inhibits cell differentiation [40]. However, in the osteoclast, Bcl2 plays the anti-apoptotic role [41], so down-regulation of the Bcl2 can promote the bone formation. PKLR mainly encodes pyruvate kinase, the lack of which leads to hereditary nonspherocytic hemolytic anemia [42]. In addi-tion, PKLR can accumulate the glutathione and affect processes related to the migration of colon cancer [43]. SREBP transcription factors are major regulators of lipid metabolism and are closely related to cell growth and induces epithelial-mesenchymal transition [44-46]. For other genes, the most upregulated are IGHV4-31, IGHM, IGHG2, and IGHG1, which are immu-noglobulin-related genes that may be associat-ed with secondary MMOC. The most down- regulated gene, FOXC2, is a transcriptional reg-ulator of intermediate transformation during developmental epithelial-mesenchymal transi-tion (EMT) processes, which regulates the expression of α-SMA and vimentin and affects cell migration and invasion [47, 48]. More importantly, there are articles demonstrating that Foxc2 stimulates osteoblast differentia-tion in mesenchymal and preosteoblasts [49]. Conclusions
Our results highlight the importance of DEGs, which may highlight some important elements of the MMOC, with some being related to the tumor and some being related to G-protein-coupled receptors. G-protein α can induce the osteoblastic metaplasia of mesenchymal cells [7]. New genes have been found to be related to MMOC, but the function of these genes remains to be elucidation. These discoveries may provide hope outside of the traditional the-ory for treatment.
Acknowledgements
The present study was supported by the Sta- te Key Program of National Nature Science Foundation of China (grant No. 81330042), International Cooperation Program of Nation- al Natural Science Foundation of China (81-
620108018), National Natural Science Fo- undation of China (81472070, 81772342), Na- tional Natural Science Foundation of China (81702147).
Disclosure of conflict of interest
None.
Address correspondence to: Shiqing Feng and Jingcheng Sun, Department of Orthopaedics, Tian- jin Medical University General Hospital, No. 154 Anshan Road, Heping District, Tianjin 300052, PR China. Tel: +8602288366139; Fax: +8602288- 366139; E-mail: [email protected] (SQF); [email protected] (JCS)
References
[1] Safi Y, Valizadeh S, Vasegh S, Aghdasi MM, Shamloo N and Azizi Z. Prevalence of osteoma cutis in the maxillofacial region and classifica-tion of its radiographic pattern in cone beam CT. Dermatol Online J 2016; 22.
[2] Caravaglio JV, Gupta R and Weinstein D. Multi-ple miliary osteoma cutis of the face associat-ed with albright herassociat-editary osteodystrophy in the setting of acne vulgaris: a case report. Der-matol Online J 2017; 23.
[3] Caliskan A and Celenk P. Imaging a dermatosis with dental radiographs: a case report of facial osteoma cutis. Quintessence Int 2016; 47: 705-709.
[4] Painsi C, Tarmann R, Georg Wurtz F, Malle P, Wolf P, Hugel R and Lange-Asschenfeldt B. Multiple miliary osteoma cutis of the scalp. J Dtsch Dermatol Ges 2015; 13: 1185-1187. [5] Ma HJ, Jia CY, Yang Y, Song LJ, Hu R and Li TH.
Primary multiple miliary osteoma cutis: an un-usual Chinese case. Int J Dermatol 2014; 53: 73-75.
[6] Kim SY, Park SB, Lee Y, Seo YJ, Lee JH and Im M. Multiple miliary osteoma cutis: treatment with CO(2) laser and hook. J Cosmet Laser Ther 2011; 13: 227-230.
[7] Myllyla RM, Haapasaari KM, Palatsi R, Ger-main-Lee EL, Hagg PM, Ignatius J and Tuuk-kanen J. Multiple miliary osteoma cutis is a distinct disease entity: four case reports and review of the literature. Br J Dermatol 2011; 164: 544-552.
[8] Cohen AD, Chetov T, Cagnano E, Naimer S and Vardy DA. Treatment of multiple miliary osteo-ma cutis of the face with local application of tretinoin (all-trans-retinoic acid): a case report and review of the literature. J Dermatolog Treat 2001; 12: 171-173.
face: treatment with the needle microincision-extirpation method. J Dermatolog Treat 2007; 18: 252-254.
[10] Altman JF, Nehal KS, Busam KJ and Halpern AC. Treatment of primary miliary osteoma cutis with incision, curettage, and primary closure. J Am Acad Dermatol 2001; 44: 96-99.
[11] Zhang Y, Fang L, Zang Y and Xu Z. Identification of core genes and key pathways via integrated analysis of gene expression and DNA methyla-tion profiles in bladder cancer. Med Sci Monit 2018; 24: 3024-3033.
[12] Liu X, Qu J, Xue W, He L, Wang J, Xi X, Liu X, Yin Y and Qu Y. Bioinformatics-based identification of potential microRNA biomarkers in frequent and non-frequent exacerbators of COPD. Int J Chron Obstruct Pulmon Dis 2018; 13: 1217-1228.
[13] Zhou L, Du Y, Kong L, Zhang X and Chen Q. Identification of molecular target genes and key pathways in hepatocellular carcinoma by bioinformatics analysis. Onco Targets Ther 2018; 11: 1861-1869.
[14] Ashburner M, Ball CA, Blake JA, Botstein D, Butler H, Cherry JM, Davis AP, Dolinski K, Dwight SS, Eppig JT, Harris MA, Hill DP, Issel-Tarver L, Kasarskis A, Lewis S, Matese JC, Richardson JE, Ringwald M, Rubin GM and Sherlock G. Gene ontology: tool for the unifica-tion of biology. The gene ontology consortium. Nat Genet 2000; 25: 25-29.
[15] Nakaya A, Katayama T, Itoh M, Hiranuka K, Ka-washima S, Moriya Y, Okuda S, Tanaka M, Toki-matsu T, Yamanishi Y, Yoshizawa AC, Kanehisa M and Goto S. KEGG OC: a large-scale auto-matic construction of taxonomy-based ortho-log clusters. Nucleic Acids Res 2013; 41: D353-357.
[16] Huang da W, Sherman BT and Lempicki RA. Systematic and integrative analysis of large gene lists using DAVID bioinformatics resourc-es. Nat Protoc 2009; 4: 44-57.
[17] Smith CG and Glaser DA. Treatment of multiple miliary osteoma cutis with tretinoin gel. J Am Acad Dermatol 1999; 41: 500.
[18] Vastrad B, Vastrad C, Tengli A and Iliger S. Iden-tification of differentially expressed genes reg-ulated by molecular signature in breast can-cer-associated fibroblasts by bioinformatics analysis. Arch Gynecol Obstet 2018; 297: 161-183.
[19] Mullin BH, Mamotte C, Prince RL and Wilson SG. Influence of ARHGEF3 and RHOA knock-down on ACTA2 and other genes in osteoblasts and osteoclasts. PLoS One 2014; 9: e98116. [20] Hutter-Schmid B and Humpel C. Alpha-smooth
muscle actin mRNA and protein are increased in isolated brain vessel extracts of alzheimer mice. Pharmacology 2016; 98: 251-260.
[21] Matthews BG, Torreggiani E, Roeder E, Matic I, Grcevic D and Kalajzic I. Osteogenic potential of alpha smooth muscle actin expressing mus-cle resident progenitor cells. Bone 2016; 84: 69-77.
[22] Talele NP, Fradette J, Davies JE, Kapus A and Hinz B. Expression of alpha-smooth muscle ac-tin determines the fate of mesenchymal stro-mal cells. Stem Cell Reports 2015; 4: 1016-1030.
[23] Lambert MP. Update on the inherited platelet disorders. Curr Opin Hematol 2015; 22: 460-466.
[24] Beebe SJ, Oyen O, Sandberg M, Froysa A, Hansson V and Jahnsen T. Molecular cloning of a tissue-specific protein kinase (C gamma) from human testis--representing a third iso-form for the catalytic subunit of cAMP-depen-dent protein kinase. Mol Endocrinol 1990; 4: 465-475.
[25] Zhang S, Li L, Huang Z, Xin X and Xiao B. Ap-plication of genome-wide genechip for screen-ing and identifyscreen-ing genes related to CD133(+) CD200(+) colorectal cancer stem cells. Nan Fang Yi Ke Da Xue Xue Bao 2013; 33: 1787-1791.
[26] Chamcheu JC, Adhami VM, Esnault S, Sechi M, Siddiqui IA, Satyshur KA, Syed DN, Dodwad SM, Chaves-Rodriquez MI, Longley BJ, Wood GS and Mukhtar H. Dual inhibition of PI3K/Akt and mTOR by the dietary antioxidant, delphini-din, ameliorates psoriatic features in vitro and in an imiquimod-induced psoriasis-like disease in mice. Antioxid Redox Signal 2017; 26: 49-69.
[27] Chen S, Li F, Chai H, Tao X, Wang H and Ji A. miR-502 inhibits cell proliferation and tumor growth in hepatocellular carcinoma through suppressing phosphoinositide 3-kinase cata-lytic subunit gamma. Biochem Biophys Res Commun 2015; 464: 500-505.
[28] Chen YJ, Kay N, Yang JM, Lin CT, Chang HL, Wu YC, Fu CF, Chang Y, Lo S, Hou MF, Lee YC, Hsieh YC and Yuan SS. Total synthetic protoapige-none WYC02 inhibits cervical cancer cell prolif-eration and tumour growth through PIK3 sig-nalling pathway. Basic Clin Pharmacol Toxicol 2013; 113: 8-18.
[29] Wang G, Kuai D, Yang Y, Yang G, Wei Z and Zhao W. Screening of potential gene markers for predicting carotid atheroma plaque forma-tion using bioinformatics approaches. Mol Med Rep 2017; 15: 2039-2048.
[30] Zhang X and Zanello LP. Vitamin D receptor-dependent 1 alpha, 25(OH)2 vitamin D3-in-duced anti-apoptotic PI3K/AKT signaling in osteoblasts. J Bone Miner Res 2008; 23: 1238-1248.
K, Valcz G, Tulassay Z and Molnar B. Promoter hypermethylation-related reduced somatosta-tin production promotes uncontrolled cell pro-liferation in colorectal cancer. PLoS One 2015; 10: e0118332.
[32] War SA and Kumar U. Coexpression of human somatostatin receptor-2 (SSTR2) and SSTR3 modulates antiproliferative signaling and apoptosis. J Mol Signal 2012; 7: 5.
[33] Zhou G, Sinnett-Smith J, Liu SH, Yu J, Wu J, Sanchez R, Pandol SJ, Abrol R, Nemunaitis J, Rozengurt E and Brunicardi FC. Down-regula-tion of pancreatic and duodenal homeobox-1 by somatostatin receptor subtype 5: a novel mechanism for inhibition of cellular prolifera-tion and insulin secreprolifera-tion by somatostatin. Front Physiol 2014; 5: 226.
[34] Ludwig MG and Seuwen K. Characterization of the human adenylyl cyclase gene family: cDNA, gene structure, and tissue distribution of the nine isoforms. J Recept Signal Transduct Res 2002; 22: 79-110.
[35] Li Y, Liang Q, Wen YQ, Chen LL, Wang LT, Liu YL, Luo CQ, Liang HZ, Li MT and Li Z. Comparative proteomics analysis of human osteosarcomas and benign tumor of bone. Cancer Genet Cyto-genet 2010; 198: 97-106.
[36] Wang D, Xia D and Dubois RN. The crosstalk of PTGS2 and EGF signaling pathways in colorec-tal cancer. Cancers (Basel) 2011; 3: 3894-3908.
[37] Pollari S, Leivonen SK, Perala M, Fey V, Ka-konen SM and Kallioniemi O. Identification of microRNAs inhibiting TGF-beta-induced IL-11 production in bone metastatic breast cancer cells. PLoS One 2012; 7: e37361.
[38] Naot D, Chhana A, Matthews BG, Callon KE, Tong PC, Lin JM, Costa JL, Watson M, Grey AB and Cornish J. Molecular mechanisms involved in the mitogenic effect of lactoferrin in osteo-blasts. Bone 2011; 49: 217-224.
[39] Chadwick BP, Mull J, Helbling LA, Gill S, Leyne M, Robbins CM, Pinkett HW, Makalowska I, Maayan C, Blumenfeld A, Axelrod FB, Brown-stein M, Gusella JF and Slaugenhaupt SA. Cloning, mapping, and expression of two novel actin genes, like-7A (ACTL7A) and actin-like-7B (ACTL7B), from the familial dysautono-mia candidate region on 9q31. Genomics 1999; 58: 302-309.
[40] Moriishi T, Maruyama Z, Fukuyama R, Ito M, Miyazaki T, Kitaura H, Ohnishi H, Furuichi T, Kawai Y, Masuyama R, Komori H, Takada K, Kawaguchi H and Komori T. Overexpression of Bcl2 in osteoblasts inhibits osteoblast differ-entiation and induces osteocyte apoptosis. PLoS One 2011; 6: e27487.
[41] Lee JY and Lee NK. Up-regulation of cyclin D1 and Bcl2A1 by insulin is involved in osteoclast proliferation. Life Sci 2014; 114: 57-61. [42] van Wijk R, Huizinga EG, van Wesel AC, van
Oirschot BA, Hadders MA and van Solinge WW. Fifteen novel mutations in PKLR associated with pyruvate kinase (PK) deficiency: structural implications of amino acid substitutions in PK. Hum Mutat 2009; 30: 446-453.
[43] Nguyen A, Loo JM, Mital R, Weinberg EM, Man FY, Zeng Z, Paty PB, Saltz L, Janjigian YY, de Stanchina E and Tavazoie SF. PKLR promotes colorectal cancer liver colonization through in-duction of glutathione synthesis. J Clin Invest 2016; 126: 681-694.
[44] Bengoechea-Alonso MT and Ericsson J. The phosphorylation-dependent regulation of nu-clear SREBP1 during mitosis links lipid metab-olism and cell growth. Cell Cycle 2016; 15: 2753-2765.
[45] Li Y, Zhang J, He J, Zhou W, Xiang G and Xu R. MicroRNA-132 cause apoptosis of glioma cells through blockade of the SREBP-1c metabolic pathway related to SIRT1. Biomed Pharmaco-ther 2016; 78: 177-184.
[46] Wang Y, Wang H, Zhao Q, Xia Y, Hu X and Guo J. PD-L1 induces epithelial-to-mesenchymal transition via activating SREBP-1c in renal cell carcinoma. Med Oncol 2015; 32: 212. [47] Golden D and Cantley LG. Casein kinase 2
pre-vents mesenchymal transformation by main-taining Foxc2 in the cytoplasm. Oncogene 2015; 34: 4702-4712.
[48] Hader C, Marlier A and Cantley L. Mesenchy-mal-epithelial transition in epithelial response to injury: the role of Foxc2. Oncogene 2010; 29: 1031-1040.