Long-range charge order on the Fe
3O
4„
001
…
surface
I. V. Shvets, G. Mariotto,*K. Jordan, N. Berdunov, R. Kantor, and S. Murphy SFI Trinity Nanoscience Laboratories, Physics Department, Trinity College, Dublin 2, Ireland (Received 7 May 2004; revised manuscript received 4 August 2004; published 15 October 2004)
The Verwey transition in magnetite is of fundamental importance for the understanding of metal-insulator transitions but, in spite of being the subject of many studies over the last century, its nature is not fully understood. This is even more true in the case of the magnetite surface, where the low dimensionality plays an additional role in the determination of the Verwey transition temperature. We have atomically resolved the
共
冑
2⫻冑
2兲R45° reconstructed surface by scanning tunneling microscopy and we have modeled ourexperimen-tal results by density functional theory calculations. We attribute the observed pattern to the charge ordering of Fe2+-Fe2+and Fe3+-Fe3+dimers. We propose a mechanism for the formation of this charge ordered surface and provide an explanation for the increase of the Verwey transition temperature at the(001)surface of magnetite.
DOI: 10.1103/PhysRevB.70.155406 PACS number(s): 71.30.⫹h, 71.38.Mx
I. INTRODUCTION
The Verwey transition is a metal-insulator transition that occurs in some ionic crystals as a change in electric conduc-tivity and lattice symmetry. The Verwey transition tem-perature TV in stoichiometric magnetite 共Fe3O4兲 is around
TV⯝125 K. Below TV, the electric conductivity drops by
about two orders of magnitude and the lattice symmetry is lowered from cubic to monoclinic. Despite intensive re-search spanning almost a century, the nature of the Verwey transition is not completely understood. Various theoretical models, recently revised by Waltz,1 have been proposed to explain the electron transport mechanism in the low- and high-temperature phases, and the sudden change in conduc-tivity at the transition point. Among these are the models proposed by Wigner, Mott, the Hubbard-Mott transition, and the Anderson localization. Some models explain the Verwey transition as a complete order-disorder transition, either due to an ordering of the charges of the conducting electrons or of the electronic orbitals. Anderson estimated that a transi-tion between a Verwey order and complete disorder would be expected for temperatures of the order of 104 K.2In order to
explain the much lower transition temperature measured ex-perimentally, Anderson proposed two different types of or-der: a long-range order(LRO)present at T⬍TVand a short-range order(SRO)that persists at T⬎TV. He also postulated
a condition for SRO, according to which the minimum lattice energy is achieved provided every tetrahedron formed by the nearest-neighbor octahedral sites is occupied by two Fe2+
and two Fe3+ ions.2An attempt to explain the Verwey
tran-sition as a consequence of the formation of bipolarons has also been proposed.3Bipolarons result from the attraction of
polarons and are predicted to arise in the case of strong electron-phonon coupling for low-dimensional systems. A superstructure on the Fe3O4共111兲 surface has been recently
explained by Shvets et al. in terms of a giant localized polaron.4
Relatively little work has been done so far on the Verwey transition at the surface of magnetite single crystals or thin films, partly due to the fact that the experimental techniques employed to detect the Verwey transition, e.g., as nuclear
magnetic resonance (NMR) and resistivity versus tempera-ture measurements, are not surface sensitive. During the last two decades, the invention of scanning tunneling microscopy (STM)has boosted the area of surface physics and the study of low-dimensional systems. A STM study of the Fe3O4共001兲
surface using ferromagnetic Fe tips, suggested that a charge frozen state persists at the surface at room temperature.5,6
Since no long-range order was detected, the observed short-range order was classified as a Wigner glass. This result has been recently confirmed by another group.7
We have recently shown that long-range charge order sets in on the Fe3O4共001兲surface.8In this paper we interpret our
experimental results in the light of density functional theory (DFT)calculations and we propose a mechanism for the for-mation of long-range charge order at a temperature well above TV.
II. EXPERIMENT
Magnetite has the inverse spinel crystal structure. The conventional unit cell of magnetite contains 32 oxygen ions packed in the fcc lattice, 8 Fe ions placed at sites with tetra-hedral oxygen coordination(A sites)and 16 Fe ions placed at sites with octahedral oxygen coordination (B sites). In sto-ichiometric magnetite the A site Fe ions are Fe3+ and the B
site ones are equally likely to be Fe2+and Fe3+. The synthetic crystals used in this study were grown employing the skull melting technique9 and characterized by powder x-ray
dif-fraction (XRD) and resistance versus temperature meas-urements. A lattice constant of 8.40± 0.01 Å and a Verwey transition temperature of 108 K were determined. Raman spectra of these crystals were consistent with magnetite ref-erence spectra and indicated that the crystals did not contain other phases of iron oxides. Magnetization measurements us-ing a vibratus-ing sample magnetometre resulted in the value of
sur-face characterization, and STM measurements were per-formed in the UHV system with a base pressure of ⬃1
⫻10−10mbar. The in situ preparation procedure consisted of a combination of Ar+ion sputtering, annealing in UHV and
annealing in an oxygen partial pressure. The argon and oxy-gen exposure varied between 3600 and 7200 L, while the annealing temperature ranged between 850± 50 K and 990± 50 K. The final anneal stage varied between 2 and 10 h. This preparation procedure produces a contaminant-free surface, showing a sharp 共
冑
2⫻冑
2兲R45° low-energyelectron diffraction (LEED) pattern. STM measurements were performed at room temperature using tips made of an-tiferromagnetic MnNi alloy.10,11 STM measurement were
carried out in constant-current mode and the sample was bi-ased. A bias voltage ranging from +0.6 to + 1 V and a tun-neling current between 0.1 and 0.3 nA were the typical pa-rameters used.
III. RESULTS AND DISCUSSION
A detailed study of the Fe3O4共001兲 surface by means of
STM, LEED, and Auger electron spectroscopy (AES) has been recently published by us in Ref. 8. For a better under-standing of the present manuscript we will summarize here the main findings. The surface of the crystal is terminated at the octahedral plane, exhibiting a共
冑
2⫻冑
2兲R45° superlattice,as shown by LEED. We have identified its origin in the charge ordering of the Fe cations at the B sites rather than in an ordered array of vacancies. Atomically resolved STM im-ages show a dimerization of the Fe cations along the[110] direction. Two different types of dimers, which alternate along the [110]direction, are identified with Fe3+-Fe3+ and
Fe2+-Fe2+ dimers, giving rise to a surface that is in a charge ordered state at room temperature. One cannot exclude a more complex scenario, where electrons are distributed at the
B sites in other proportions. However, our results clearly
exclude the possibility that all the Fe ions at B sites on the surface have identical electronic states consistent with a completely disordered condition. STM provide evidence of a highly regular structure with a 12 Å periodicity. In most cases the periodicity remained uninterrupted all throughout the terrace length, suggesting that LRO has set on the sur-face.
As discussed in Sec. II, the preparation conditions varied somewhat in terms of annealing temperature and gas expo-sures. Although AES and LEED provide evidence of a clean, 共
冑
2⫻冑
2兲R45° reconstructed surface for all the variouscom-binations of preparation conditions, new STM data show a somewhat different arrangement of the dimers on the sur-face. This is shown in Fig. 1(a)where, instead of a constant
6 Å separation between atomic rows along the关11¯0兴 direc-tion, the Fe2+-Fe2+dimers are shifted by⬃1 Å with respect to the Fe3+-Fe3+ dimers. This is shown by the line-profile shown in Fig. 1(b).
In the following sections we shall discuss the possible mechanisms that can lead to the formation of Fe3+-Fe3+and
Fe2+-Fe2+ dimers. We will also discuss the reasons for the
formation of long range order as opposed to a short range order quasiperiodicity.
A. Electronic configuration
The electron bands of Fe3O4 have been calculated using
local-spin density calculations (LSDA) by Zhang and Satpathy12and using augmented plane wave(APW) calcula-tions by Yanase and Siratori.13 The three-band Hamiltonian
formed by the t2g共xy , yz , zx ,兲orbitals on the B sublattice can
be written as follows:
H =
兺
i,j
兺
,=1 3tijci+cj+
兺
i,j 兺
,=13
Ui,j
⫻nini+
兺
i,jV⫻ninj. 共1兲
The second and third terms in Eq. (1) describe the on-site and intersite Coulomb energy terms, respectively. niis the number operator of the electron at the ith site of the orbital , where the orbital indices and take xy, yz, and zx values. ni is the number operator for each site, i.e., ni= nixy + niyz+ nizx. U and V are the on-site and intersite Coulomb interaction constants. Electron hopping between the orbitals andof octahedral Fe ions at the ith and jth sites is driven by the term tijci+cj. Here ci
+
[image:2.612.335.535.56.319.2]and cj are the electron cre-ation and annihilcre-ation operators of the electron of orbitalat site i and of orbital at site j, respectively. The transfer integral is tij. The results of both calculations of Refs. 12
FIG. 1. (a)共130⫻150兲Å2STM image. Spots of two different brightness are imaged, corresponding to dimers of Fe2+ and Fe3+
and 13 are in good agreement, showing an exchange splitting
⌬EXbetween the majority and minority subbands on the Fe
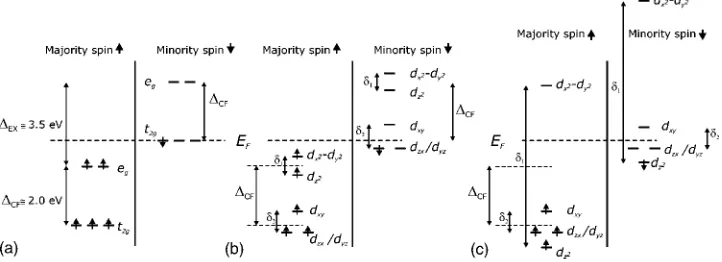
atom of about 3.5 eV. The five-fold d levels are split into t2g and egorbitals by the crystal field. The crystal-field splitting
⌬CF is approximately 2 eV for the Fe共B兲 atom, and few
tenths of an electronvolts for the Fe共A兲 atom. The calcula-tions show that the spin-↑ bands (majority spins) are semi-conducting while the spin-↓ bands(minority spins) are me-tallic. It follows that only spin-↓ belonging to t2gorbitals of Fe共B兲are present at the Fermi level, while the O共p兲orbitals lay well below the Fermi energy. A schematic of the Fe共B兲
electronic levels in the bulk is shown in Fig. 2(a). On the surface the band structure is altered. As we explained at the beginning of this section, our crystals are terminated at the B plane. Therefore, the coordination of the Fe共B兲 ions is low-ered, since the apical oxygens are missing. This lowers the site symmetry from cubic to tetragonal, which leads to a splitting of the t2glevels as shown in Fig. 2(b). The dyzand
dzx orbitals lay lower than the dxyorbital. The values of the nearest-neighbors transfer integrals tij were estimated in Ref. 14, with txy-xy= −0.278 eV, tyz-yz= 0.085 eV, and tzx-zx = −0.035 eV, while all the other configurations are tij= 0.
B. Lattice deformation and charge ordering
An exact analytical solution of Eq.(1)can be obtained for any value of t and U provided that the system has one-dimensional (1D) geometry and that one electron is shared between two sites, e.g., there is an equal number of Fe2+and Fe3+ions. The analytical solution suggests that Fe2+and Fe3+
ions should alternate along the 1D chains of B sites forming a-Fe2+-Fe3+-Fe2+-Fe3+-structure.15 The B sites within the
(001) surface of magnetite do in fact represent 1D chains. The B sites are arranged in lines aligned along the[110]and 关11¯0兴 directions. The separation between neighboring Fe ions along the lines共3 Å兲is half of that in between the lines. Besides, there are two oxygen ions positioned in between the nearest Fe ions of any neighboring line. One can therefore
conclude that electron hopping between the neighboring par-allel lines is suppressed. Similarly, electron hopping between the surface and the bulk is suppressed as electron levels on the surface are shifted with respect to the bulk levels, due to the additional crystal field caused by a missing apical oxygen [see Figs. 2(a) and 2(b)]. Therefore, as electronic transport on the (001) surface takes place along one dimension, one can expect that Fe2+ and Fe3+ ions should form the
Fe2+-Fe3+-Fe2+-Fe3+ sequence along the [110] and 关11¯0兴 lines of B sites on the surface. We shall call this state the 1-1 pattern to differentiate it from the experimentally observed pattern of alternating pairs. The latter shall be called the 2-2 pattern. It is clear that the 1-1 pattern should indeed be the ground state, if only the Coulomb and Hubbard exchange interactions are taken into account, as all terms in Eq. (1) result in an energy increase for any deviation from the 1-1 pattern. However, our experimental results contradict this prediction. In the remainder of this chapter we shall discuss the mechanism that leads to the stabilization of the 2-2 pat-tern. We suggest that such a pattern is stabilized by lattice deformation and that the energy difference between the 1-1 and 2-2 patterns is compensated by a difference in the elastic energy. In other words the dimerization of Fe cations results in an energy gain (through electron-lattice interaction) that overweighs the energy penalty due to Coulomb repulsion and suppressed Hubbard exchange.
1. Jahn-Teller effect
One possible mechanism of electron-lattice interaction is the Jahn-Teller(JT)effect. It is only effective for the case of orbital degeneracy. In both cases of small and large splitting shown in Figs. 2(b)and 2(c), respectively, the high-spin Fe2+ 共d6兲ions have such a degeneracy and therefore are subject to JT effect. At the same time, in both cases of small and large splitting, the Fe3+ ions are not degenerate. For a start it
should be pointed that in both cases of small and large split-ting, the Fe2+ ions have t2gdegenerate orbitals and these are
[image:3.612.126.487.60.191.2]known not to display a strong JT effect. Figure 3(a) shows
FIG. 2.(a)Schematic showing the splitting共⌬CF兲of a five-fold orbitally degenerate d-level of an Fe2+ion in an octahedral crystal field.
The splitting of the electronic band共⌬EX兲into a majority subband(spin-↑) and a minority subband(spin-↓)is also shown.(b)A further
splitting(␦1and␦2)occurs at the surface, where the symmetry is lowered because of a missing apical oxygen. The egdoublet splits into the levels dx2-y2and dz2. The t2gtriplet splits, with the dyz− dzxdegenerate doublet lying lower than the dxylevel.(b)shows the case of a small
split␦1,␦2⬍⌬CFleaving the degenerate dyz− dzxdoublet as the lowest energy level for↓electrons.(c)shows the case of a large split for a Fe3+ion. If␦1⬎⌬CF, the dz2level may become lower in energy than the dyz− dzxdoublet. However, the dyz− dzxdoublet is still occupied by
the JT distortion for the 1-1 pattern in the case of tyz-yz
-tyz-yz transfer integral. The case of the tzx-zx-tzx-zxtransfer in-tegral is similar and can be obtained by rotation of deforma-tion pattern shown in Fig. 3(a) by 90° degrees. One can appreciate that in the 1-1 pattern, the Fe2+ cations on the surface do not share nearest-neighbor oxygen anions. There-fore, displacement of each anion is determined by a single Fe cation.
The 2-2 pattern could be energetically more favorable than the 1-1 pattern provided the direction of displacement of a shared anion by the first cation is collinear with the one driven by the second cation. However, this is not the case for any of the possible configurations corresponding to the tyz-yz,
txy-xy and tzx-yz transfer integrals. The case of a 2-2 pattern with the yz-yz orbital configuration is shown in Fig. 3(b). Anions marked with numerals 1 and 2 are shared between cations marked with numerals 3 and 4. The arrows initiating at each of the anions 1 and 2 indicate the directions of two anionic displacements caused by the cations 3 and 4. These are clearly not collinear. One can arrive to similar conclu-sions for 2-2 patterns with any of the other two configura-tions: txy-xyand tzx-yztransfer integrals. Therefore, there is no basis for the onset of the collective JT distortions to explain the STM results obtained given the symmetry of the B-plane terminated(100)surface of magnetite.
2. Bipolaronic instability
To explain the results obtained, we favor another mecha-nism that, unlike JT distortions does not remove electron level degeneracy but still reduces the overall energy of the system through electron-lattice interaction. In this model a wave of anionic displacement induces a splitting of the elec-tron levels sufficient to induce a gain in energy that over-comes the Coulomb repulsion due to the pairing of Fe ions. Given the localization of the electron charge and its strong interaction with the lattice, it may be appropriate to call the pair of Fe ions a localized bipolaron. Let us consider the case when the fifth 3d electron of the Fe3+ion is located at the dz2 orbital, corresponding to the crystal field splitting shown in
Fig. 2(c). Moving anions closer to the Fe3+ion or away from it changes the splitting between the dx2-y2 and dz2 levels. Therefore, the anionic displacement shown in Fig. 4 will lower the energy of the dz2level. Similar considerations ap-ply to a pair of Fe2+ions in the case of a small crystal field
splitting[Fig. 2(b)], where the dzx/ dyz levels are lowered in energy. This pattern is consistent with our STM images(see Fig. 1 and Ref. 8).
To support our interpretation of the STM data, we have performed DFT calculations using the CASTEP algorithm.16
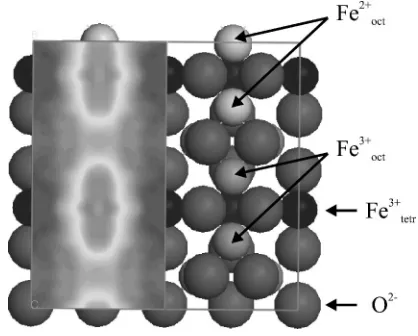
The local spin-density approximation (LSDA) based on ul-trasoft pseudopotentials was used to optimize the surface ge-ometry and to calculate the local density of states. A plane cutoff of 260 eV and a 共2⫻2⫻1兲 grid of k points were chosen. The calculations were performed for a slab of two unit cells and the electron density distribution was calculated for an energy range between the Fermi level and +1 V, to compare with our experimental settings. The results are shown in Fig. 5. The calculations show that Fe octahedral ions form pairs along the[110]direction, and that the dimer-ization is stabilized by lattice strain. Our calculations do not show a significant difference in the electron density distribu-tion between pairs of Fe ions, mainly due to two reasons. First, a two unit cell slab is likely to be too small to resolve the 12 Å periodicity. However, we are not able to model a larger slab, due to computational limitations. Second, in our calculations we were not able to force a complete localiza-tion of the sixth d6electrons at the B sites.
In line with this model, the Verwey transition at the sur-face can be considered as a bipolaron blocking temperature
[image:4.612.331.541.56.230.2]Tb. There is a distinct possibility that above Tb the charge transport on the surface takes place by means of mobile bi-polarons, i.e., mobile bosons. As our STM measurements were taken at room temperature, one can further conclude that Tb is above room temperature. In other words, the Ver-wey temperature on the (001) surface is much greater than the one in the bulk. The increase of TVon the surface can be explained as follows. We can consider electrons in any of the
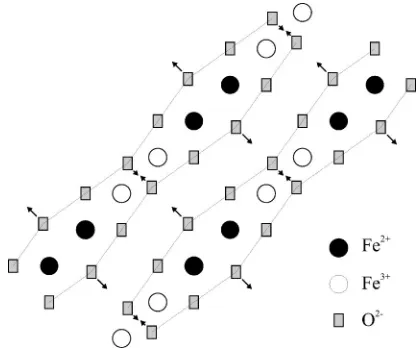
FIG. 3. (a)Schematic showing the expected Jahn-Teller defor-mations on the(001)surface of magnetite for the 1-1 pattern. The schematic illustrates the case for the tyz-yz transfer integral. (b)
Schematic showing the expected Jahn-Teller deformations on the
(001)surface of magnetite for the 2-2 pattern. The schematic illus-trates the case for the tyz-yztransfer integral. The O anions labeled “1” and “2” are shared between the Fe2+ cations labeled “3” and
“4.”. The directions of anionic displacements due to cations 3 and 4 are shown by two arrows initiating at each of the anions 1 and 2.
[image:4.612.53.295.57.166.2][110] and关11¯0兴chains of B sites Fe ions as a separate sys-tem. Indeed, the electron transport on the(001) surface oc-curs along the [110] and 关11¯0兴 directions, while transport between the surface and the bulk occurs along the remaining four directions:[011],关011¯兴,[101], and关101¯兴. However, we suggest that the transport between the surface and the bulk is hindered because cationic electron levels in the bulk and at the surface correspond to different energies(see Fig. 2). This implies that hopping between the surface and the bulk is suppressed as hopping is only effective between degenerate levels. Our analysis of Tbis semiquantitative and is based on the comparison of free energies
F = E − TS. 共2兲
in the bipolaron-ordered(BO)and non-ordered(NO)states, called here FBOand FNO, where S is the entropy associated
with a multiplicity of states due to mobile bipolarons. In our analysis we assume that in the NO state the bipolarons are already formed but they are mobile. Of these two states, the state chosen by the system at any given temperature is the one that corresponds to the lower free energy. As in the BO state the entropy associated with bipolaron states can be as-sumed to be zero (just one pattern corresponding to the ground state contributes to the multiplicity function), then
FBO= EBO. In the same way FNO= ENO− TS. Therefore, as at
the BO-NO transition FBO= FNO, the transition temperature
can be estimated as T =共ENO− EBO兲/ S. We shall show that the
transition between the BO and NO states on the surface should occur at a higher temperature than in the bulk, i.e., 共Tb兲surface⬎共Tb兲bulk.
First, we will give a qualitative explanation of why the energy difference ⌬Etotal= ENO− EBO between NO and BO
states should be greater at the surface than in the bulk, caus-ing an increase of TVat the surface. From the Hamiltonian of
Eq.(1)we can see that the energy of each electron has two contributions: a negative one from the transfer integral
⌬Etransfer (first term), and a positive one from the Coulomb
interaction energy ⌬ECoulomb (second and third terms). The
total energy of the electron can therefore be written as
⌬Etotal=⌬Etransfer+⌬ECoulomb
=共ENO− EBO兲transfer+共ENO− EBO兲Coulomb. 共3兲
The transfer integral essentially underlines the uncertainty principle: As the current carriers become more localized, their energy increases. For each carrier placed at a B site in the bulk, transport is possible in three dimensions, along the 具110典set of directions. On the other hand, electrons placed at a B site at the surface can only move along one dimension. Therefore, charge freezing in the bulk results in an energy increase of the order of 3ប2/ 2m⌬x2, where⌬x is the size of
the area of the electron localization, while at the surface the energy increase is onlyប2/ 2m⌬x2. In other words, electron
hopping at the surface is restricted to one dimension even in the NO state. Therefore, as the negative contribution
⌬Etransfer is smaller at the surface, the energy difference ⌬Etransfer on the surface should be greater than in the bulk.
The Coulomb interaction energy⌬ECoulombat the surface is greater than in the bulk, due to the missing apical oxygen atoms, which lower the symmetry from cubic to tetrahedral. In conclusion,共⌬Etotal兲surface⬎共⌬Etotal兲bulk.
Second, we will show that the value of the entropy S normalized per one electron is smaller at the surface than in the bulk, leading to a further increase of Tb. To compare the entropies of the surface and the bulk we estimate the number of ground states for systems of different dimensionality. The entropy can be calculated as
S = k ln W. 共4兲
where W is the number of states equally accessible to the system. We follow the approach applied by Anderson to es-timate the electron entropy in bulk Fe3O4.2 The Anderson
model is based on the argument that the energy of the entire electron system in magnetite is essentially determined by short-range order. As long as each tetrahedron of B sites contains two Fe2+ and two Fe3+ ions (Anderson condition), the state is attributed to the group of ground states regardless of the long-range order arrangement. Therefore, in this model the ground state should be heavily degenerate if a substantial number of permutations fulfill the Anderson con-dition. The number of states W in the bulk is estimated as 共3 / 2兲N/2, where N is the number of B sites in the lattice.2
Therefore, a value of Sbulk= R / 2 ln共3 / 2兲= 0.81R is calculated
per mole of octahedral sites. This rather large entropy results from a particular arrangement of the B sites in the spinel crystal structure, which fulfils the Anderson condition for a large number of charge arrangements.
We can now apply the same approach to the(001)surface of Fe3O4共001兲 exhibiting the experimentally observed 2-2
pattern. Two cases must now be considered. These are shown in Figs. 6(a)and 6(b). Both figures show the topmost
Ander-FIG. 5. DFT calculations for a two unit cell slab of a
B-terminated magnetite crystal. A configuration in which pairs of
Fe2+and Fe3+ions at B sites alternate along the[110]directions can
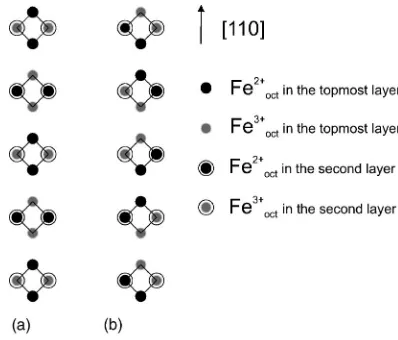
[image:5.612.68.277.57.225.2]son tetrahedron formed by the topmost and second topmost layers of B-site Fe ions. In the first case[Fig. 6(a)]the pair of Fe2+ ions in the topmost layer and Fe3+ ions in the second topmost layer belong to the same Anderson tetrahedron. In this case there is only one state that fulfils this condition for each pair of Fe2+and Fe3+ions on the surface. In the second
case, each pair of Fe2+ions on the surface is shared between
two Anderson tetrahedrons[Fig. 6(b)]. In this case there are two possible states for each of the N/2 pairs of Fe2+ions on the surface fulfilling the Anderson condition. Thus the total number of states is W = 2N / 2, giving an entropy value of
Ssurface= R / 2 ln 2 = 0.34R. Since 共⌬Etotal兲surface⬎共⌬Etotal兲bulk
and Ssurface⬍Sbulk, it follows that 共Tb兲surface⬎共Tb兲bulk. A
higher transition temperature at the surface of magnetite ex-plains why long-range order can still set in at room tempera-ture.
3. Other models
It should be pointed out that some of our results could also be explained by alternative models. It was recently pro-posed by Seo et al.14that the strong electronic correlation at
the B sites can create an orbital ordering(OO) state with a 1D electronic structure. Such a system has a Peierls instabil-ity with two times the interatomic distance,14,17in agreement with our STM results. The 2-2 pattern may also be driven by a regular array of oxygen vacancies on the surface. The
re-moval of oxygen ions results in the creation of inequivalent
B sites on the magnetite surface. As a consequence, two
neighboring Feoctsites are adjacent to the vacancy and two
neighboring Feoct sites are still fully surface coordinated by
O2−ions. Therefore, alternating pairs of B sites with different
energies are created along the [110] direction, which may drive the dimerization of the Fe ions. The O2− vacancies have a virtual positive charge and so in order to minimize the surface energy the Fe2+ ions will occupy the two sites
adja-cent to these O2−vacancies and the Fe3+ions will occupy the
pair of sites furthest from the vacancy. The virtual positive charge of an O2− vacancy may also explain the relaxation observed on the surface. The shifting along the关11¯0兴 direc-tion, marked by the dashed zigzag line in Fig. 1(a), could result from the repulsive effect of the array of O2−vacancies
on the pairs of Fe2+ ions. Wavelike rows of Fe ions were
observed by Stanka et al. However, neither the dimer forma-tion nor the difference between Fe2+ and Fe3+ions were ob-served in this previous study.18 In our model, the oxygen
vacancies create an energy barrier to electron hopping be-tween the octahedral surface sites, resulting in long range order on the surface. The introduction of O2− vacancies is also favorable in terms of reducing the surface polarity of magnetite(001).
IV. CONCLUSIONS
In this study we have analyzed the共
冑
2⫻冑
2兲R45°recon-structed surface of Fe3O4共001兲 synthetic crystals by STM
and LEED. Our results provide evidence of the formation of Fe2+-Fe2+ and Fe3+-Fe3+ pairs along the [110] rows of B sites, in agreement with the results of other groups.5,7
How-ever, we observe a different shift between adjacent Fe rows and most importantly, the set in of long-range order. We propose a mechanism to explain the observed charge ordered surface based on electron-lattice interaction. Our model is supported by DFT calculations, which show that the dimer-ization of Fe ions at B sites can be stabilized by a deforma-tion of the lattice. In our model, the dimerizadeforma-tion of Fe cat-ions and the deformation of the oxygen fcc lattice lead to a lowering of the electron levels and to a consequent gain in energy. This energy gain overcomes the energy penalty due to a higher Coulomb repulsion caused by the pairing of Fe cations and to the suppression of the Hubbard exchange caused by the localization of electron charges. Given the strong electron-lattice interaction and the localization of the sixth d6 electrons on the Fe2+ ions, we propose that the
[image:6.612.71.270.55.225.2]charge ordering at the (001) surface of magnetite is caused by localized bipolarons. Furthermore, we propose that the Verwey transition at the(001)surface of magnetite is much higher than in the bulk. This is essentially due to the lower dimensionality of the surface, which hinders electron trans-port between the bulk and the surface itself.
FIG. 6. Top view of octahedral chains of Fe cations. The first two layers are shown, and the tetrahedrons formed by nearest-neighbors octahedral sites are marked by black solid lines. The consideration is based on fulfilling Anderson’s condition and the experimentally observed pattern of charge pairs on the surface. Two cases can be distinguished. (a) Pairs of Fe2+ ions in the topmost
layer and Fe3+ions in the second topmost layer belong to the same
Anderson tetrahedron.(b) Each pair of Fe2+ions on the surface is
*Electronic address: [email protected]
1F. Waltz, J. Phys.: Condens. Matter 14, R285(2002). 2P. W. Anderson, Phys. Rev. 102, 1008(1956). 3B. K. Chakraverty, Philos. Mag. B 42, 473(1980).
4I. V. Shvets, N. Berdunov, G. Mariotto, and S. Murphy,
Euro-phys. Lett. 63, 867(2003).
5R. Wiesendanger, I. V. Shvets, D. Bürgler, G. Tarrach, H. J.
Güntherodt, J. M. D. Coey, and S. Gräser, Science 255, 583
(1992).
6J. M. D. Coey, I. V. Shvets, R. Wiesendanger, and H.-J.
Güntherodt, J. Appl. Phys. 73, 6742(1993).
7R. Koltun, M. Herrmann, G. Güntherodt, and V. A. M. Brabers,
Appl. Phys. A: Mater. Sci. Process. 73, 49(2001).
8G. Mariotto, S. Murphy, and I. V. Shvets, Phys. Rev. B 66,
245426(2002).
9J. E. Keem, H. R. Harrison, R. Aragon, and J. M. Honig, Inorg.
Synth. 22, 43(1984).
10S. Murphy, J. Osing, and I. V. Shvets, Appl. Surf. Sci. 144–145,
497(1999).
11S. F. Ceballos, G. Mariotto, S. Murphy, and I. V. Shvets, Surf.
Sci. 523, 131(2003).
12Z. Zhang and S. Satpathy, Phys. Rev. B 44, 13 319(1991). 13A. Yanase and K. Siratori, J. Phys. Soc. Jpn. 53, 312(1984). 14H. Seo, M. Ogata, and H. Fukuyama, Phys. Rev. B 65, 085107
(2002).
15E. H. Lieb and F. Y. Wu, Phys. Rev. Lett. 20, 1445(1968). 16M. D. Segall, P. J. D. Lindan, M. J. Probert, C. J. Pickard, P. J.
Hasnip, S. J. Clark, and M. C. Payne, J. Phys.: Condens. Matter
14, 2717(2002).
17J. Bernasconi, M. J. Rice, W. R. Schneider, and S. Strässler, Phys.
Rev. B 12, 1090(1975).
18B. Stanka, W. Hebenstreit, U. Diebold, and S. A. Chambers, Surf.