Analysis of the Influence of EDM Parameters on
Surface Quality, Material Removal Rate and
Electrode Wear of Tungsten Carbide
1S.H.Tomadi,
1M.A.Hassan,
2Z. Hamedon,
Member, IAENG
1R.Daud,
1A.G.Khalid
Abstract: Electrical discharge machining (EDM) is a process for shaping hard metals and forming deep complex shaped holes by arc erosion in all kinds of electro-conductive materials. The objective of this paper is to study the influence of operating parameters of tungsten carbide on the machining characteristics such as surface quality, material removal rate and electrode wear. It is followed by optimizing the machining condition for confirmation test purposes. Then, the conformation test needed to evaluate the error margin between predicted result by software and confirmation result by experiment in terms of the machining characteristics. The effectiveness of EDM process with tungsten carbide, WC-Co is evaluated in terms of the material removal rate, the relative wear ratio and the surface finish quality of the workpiece produced. It is observed that copper tungsten is most suitable for use as the tool electrode in EDM of WC-Co. Better machining performance is obtained generally with the electrode as the cathode and the workpiece as an anode. In this paper, a study was carried out on the influence of the parameters such peak currrent, power supply voltage, pulse on time and pulse off time. The surface quality that was investigated in this experiment was surface roughness using perthometer machine. Material removal rate (MRR) and electrode wear (EW) in this experiment was calculated by using mathematical method. The result of the experiment then was collected and analyzed using STATISTICA software. This was done by using the design of experiments (DOE) technique and ANOVA analysis.
Index Terms – ANOVA Analysis, EDM Parameters, Electrode Wear, Material Removal Rate, STATISCA,
1Faculty of Mechanical Engineering,
Universiti Malaysia Pahang, Lebuhraya Tun Razak, 26300, Kuantan, Pahang, Malaysia.
Phone: +6095492216; Fax: +6095492244 Email: [email protected]
2Faculty of Manufacturing Engineering and Technology Management,
Universiti Malaysia Pahang, Lebuhraya Tun Razak, 26300, Kuantan, Pahang, Malaysia.
I. INTRODUCTION
Electrical Discharge Machining (EDM) is a non-traditional manufacturing process based on removing material from a part by means of a series of repeated electrical discharges (created by electric pulse generators at short intervals) between a tool, called electrode, and the part being machined in the presence of a dielectric fluid [1]. At present, EDM is a widespread technique used in industry for high-precision machining of all types of conductive materials such as metals, metallic alloys, graphite, or even some ceramic materials.
The adequate selection of manufacturing conditions is one of the most important aspects to take into consideration in the die-sinking electrical discharge machining (EDM) of conductive steel, as these conditions are the ones that are to determine such important characteristics: surface roughness, electrode wear (EW) and material removal rate (MRR). In this paper, a study will be perform on the influence of the factors of peak current, pulse on time, interval time and power supply voltage.
The material used in this study is a tungsten carbide or hard metal such as WC–15%Co. Approximately 50% of all carbide production is used for machining applications but tungsten carbides are also being increasingly used for non-machining applications, such as mining, oil and gas drilling, metal forming and forestry tools. [7] Accordingly, mathematical models will be obtained using design of experiments (DOE) technique to select the optimum machining conditions for machining WC-Co using EDM. The objectives of this paper are stated as follows:
To evaluate the performance of EDM on tungsten carbide(WC) with respect to various responses such as surface quality, electrode wear(EW) and material removal rate(MRR)
To establish mathematical model for all responses involved which are surface quality, material removal rate (MRR) and electrode wear (EW).
II. LITERATURE REVIEW
Electrical Discharge Machining (EDM) - Die Sink is one of the most extensively used non-conventional material removal processes. Its unique feature of using thermal energy to machine electrically conductive parts regardless of hardness has been its distinctive advantage in the manufacture of mould, die, automotive, aerospace and surgical components. In addition, EDM does not make direct contact between the electrode and the workpiece eliminating mechanical stresses, chatter and vibration problems during machining. [2]
Based on Yussni (2008), the variables parameters are have great effects to the machining performances results especially to the material removal rate (MRR), electrode wear rate and surface quality. There are two major groups of parameters that have been discovered and categorized [2]:
1) Non-electrical Parameters
a. Injection flushing pressure b. Rotational of speed electrode 2) Electrical Parameters
a. Peak current b. Polarity c. Pulse duration d. Power supply voltage
In the other hand, Van Tri (2002) categorized the parameters into five groups: [5]
1) Dielectric fluid; type of dielectric, temperature, pressure, flushing system
2) Machine characteristics; servo system and stability stiffness, thermal stability and accuracy
3) Tool; material, shape, accuracy
4) Workpiece
5) Adjustable parameters; discharge current, gap voltage, pulse duration, polarity, charge frequency, capacitance and tool materials
Some of the most important parameters implicated in the EDM manufacturing process are the following ones [2]: 1) On-time (pulse time or ti):
The duration of time (µs) the current is allowed to flow per cycle. Material removal is directly proportional to the amount of energy applied during this on-time. This energy is really controlled by the peak current and the length of the on-time. 2) Off-time (pause time or t0):
It is the duration of time (µs) between the sparks (that is to say, on-time). This time allows the molten material to solidify and to be wash out of the arc gap. This parameter is to affect the speed and the stability of the cut. Thus, if the off-time is too short, it will cause sparks to be unstable.
3) Arc gap (or gap):
It is the distance between the electrode and the part during the process of EDM. It may be called as spark gap.
4) Duty cycle :
It is a percentage of the on-time relative to the total cycle time. This parameter is calculated by dividing the on-time by the total cycle time (on-time plus off-time). The result is multiplied by 100 for the percentage of efficiency or the so called duty cycle.
5) Intensity (I):
It points out the different levels of power that can be supplied by the generator of the EDM machine. (I) represents the mean value of the discharge current intensity.
EDM performance, regardless of the type of the electrode material and dielectric fluid, is measured usually by the following criteria:
1) Metal removal rate (MRR)
Maximum of MRR is an important indicator of the efficiency and cost effectiveness of the EDM process, however increasing MRR is not always desirable for all applications since this may scarify the surface integrity of the workpiece. A rough surface finish is the outcome of fast removal rates. [6]
2) Resistance to wear or electrode wear (EW)
The electrode wear also depends on the dielectric flow in the machining zone. If the flow is too turbulent, it results in an increase in electrode wear. Pulsed injection of the dielectric has enable reduction of wear due to dielectric flow. [2] 3) Surface Roughness (Ra) of workpiece
The surface produced by EDM process consists of a large number of craters that are formed from the discharge energy. The quality of surface mainly depends upon the energy per spark.
III. EXPERIMENTAL METHOD
A. Material used – Tungsten Carbide WC–15Co
Table 1: Workpiece material properties [8]
B. Material Cutting Designation
[image:3.595.306.546.375.542.2]In this paper, copper tungsten will be used as an electrode material. This copper tungsten (CuW) rod had 8 mm of diameter and table 2 shows the specification.
Table 2: Electrode material properties
C. Material Removal Rate Measurement
The MRR of the workpiece will be measure by dividing the weight of workpiece before and after machining (found by weighing method using balance) against the machining time that was achieved. After completion of each machining process, the workpiece was blown by compressed air using air gun to ensure no debris and dielectrics were present. A precise balance (Precisa 92SM – 202A DR) will be use to measure the weight of the workpiece required.
D. Electrode Wear Definition
The concept of EW can be defined in many ways, the present study define the EW according to the ratio in weight of the electrode and the workpiece where expressed as percentage. Similar procedure for measuring the weight of workpiece will be used to determine the weight of the electrode before and after machining.
The following equation is used to determine the EW value:
EW = EWW x 100%
WRW (1) where:
EWW = weight of electrode used (g) WRW = weight of workpiece used (g)
D. Surface Roughness Measurement
There are various methods available for measuring the surface roughness of the workpiece. The arithmetic surface roughness value (Ra) will be adopted and measurements will be carried out at the bottom and at the side wall of the holes using a Mahrsurf XR 20 Perthometer.
IV. RESULTS AND DISCUSSION
A. Surface Roughness, Ra Analysis
[image:3.595.44.278.381.498.2] [image:3.595.42.276.381.499.2]With full factorial as a design of experiment, value of surface roughness for each sample will be obtained. Then, STATISTICA software will be used for further analysis. Figure 1 to 4 shows all the result.
Figure 1: Graph of Surface Roughness, Ra versus Pulse off Time, (µs)
Figure 2: Graph of Surface Roughness, Ra versus Voltage
Specification Value
Density(g/cm³)
15.2
Specific resistance 5.5
Coefficient
of 5 x 10⁻⁴
Composition
75% Tungsten, 25%
[image:3.595.307.554.588.715.2]Figure 3: Graph of Surface Roughness, Ra versus Peak Current (A)
Figure 4: Graph of Surface Roughness, Ra, versus Pulse on Time (µs)
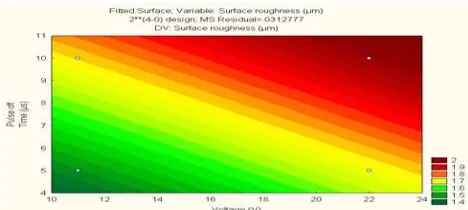
Figure 5 present a three-dimensional surface plot of the data for pulse on time, 5 (µs) and peak current, 7 A. Notice that the effect of the interaction between pulse off time, (µs) and voltage (V) in the data is “twist” plane, so that there is curvature in the response function to the surface roughness. If the data contain no interaction, the surface plot is a plane lying above the peak current and pulse on time.
Fitted Surf ace; Variable: Surf ace roughness (µm) 2**(4-0) design; MS Residual=.0312777
DV: Surf ace roughness (µm)
2 1.9 1.8 1.7 1.6 1.5 1.4
Figure 5: 3-D surface plots of the main effects of the voltage and pulse off time
[image:4.595.50.281.293.426.2]While, figure 6 shows the two –dimensional with the distribution effect of surface roughness
Figure 6: 2-D fitted surface distribution of effect between two factors
B. Material Removal Rate, MRR Analysis
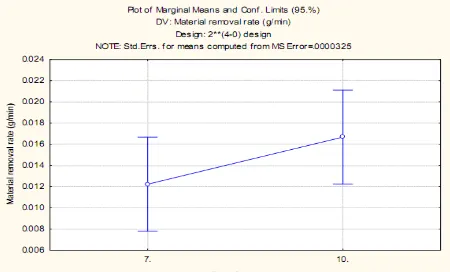
According to Figure 7, it shows that the higher Pulse On time will gives the higher value of MRR of WC-Co. Figure 8 shows that when the voltage is increased, the MRR will follow increased. Other than that, figure 9 shows that the result of graph is similar with figure 8; when the peak current is increased, MRR will follow increase. For the Figure 10 shows that the increasing of pulse off time, will decrease the MRR but it does not give significant effect to MRR, because the effect is too small.
Figure7: Graph of Material removal rate,MRR versus Pulse on Time, (µs)
[image:4.595.47.280.550.693.2] [image:4.595.306.534.559.711.2]Figure 9: Graph of Material removal rate, MRR versus peak current (A)
[image:5.595.307.531.346.472.2]Figure 10: Graph of Material removal rate,MRR, versus Pulse off Time, (µs)
Figure 11 will shows a three-dimensional surface plot of data for peak current, 10 A and pulse off time, 5 µs. There is showing the effect of the interaction between pulse on time and voltage but the higher voltage gives the higher value of MRR. So, there is curvature in the response function to the MRR. Invert with the pulse on time because the maximum pulse on time result shows the low value of MRR.
Figure 11: 3-D surface plots of the main effects of the voltage and pulse on time
C. Electrode Wear (EW) Analysis
According to Figure 12, it shows that the higher Pulse Off time will gives the low EW of WC-Co. Figure 13 shows that the result of the graph is different with the result in Figure 12; when the peak current are increased the electrode wear will followed increased. Other than that, figure 14 shows the result of graph same with figure 15 because when the voltage and pulse on time increased, the EW will also increase. For the figure 14 and figure 15 shows that these factors does not give significant effect to EW, because the graph is almost flat.
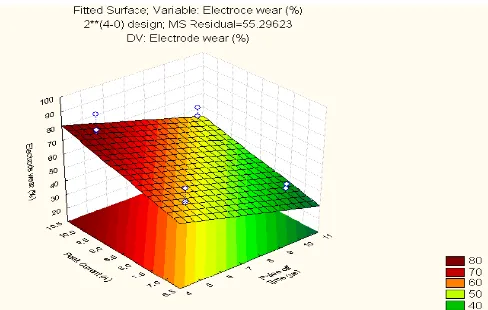
From Figure 16 present a three-dimensional surface plot of the data for voltage, 11V and pulse on time, 5 µs. Notice that the effect of the interaction between peak current, and pulse off time, (µs) in the data is “twist” plane, so that there is curvature in the response function to the electrode wear. If the data contain no interaction, the surface plot is a plane lying above the peak current and pulse off time
.
[image:5.595.309.535.525.662.2]Figure 12: Graph of Electrode Wear versus Pulse off Time (µs)
[image:5.595.52.285.552.711.2]Figure 14: Graph of Electrode Wear, EW versus voltage, (V)
Figure 15: Graph of Electrode Wear, EW versus Pulse on Time, (µs)
Figure 16: 3-D surface plots of the main effects of the peak current and pulse on time
V. CONCLUSION
Basically, this investigation is successful achieved the objective with the acceptable outcome. This experiment evaluates the machining of Tungsten Carbide with a Copper Tungsten as electrode. The Full Factorial Design of Experiment (DOE) is very useful in analyzing the optimum
condition of parameters, main effect, and the significance of individual parameter to surface roughness, material removal rate and electrode wear of material.
In the case of the Ra parameter, the most influential factors were voltage followed by the pulse off time, while the peak current and pulse on time was not significant at the considered confidence level. In order to obtain a good surface finish in the case of tungsten carbide, low values should be used for peak current, pulse off time and voltage. In the case of material removal rate, it was seen that pulse on time factor was the most influential, followed by voltage, peak current, and pulse off time.
In order to obtain high values of material removal rate for the case of tungsten carbide, within the work interval considered in this study, one should use, high values for peak current and voltage. Finally, in the case of electrode wear, it was observed that the most influential were pulse off time, followed by the peak current factor. Therefore, in order to be able to obtain low values of electrode wear, high values of the pulse off time and low values peak current should be used.
REFERENCES
[1]Pandey, P.C., and Shah, H.S. (1980). Modern Machining Processes. New Delhi. Tata Mcgraw-Hill.
[2]Mr. Mohd Yussni Bin Yaakob(2008).Electrical Discharge Machining-Die Sinking.Universiti Tun Hussein On Malaysia (UTHM).
[3] S. H. Lee and X. P. Li,(2001).Study of the effect of machining parameters on the machining characteristics in electrical discharge machining of tungsten carbide, The National University of Singapore
[4] Mikael Christensen and Göran Wahnström*(2005).Interface-controlled properties of WC-Co cemented carbides ; Department of Applied Physics, Chalmers University of Technology, SE-412 96 Göteborg, Sweden
[5]Van Tri, N. (2002). Electrical discharge machining of aluminum alloy using classical design of experiment approach. Universiti Teknologi Malaysia: Master Thesis.
[6]Puertas, I., and Perez , C.J .L. (2003). Modelling the Manufacturing Parameters in Electrical Discharge Machining of Siliconiz ed Silicon Carbide. Proceedings of the Institution of Mecahnical Engineers. Proq uest Science J ournals. 217, 6; 791- 803
[7]Puertas, I., Luis, C.J . and Alvarez , L. (2004). Analysis of the Influence of EDM Parameters on Surface Quality , MRR and EW of WC-Co. Journal of Material Processing Technology.
[8]Mahajan, V.K. (1981). Tool & Die Maker. New Delhi: Tata McGraw-Hill
[9]Wong, Y .S., Lim, L.C., and Lee, L.C. (1995). Effect of Flushing on Electro Discharge Machined Surface. J. of Materials Processing Technology. 48: 299-305
[10]Sommer, C. (2000). Non-traditional machining handbook. First edition. Advance Publishing. Houston.
[11]Noordin M.Y . (2003). Performance Evaluation of Coated Carbide Cermet Tools When Turning Hardened Tool Steel. PhD Thesis. Universiti Teknologi Malaysia
[12]Montgomery, D.C. (2001). Design and analysis of experiments. Fifth edition. J ohn Wiley & Sons,New York
[13]Diamond, W.J . (2001). Practical experiment design for engineers and scientists. Third edition. John Wiley & Sons. New York [14]Lochner, R.H., and Matar, J .E. (1990). Designing for quality; an
[image:6.595.50.294.474.629.2]![Table 1: Workpiece material properties [8]](https://thumb-us.123doks.com/thumbv2/123dok_us/1320073.662447/3.595.307.554.588.715/table-workpiece-material-properties.webp)