1874
Word Embedding-Based Automatic MT Evaluation Metric
using Word Position Information
Hiroshi Echizen’ya
Department of Life Science and Technology Hokkai-Gakuen University, Japan [email protected]
Kenji Araki
Graduate School of Information Science and Technology Hokkaido University, Japan [email protected]
Eduard Hovy
Language Technologies Institute Carnegie Mellon University, USA
Abstract
We propose a new automatic evaluation ric for machine translation. Our proposed met-ric is obtained by adjusting the Earth Mover’s Distance (EMD) to the evaluation task. The EMD measure is used to obtain the distance between two probability distributions con-sisting of some signatures having a feature and a weight. We use word embeddings, sentence-leveltf ·idf, and cosine similarity between two word embeddings, respectively, as the features, weight, and the distance be-tween two features. Results show that our proposed metric can evaluate machine trans-lation based on word meaning. Moreover, for distance, cosine similarity and word po-sition information are used to address word-order differences. We designate this met-ric asWordEmbedding-based automatic MT evaluation using Word Position Information (WE WPI). A meta-evaluation using WMT16 metrics shared task set indicates that our WE WPI achieves the highest correlation with human judgment among several representative metrics.
1 Introduction
Recent advances in neural machine translation (NMT) (Sutskever et al., 2014; Luong et al., 2015) are remarkable. Results based on hu-man evaluation have demonstrated that NMT out-performs statistical machine translations signifi-cantly (Chiang, 2005; Tufis¸ and Ceaus¸u, 2009). The NMT achieved especially high performance in terms of fluency. However, it tends to gener-ate more omission errors than statistical machine translations generate. Unfortunately, it is
diffi-cult for automatic evaluation metrics to evaluate outputs with omission errors because those errors are not included as non-match words between the translation and reference. For such cases, the word embedding-based automatic MT evaluation met-ric, which is based on word position information, is effective.
Various automatic evaluation metrics have been proposed for machine translation, but none is suf-ficient for NMT. Actually, BLEU (Papineni et al., 2002) is the representative metric based on n-gram matching. Unfortunately, because it is a surface-level metric, it is difficult to address word meaning during evaluation for MT out-puts. The word-embedding-based distance mea-sure for document (Kusner et al., 2016) and the word-alignment-based automatic evaluation met-ric using word embedding (Matsuo et al., 2017) are effective to address word meanings. Never-theless, they can only ineffectively accommodate word order differences between the translation and reference.
In our proposed metric, the word embeddings and the sentence-leveltf ·idf respectively denote the feature and the weight. Consequently, our pro-posed metric can produce an evaluation based on the word meaning. Moreover, our proposed met-ric uses word position information in the distance between two word embeddings. The distance is obtained using cosine similarity and the difference of word position between the translation and refer-ence. Results demonstrate that our proposed met-ric can evaluate translations also considering word order differences. We designate this new metric as
WordEmbedding-based automatic MT evaluation usingWordPositionInformation (WE WPI).
The experimentally obtained results based on the WMT16 metrics shared task (Bojar et al.,
2016) demonstrated that our WE WPI
achieves the highest correlation with human
judgment among several metrics: BLEU,
METEOR (Banerjee and Lavie, 2005), IM-PACT (Echizen-ya and Araki, 2007), and RIBES (Isozaki et al., 2010). Moreover, the correlation of WE WPI is better than that of WE WPI without word position information (WE). Results therefore confirmed the effective-ness of WE WPI using word position information.
2 Related Work
Kusner et al. (2016) proposed the Word Mover’s Distance (WMD) as a distance measure using word embedding and word alignment. This mea-sure obtains the distance between two documents adjusting EMD to a document. However, it cannot accommodate differences of word order between the translation and reference. Matsuo et al. (2017) also proposed a word-alignment-based automatic evaluation metric using word embeddings for segment-level evaluation. As described in that pa-per, Maximum Alignment Similarity (MAS) was found to have higher correlation with human eval-uation than BLEU for European-to-English, which has similar grammar structures. For Japanese-to-English, which has different grammar structures, Average Alignment Similarity (AAS) showed bet-ter correlation with human evaluation than other metrics. However, neither MAS nor AAS uses word position information. Therefore, neither can sufficiently accommodate word order differences. Actually, WE WPI uses not only the word align-ment but also word position information.
One system, DREEM (Chen and Guo, 2015),
learns distributed word representations from a neural network model and from distributed sen-tence representations computed with a recursive autoencoder. Moreover, it uses a penalty based on translation and reference lengths. By contrast, the WE WPI system specifically examines the dif-ference between the word positions of the transla-tion and reference, not the difference of lengths between the translation and reference. Therefore, it can sufficiently accommodate word order differ-ences. Moreover, it can evaluate the translation efficiently using word embeddings of target lan-guages without requiring large amounts of data or learning time. Our WE WPI requires no learn-ing of billearn-ingual knowledge or a relation between translation and reference. It needs only a model of word embeddings in advance to apply EMD to the automatic MT evaluation task.
In a non-trained evaluation metric, MEANT 2.0 (Lo, 2017; Bojar et al., 2017) uses a distri-butional word vector model to evaluate lexical semantic similarity and shallow semantic parses to evaluate structural semantic similarity between the translation and reference. It is a new ver-sion of MEANT (Lo and Wu, 2011), which is a non-ensemble and untrained metric. Moreover, MEANT 2.0 - nosrl is a subversion of MEANT 2.0 to evaluate the translation for any output lan-guage by removing the dependence on semantic parsers for semantic role labeling (SRL). In that case, phrasal similarity is calculated using n-gram lexical similarities. However, MEANT 2.0 se-ries do not specifically examine the position of each word in the translation and reference. Re-sults show that it is difficult to deal sufficiently with language pairs for which the grammar differs. In WE WPI, the evaluation score is calculated us-ing the relative difference between the positions of each word in the translation and reference. There-fore, WE WPI can evaluate translations dealing with word order in languages pairs for which the grammar differs.
3 Word Embedding-Based Automatic Evaluation Metric with Word Position Information (WE WPI)
3.1 The Earth Mover’s Distance (EMD)
3.1.1 Definitions
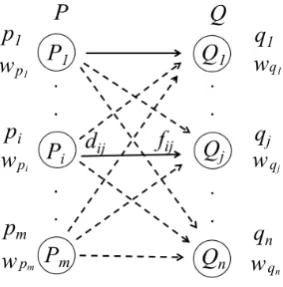
Figure 1: Outline of EMD.
automatic MT evaluation task. First, we describe EMD. Figure 1 depicts an outline of EMD.
In Figure 1, two probability distributions are presented respectively as P and Q. The P and
Q consist of somePi andQj, which are the
re-spective signatures. Each signature consists of a feature (i.e., pi inPi andqj in Qj) and a weight
(i.e., wpi in Pi and wqj in Qj). Therefore, two probability distributionsP andQare defined re-spectively as P = {(p1, wp1)...(pm, wpm)} and
Q = {(q1, wq1)...(qn, wqn)}. Moreover,dij rep-resents the distance between two features pi and
qj.
The goal of EMD is to obtain total flow F = [fij]that minimizes the overall cost from the
per-spective of a transportation problem. In that case, the overall cost is defined as Eq. (1).
W ORK(P, Q, F) =
m
∑
i=1
n
∑
j=1
dijfij (1)
Moreover, four constraints are defined for fij,
which is the transportation amount in the trans-portation problem, to find minimumF as the fol-lowing Eqs. (2)–(5):
fij ≥0 1< i < m, 1< j < n (2)
n
∑
j=1
fij < wpi 1< i < m (3)
m
∑
i=1
fij < wqj 1< j < n (4)
m
∑
i=1
n
∑
j=1
fij =min
∑m
i=1
wpi,
n
∑
j=1
wqj (5)
Constraint (2) shows that each amount of weightfijis transported only in the direction from
signature Pi to signature Qj to be nonnegative.
In Constraint (3), the amount of weight which is supplied fromPi (i.e.,
∑n
j=1fij) does not exceed
wpi, which is the weight ofPi. Moreover, in Con-straint (4), the amount of weight which Qj
re-ceives (i.e.,∑mi=1fij) does not exceedwqj, which is the weight ofQj. Finally, the total amount of
weight is equal to the weight of the lighter distri-bution in Constraint (5). In Eqs. (1)–(5),mshows the number of signatures inP;nshows the num-ber of signatures inQ.
The EMD is defined as shown below.
EM D(P, Q) = min(∑W ORKm (P, Q, F))
i=1 ∑n
j=1fij
(6)
In Eq. (6), themin(W ORK(P, Q, F))is nor-malized by the minimum amount of work of Eq. (5).
3.1.2 Computing EMD
P1 P2 P3 P4
p1 wp1 p2 wp2 p3 wp3 p4 wp4
(1,5) 0.6 (5,5) 0.6 (1,1) 0.6 (5,1) 0.6
Table 1: Examples of signatures ofP.
Q1 Q2 Q3
q1 wq1 q2 wq2 q3 wq3
(2,3) 0.8 (4,3) 0.8 (3,2) 0.8
[image:3.595.94.291.612.772.2]Table 2: Examples of signatures ofQ.
Figure 2: Example of EMD calculation.
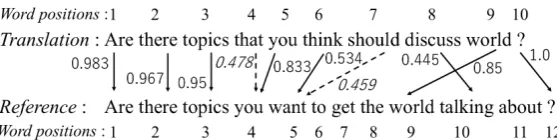
Figure 3: Example of word alignment by WE WPI.
In Tables 1 and 2, all features pi and qj
corre-spond to the coordinate (x, y) of two-dimensional surface.
Figure 2 depicts an example of an EMD calcu-lation based on the signatures in Tables 1 and 2. In Figure 2, the green arrow indicates the amount of weight fij. Allfij are transported only in the
direction from Pi to Qj according to Constraint
(2). In each signaturePi,
∑n
j=1fij does not
ex-ceed wpi by Constraint (3). For example, in P3, ∑3
j=1f3j is 0.6 (=0.2+0.0+0.4). It does not
ex-ceed 0.6, which is the weight of P3. Moreover,
in each signature Qj,
∑m
i=1fij does not exceed
wqj according to Constraint (4). For example, in
Q1, ∑4i=1fi1 is 0.8 (=0.6+0.0+0.2+0.0). It does
not exceed 0.8, which corresponds to the weight of
Q1. The total amount of weight by ∑m
i=1 ∑n
j=1fij
is 2.4. It is equal to 2.4 by ∑mi=1wpi or 2.4 by ∑n
j=1wqj. Therefore, this example of Figure 2 conforms to Constraint (5).
Moreover, the distance between two features is necessary to obtain EMD. When the Euclidean distance is used as the calculation of distance in this example, 2.236 (=√12+ 22) is obtained as
d11, d22, d31, d33, d42, and d43, and other
dis-tances are 3.606 (=√22+ 32) in Figure 2. As a
re-sult, 5.366 (=2.236×(0.6+0.6+0.2+0.4+0.2+0.4)) is obtained as the value of EMD by two probability distributionsPandQin Tables 1 and 2.
We obtain WE WPI adjusting EMD to the au-tomatic MT evaluation task. Details of application of EMD to WE WPI are presented in3.2.2.
3.2 New Automatic MT Evaluation Metric:
WE WPI
3.2.1 Word Alignment using Position Information
For the application of EMD to automatic MT eval-uation, we use word alignment results. Word alignment is done using cosine similarity based on word embeddings and the relative difference between the word positions in the translation and reference. In that case, WE WPI obtains
align scoreusing Eqs. (7) and (8) presented be-low.
align score
=cos sim(ti, rj)×(1.0−pos inf(Ti, Rj)) (7)
pos inf(Ti, Rj) =
pos(Ti)
m −
pos(Rj)
n
(8) In Eq. (7),ti andrj respectively represent the
word embeddings of wordTiin the translation and
word Rj in the reference. The cos sim(ti, rj)
denotes the cosine similarity between ti and rj.
Moreover,pos inf(Ti, Rj)represents the relative
difference between the position of wordTi in the
translation and the position of wordRj in the
ref-erence. It is defined as Eq. (8). In Eq. (8),
pos(Ti) andpos(Rj) respectively denote the
po-sitions of word Ti in the translation and word
Rj in the reference. Actually, m and n
respec-tively denote the word numbers in the transla-tion and reference. Thepos inf(Ti, Rj)becomes
larger as the relative difference between pos(Ti)
andpos(Rj) becomes larger . Therefore, (1.0−
pos inf(Ti, Rj)) is used as the negative weight
forcos sim(ti, rj). The ranges ofcos sim(ti, rj)
and pos inf(Ti, Rj) are both 0.0-1.0. Figure 3
depicts an example of word alignment using Eqs. (7) and (8).
The WE WPI calculatesalign scorebetween a word in the translation and all words in reference. Based on those results, the word with the highest
align scorein the reference is selected as the cor-responding word to the word in the translation. In Figure 3, the align score between “that” in the translation and “you” in the reference is the high-est (i.e., 0.478) among the align score between “that” in the translation and all words in the ref-erence. However, it is lower than thealign score
reference
Are there topics you want to get the world talking about ? Are 0.017 1.0 1.0 1.0 1.0 1.0 1.0 1.0 1.0 1.0 1.0 1.0 there 1.0 0.033 1.0 1.0 1.0 1.0 1.0 1.0 1.0 1.0 1.0 1.0 topics 1.0 1.0 0.049 1.0 1.0 1.0 1.0 1.0 1.0 1.0 1.0 1.0 that 1.0 1.0 1.0 1.0 1.0 1.0 1.0 1.0 1.0 1.0 1.0 1.0 trans- you 1.0 1.0 1.0 0.154 1.0 1.0 1.0 1.0 1.0 1.0 1.0 1.0 lation think 1.0 1.0 1.0 1.0 0.456 1.0 1.0 1.0 1.0 1.0 1.0 1.0 should 1.0 1.0 1.0 1.0 1.0 1.0 1.0 1.0 1.0 1.0 1.0 1.0 discuss 1.0 1.0 1.0 1.0 1.0 1.0 1.0 1.0 1.0 0.555 1.0 1.0 world 1.0 1.0 1.0 1.0 1.0 1.0 1.0 1.0 0.139 1.0 1.0 1.0
[image:5.595.86.515.61.186.2]? 1.0 1.0 1.0 1.0 1.0 1.0 1.0 1.0 1.0 1.0 1.0 0.0
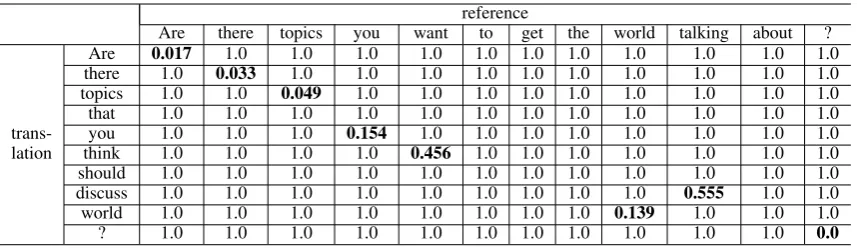
Table 3: Distance matrix incorporating translation and reference.
corresponds to “should” in the translation cannot be obtained in the reference.
In contrast, “discuss” in the translation cor-responds to “talking” in the reference using
pos inf(Ti, Rj)of Eq. (8) although “discuss” in
the translation corresponds to “topics” in the refer-ence when(1.0−pos inf(Ti, Rj))is not used in
Eq. (7) (i.e.,align score=cos sim(ti, rj)). The
0.477, which is the cos sim between “discuss” in the translation and “topics” in the reference, is greater than 0.460, which is thecos simbetween “discuss” in the translation and “talking” in the reference. Here, pos inf(Ti, Rj) between
“dis-cuss” in the translation and “talking” in the refer-ence is 0.033 (8
10− 10 12
). That between “discuss” in the translation and “topics” in the reference is 0.550 (108 − 123). Consequently, thealign score
of “discuss” in the translation and “talking” in the reference is 0.445 (0.460×(1.0−0.033)). That of “discuss” in the translation and “topics” in the ref-erence is 0.215 (0.477×(1.0−0.550)) using Eq. (7). The WE WPI can select “talking” in the ref-erence as the corresponding word for “discuss” in the translation usingpos inf(Ti, Rj). The use of
pos inf(Ti, Rj) is effective for the correct word
alignment.
3.2.2 Adjustment of EMD to the Automatic
MT Evaluation Metric
We obtain WE WPI as new automatic MT evalua-tion metrics by adjusting EMD to the automatic MT evaluation task. In WE WPI, the variables
P and Q in Figure 1 respectively correspond to a translation T and reference R. Moreover, the features (i.e., pi and qj in Figure 1), the weight
(i.e., wpi andwqj in Figure 1), and distance (i.e.,
dij in Figure 1) are required as parameters to
ad-just EMD to the automatic MT evaluation task. As described herein, we use the word embeddings as features and the sentence-level tf ·idf as the
weight. The weight definition is presented in Eq. (9) below.
w=tf×
( logN
df + 1.0
)
(9)
In Eq. (9),tfdenotes the appearance frequency of a word in a translation or reference. In addition,
dfrepresents the number of sentences in which the word appears in all translations or references. In addition,N is the total number of translations or references. Actually, WE WPI distinguishes the function word and the content word using Eq. (9). Furthermore,wtiof the word in the translation and
wri of the word in the reference by Eq. (9) are normalized respectively using the following Eqs. (10) and (11).
˜
wti =
wti ∑m
i=1wti
(10)
˜
wrj =
wrj ∑n
j=1wrj
(11)
The dependence of win Eq. (9) by difference of dataset can be kept to the minimum by normal-izing Eqs. (10) and (11). Moreover, we define distancedij, which is ascertained from the result
of the word alignment described in3.2.1. Thedij
is obtained using the following Eq. (12):
dij =
1.0−cos sim(ti, rj)
×e−pos inf(Ti,Rj) if Ti corresponds toRj
1.0 ifTi does not correspond toRj
(12) In Eq. (12), 1.0 − cos sim(ti, rj) ×
e−pos inf(Ti,Rj) is used as d
ij when word Ti in
the translation corresponds to word Rj in the
reference by the word alignment result. The
pos inf(Ti, Rj) is obtained by Eq. (8). Here,
tiandrj respectively correspond to the word
cs-en de-en fi-en ro-en ru-en tr-en
Human RR DA RR DA RR DA RR DA RR DA RR DA
Systems 6 6 10 10 9 9 7 7 10 10 8 8
[image:6.595.83.518.61.175.2]mtevalBLEU .992 .989 .905 .808 .858 .864 .899 .840 .962 .837 .899 .895 METEOR .995 .991 .935 .887 .952 .963 .934 .909 .987 .930 .965 .980 IMPACT .997 .990 .925 .841 .908 .915 .903 .819 .962 .840 .952 .959 RIBES .995 .990 .948 .891 .894 .901 .954 .794 .972 .864 .850 .868 MEANT 2.0 (Lo,2017) .989 .990 .947 .950 .953 .966 .940 .946 .990 .959 .980 .990 MEANT 2.0-nosrl .985 .988 .928 .942 .969 .979 .917 .930 .984 .958 .978 .987 WE .986 .976 .918 .903 .954 .963 .885 .884 .989 .938 .976 .991 WE WPI .991 .980 .958 .927 .955 .957 .919 .877 .991 .926 .977 .993
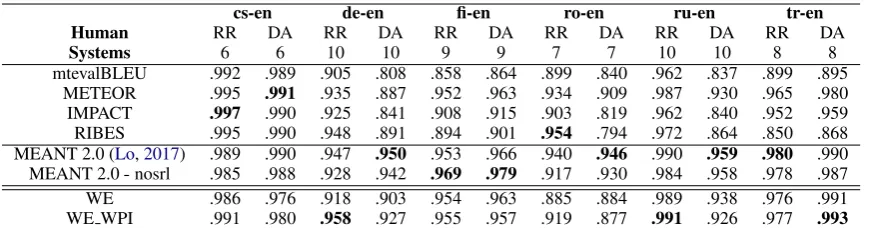
Table 4: Absolute Pearson correlation of to-English system-level metric with human assessment variants: RR, standard WMT relative ranking; DA, direct assessment of translation adequacy.
en-cs en-de en-fi en-ro en-ru en-tr
Human RR DA RR DA RR DA RR DA RR DA RR DA
Systems 10 15 13 12 12 12 8
mtevalBLEU .968 - .752 - .868 - .897 - .835 .838 .745
-METEOR .960 - .631 - .939 - .873 - .868 .879 .800
-IMPACT .978 - .719 - .924 - .911 - .874 .879 .844
-RIBES .968 - .742 - .949 - .910 - .895 .904 .883
-MEANT 2.0 (Lo,2017) - - .540 - - -
-MEANT 2.0-norsrl .967 - .541 - .902 - .868 - .925 .946 .933
-WE .962 - .609 - .925 - .878 - .899 .910 .930
-WE WPI .967 - .780 - .931 - .917 - .914 .923 .944
-Table 5: Absolute Pearson correlation of out-of-English system-level metric with human assessment variants: RR, standard WMT relative ranking; DA, direct assessment of translation adequacy.
tocos sim(ti, rj) because it becomes smaller as
pos inf(Ti, Rj) becomes larger. As a result,dij
becomes large when the relative difference be-tween the position of word Ti in the translation
and the position of wordRj in the reference (i.e.,
pos inf(Ti, Rj)) is large. Thedij by Eq. (12) is
1.0 when wordTidoes not correspond to wordRj.
Finally, the range ofdij becomes 0.0-1.0.
Moreover, the WE WPI generates the distance matrix usingdij in Eq. (12). Table 3 presents the
distance matrix between the translation “Are there topics that you think should discuss world?” and the reference “Are there topics you want to get the world talking about?” in Figure 3. In Table 3, the bold typeface represents the distance between the two aligned words. The distance matrix using Eq. (12) is effective because it is not influenced by the words which are not aligned between the translation and reference.
The WE WPI obtains the evaluation score by word embedding, sentence-leveltf ·idf, and the distance matrix based on Eq. (12). The evaluation score of WE WPI is obtained as Eq. (13).
W E W P I(T, R) = 1.0−min(∑W ORKm (T, R, F))
i=1 ∑n
j=1fij
(13)
In that equation, the range of
min∑(W ORK(T,R,F)) m
i=1
∑n j=1fij
becomes 0.0-1.0 using
the weights normalized by Eqs. (10) and (11). Near 0.0, the distance betweenT andR is small. However, in the automatic MT evaluation metrics, the score is close to 1.0 when the evaluation for the translation is generally high. Therefore, we obtain W E W P I by taking the value of
min∑(W ORK(T,R,F)) m
i=1
∑n j=1fij
from 1.0. As a result, in
between the translation “Are there topics that you think should discuss world?” and the reference “Are there topics you want to get the world talking about?”, 0.608 is obtained as the score using Eq. (13).
The WE WPI can evaluate the translation based on the meanings of words using word embedding. Moreover, it can deal with the word order using the relative difference between the positions of words in the translation and the reference.
4 Experiments
4.1 Experiment Data and Procedure
cs-en de-en fi-en ro-en ru-en tr-en
Human RR DA RR DA RR DA RR DA RR DA RR DA
♯Assessments 70k 12k 15k 12k 19k 14k 11k 12k 18k 13k 7k 13k ♯Translations 8.6k 560 2.4k 560 4.6k 560 2.2k 560 4.7k 560 2.2k 560
Correlation τ r τ r τ r τ r τ r τ r
[image:7.595.85.515.62.196.2]sentBLEU .284 .557 .368 .484 .265 .448 .272 .499 .330 .502 .245 .532 METEOR .391 .636 .393 .500 .351 .539 .297 .578 .370 .541 .334 .604 IMPACT .338 .624 .342 .535 .301 .510 .248 .531 .309 .541 .282 .602 RIBES .254 .530 .288 .415 .237 .372 .176 .375 .240 .401 .213 .336 MEANT 2.0 (Lo,2017) .355 .674 .414 .539 .453 .510 .345 .607 .401 .535 .373 .588 MEANT 2.0-nosrl .347 .672 .411 .522 .438 .484 .338 .587 .400 .540 .364 .577 WE .372 .617 .395 .472 .365 .517 .316 .545 .362 .523 .346 .572 WE WPI .387 .649 .417 .548 .361 .540 .308 .555 .371 .555 .347 .625
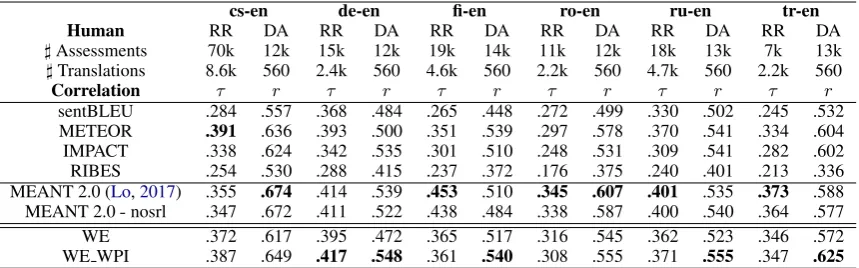
Table 6: Segment-level metric results for to-English language pairs with absolute values of correlation coefficients reported for all metrics: correlation of segment-level metric scores with human assessment variants, whereτ are official results computed similarly to Kendall’sτ and over standard WMT relative ranking (RR) human assess-ments;rare Pearson correlation coefficients of metric scores with direct assessment (DA) of absolute translation adequacy.
en-cs en-de en-fi en-ro en-ru en-tr
Human RR DA RR DA RR DA RR DA RR DA RR DA
♯Assessments 118k - 35k - 31k - 7k - 21k 20k 7k
-♯Translations 12.9k - 6.2k - 4.1k - 1.9k - 6.0k - 3.0k
-Correlation τ r τ r τ r τ r τ r τ r
sentBLEU .223 - .269 - .145 - .171 - .283 .557 .171 -METEOR .245 - .268 - .189 - .177 - .309 .600 .207 -IMPACT .240 - .263 - .170 - .180 - .297 .609 .231 -RIBES .139 - .188 - .057 - .101 - .206 .442 .153
-WE .359 - .347 - .360 - .285 - .427 .625 .336
-WE WPI .352 - .371 - .357 - .283 - .424 .652 .370
-Table 7: Segment-level metric results for out-of-English language pairs with the absolute values of correlation coefficients reported for all metrics: absolute correlation of segment-level metric scores with human assessment variants, whereτ are official results computed similarly to Kendall’sτ and over standard WMT relative ranking (RR) human assessments;rare Pearson correlation coefficients of metric scores with direct assessment (DA) of absolute translation adequacy.
Therefore, we can readily obtain the correlation coefficient between the metrics and human judgments in WMT16 metrics shared task. The WMT16 metrics task includes English paired with Czech, German, Finnish, Romanian, Russian, and Turkish. For all translations, references and scores by human judgment in these language pairs are obtained from the url described above.
For these experiments, we used different au-tomatic MT evaluation metrics for comparison with our WE WPI: BLEU, METEOR, IMPACT, RIBES, and WE. Here, IMPACT and RIBES, which are surface-based metrics, are effective for language pairs with greatly different word order, such as English and Japanese. In addition, WE is an automatic MT evaluation metric that does not perform word alignment. It uses only dij =
1.0− cos sim(ti, rj) as the dij of Eq. (12) in
the WE WPI. In both WE and WE WPI, the word vectors for seven languages (i.e., English, Czech, German, Finnish, Romanian, Russian, and
Turk-ish) were obtained using fastText (Grave et al., 2018).
4.2 Experiment Results and Discussion
Tables 4 and 5 respectively present the correlation coefficient of to-English and out-of-English at the system level. Tables 6 and 7 respectively present the correlation coefficients of to-English and out-of-English at the segment level.
[image:7.595.108.493.271.384.2]Figure 4: To-English system-level metric significance test of results for human assessment variants, where DA denotes the direct assessment of translation adequacy. Green cells show a significant increase in correlation with human assessment for the metric in a given row over the metric in a given column according to the Williams test.
Figure 5: To-English system-level metric significance test of results for human assessment variants, where RR denotes the standard WMT relative ranking for the translation task system only. Green cells show a significant increase in correlation with human assessment for the metric in a given row over the metric in a given column according to the Williams test.
Figure 6: English-to-Russian system-level metric sig-nificance test of results for human assessment variants, where DA denotes direct assessment of translation ade-quacy. Green cells show a significant increase in corre-lation with human assessment for the metric in a given row over the metric in a given column according to the Williams test.
English-to-Turkish (en-tr), and Turkish-to-English (tr-en)). Therefore, the WE WPI is effective with such language pairs because it uses word position information.
Moreover, we investigated the significance of WE WPI results and those of other metrics ex-cept those of MEANT 2.0 and MEANT 2.0 -nosrl. As described herein, Williams significance test (Williams, 1959) was used to assess differ-ences in dependent correlations. Figures 4–9
present significance test results for every com-peting pair of metrics, including those of our WE WPI. However, the language pairs for which significant differences could not be obtained in any competing pair of metrics are excluded from Figures 4–9 (i.e., cs-en and fi-en in Figure 4, cs-en, fi-en and ro-en in Figure 5, en-cs in Figure 7).
In Figures 4–9, green cells signify that the ric shows significant difference from other met-rics with 95% or greater confidence. Results demonstrated that our WE WPI yielded signifi-cantly different results among metrics. Particu-larly, WE WPI was found to have significantly better results than those of WE at the segment level, as shown in Figures 8 and 9. This particular result demonstrates that the word position infor-mation in WE WPI is effective for segment-level evaluation.
Figure 7: Out-of-English system-level metric significance test of results for human assessment variants, where RR denotes the standard WMT relative ranking for translation task system only. Green cells show a significant increase in correlation with human assessment for the metric in a given row over the metric in a given column according to the Williams test.
Figure 8: To-English segment-level metric significance test of results for human assessment variants, where DA denotes direct assessment of translation adequacy. Green cells show marked benefits obtained with the metric in a given row over the metric in a given column according to the Williams test.
Figure 9: English-to-Russian segment-level metric sig-nificance test of results for human assessment variants, where DA denotes direct assessment of translation ade-quacy: green cells show marked benefits obtained with the metric in a given row over the metric in a given column according to the Williams test.
5 Conclusion
As described herein, we proposed WE WPI as a new automatic MT evaluation metric. It produces an evaluation based on the meanings of words
us-ing word embeddus-ing. Moreover, it can accommo-date word-order differences. Evaluation experi-ments demonstrated that our WE WPI obtains the highest correlation with human judgments among several representative metrics in language pairs for which the grammar differs, and demonstrated that it is significantly better than other metrics at segment-level evaluation.
Our future work will improve WE WPI to ob-tain high-quality evaluation scores in combination with other metrics. We will conduct evaluation ex-periments using various data. Moreover, we will use WE WPI to improve NMT quality. For in-stance, WE WPI can be used easily in Minimum Risk Training (MRT) (Shen et al., 2016), which minimizes the expected loss on the training data.
Acknowledgments
[image:9.595.113.222.487.600.2]References
Satanjeev Banerjee and Alon Lavie. 2005. Meteor: An automatic metric for mt evaluation with improved correlation with human judgments. InProceedings of the ACL 2005 Workshop on Intrinsic and Extrinsic
Evaluation Measures for MT and/or Summarization,
pages 65–72.
Ondˇrej Bojar, Yvette Graham, and Amir Kamran. 2017. Result of the wmt17 metrics shared task. In
Proceedings of the Second Conference on Machine
Translation (WMT17), pages 489–513.
Ondˇrej Bojar, Yvette Graham, Amir Kamran, and Miloˇs Stanojevi´c. 2016. Result of the wmt16 met-rics shared task. InProceedings of the Fifth
Confer-ence on Machine Translation, pages 199–231.
Boxing Chen and Hongyu Guo. 2015. Representation based translation evaluation metrics. InProceedings of the 53rd Annual Meeting of the Association for Computational Linguistics and the 7th International
Joint Conference on Natural Language Processing,
pages 150–155.
David Chiang. 2005. A hierarchical phrase-based model for statistical machine translation. In
Pro-ceedings of the 43rd Annual Meeting of the ACL,
pages 263–270.
Hiroshi Echizen-ya and Kenji Araki. 2007. Automatic evaluation of machine translation based on recursive acquisition of an intuitive common parts continuum.
InProceedings of the Eleventh Machine Translation
Summit, pages 151–158.
Edouard Grave, Piotr Bojanowski, Prakhar Gupta, Ar-mand Joulin, and Tomas Mikolov. 2018. Learning word vectors for 157 languages. In Proceedings of the International Conference on Language
Re-sources and Evaluation (LREC 2018), pages 3483–
3487.
Hideki Isozaki, Tsutomu Hirao, Kevin Duh, Katsuhito Sudoh, and Hajime Tsukada. 2010. Automatic eval-uation of translation quality for distant language pairs. In Proceedings of the 2010 Conference on Empirical Methods in Natural Language Process-ing, pages 944–952.
Matt J. Kusner, Yu Sun, Nicholas I. Kolkin, and Kil-lian Q. Weinberger. 2016. From word embed-dings to document distance. In Proceedings of the 32nd International Conference on Machine Learn-ing, pages 957–966.
Chi–kiu Lo. 2017. Meant 2.0: Accurate semantic mt evaluation for any output language. InProceedings of the Second Conference on Machine Translation
(WMT17), pages 589–597.
Chi–kiu Lo and Dekai Wu. 2011. Meant: An inexpen-sive, high-accuracy, semi-automatic metric for eval-uating translation utility based on semantic roles. In
Proceedings of the 49th Annual Meeting of the ACL:
Human Language Technologies, pages 220–229.
Minh-Thang Luong, Hieu Pham, and Christopher D. Manning. 2015. Effective approaches to attention-based neural machine translation. InProceedings of the 2015 Conference on Empirical Methods in
Nat-ural Language Processing, pages 1412–1421.
Junki Matsuo, Mamoru Komachi, and Katsuhito Su-doh. 2017. Word-alignment-based segment-level machine translation evaluation using word embed-dings. arXiv:1704.00380. Version 1.
Kishore Papineni, Salim Roukos, Todd Ward, and Wei-Jing Zhu. 2002. Bleu: a method for automatic eval-uation of machine translation. InProceedings of the 40th Annual Meeting of the Association for Compu-tational Linguistics, pages 311–318.
Yossi Rubner, Carlo Tomasi, and Leonidas J. Gubas. 1998. A metric for distributions with applications to image databases. InProceedings of ICCV, pages 59–66.
Yossi Rubner, Carlo Tomasi, and Leonidas J. Gubas. 2000. The earth mover’s distance as a metric for image retrieval. International Journal of Computer Vision, 40(12):99–121.
Shiqi Shen, Yong Cheng, Zhongjun He, Wei He, Hua Wu, Maosong Sun, and Yang Liu. 2016. Minimum risk training for neural machine translation. In
Pro-ceedings of the 54th Annual Meeting of the ACL,
pages 1683–1692.
Ilya Sutskever, Oriol Vinyals, and Quoc V. Le. 2014. Sequence to sequence learning with neural networks.
Neural Information Processing Systems,
arXiv:1409.3215. Version 3.
Dan Tufis¸ and Alexandru Ceaus¸u. 2009. Factored phrase-based statistical machine translation. In Pro-ceedings of the 5th Conference Speech Technology
and Human-Computer Dialogue, pages 1–7.