28
Journal of the Statistical and Social Inquiry Society of Ireland Vol. XXXIV
MAKING SENSE OF THE DATA ON IRELAND’S INWARD FDI
Frank Barry University College Dublin
and Clare O’Mahony Dublin Institute of Technology
(read before the Society, 17 November 2004)
__________________________________________________________
Abstract: Ireland, in employment terms, is the most FDI-intensive economy in the EU. International comparisons of trends and levels of FDI intensity are usually based on balance-of-payments data however, and the international data series on Ireland’s inward FDI tell hugely conflicting stories. Such series are published by the IMF, UNCTAD, OECD and Eurostat (with data generally provided either by the CSO or the IDA), while data on US FDI in Ireland are published by the US Bureau of Economic Analysis. The present paper documents these conflicting stories and searches for any underlying consistency through analysis of the items that the various databases include and exclude. FDI stock, flow and sectoral allocation data are explored and trends contrasted with what is known from MNC employment data
Keywords: Foreign Direct Investment; Inward FDI; FDI Stock; FDI Flow JEL Classification: F21
1. INTRODUCTION
The extent of Ireland’s FDI-intensity, in both manufacturing and services, is one of the defining features of the economy. Foreign-owned firms account for almost 50 percent of Irish manufacturing employment, compared to an average figure of 19 percent for the other 11 EU15 member states for which OECD (2001) presents data. The same source reports that a higher-than-average share of Ireland’s services sector is also under foreign ownership. Per head of population, UNCTAD data show that the Irish inward FDI stock for 2000 stands at twice the EU average level.
Two different types of data are employed in discussions of FDI. The details given above about Irish manufacturing and services use MNC activity data, which typically yield information on output and/or employment levels in firms under majority foreign ownership. FDI stocks and flows, on the other hand, are generally compiled from balance-of-payments data. Cross-country analyses almost invariably rely on this latter type of data – because cross-country MNC activity data sets are not readily available (other than for US-owned firms) – though activity data are widely agreed to be preferable; Lipsey (2003).1
FDI in both cases is defined as an investment that involves a lasting interest in an enterprise located in another economy. Its principal distinguishing feature is the significant influence the
1 Activity data, furthermore, are typically based on the nationality of ultimate ownership of the firms, while
29
foreign investor wields in management. The current international standard for FDI stock and flow data is set out in the 5th edition of the IMF Balance of Payments Manual published in 1993 (henceforth referred to as BPM5) and endorsed by the OECD in 1996 in the 3rd edition of its ‘Benchmark Definition of Foreign Direct Investment’ (which provides a detailed operational guide to the compilation of FDI data).2
For an investment to be classified as FDI in the balance of payments, the direct investor must own at least 10% of the ordinary shares or voting power of an incorporated enterprise or the equivalent for an unincorporated enterprise.3 Only investments funded through equity, intra-company loans or reinvested earnings are counted as FDI flows. Investments funded through equity or debt issues in the host-economy or on international capital markets, or through equity contributed by local partners in non-wholly owned foreign affiliates, are not included as FDI.4
Once a direct investment relationship between entities has been established, all subsequent financial flows are recorded as DI transactions except between MFIs (Monetary Financial Institutions) and other financial intermediaries where DI transactions are confined to those of a permanent capital nature; ECB (2002).
FDI data are available from a number of sources. The IMF, UNCTAD, EUROSTAT and the OECD all publish annual series on FDI flows, and several also publish series on FDI stocks. While most of these are based on data supplied by the CSO, one of the OECD series employs data provided by the IDA. The CSO itself published an FDI series up to 1987 and again from 1998 when it began to provide much more detailed information. FDI stocks and flows relating to US-owned firms are provided by the US Bureau of Economic Analysis.
A major difficulty arises however in that many of these series seem to bear little relationship to each other. Amongst the tasks that the present paper sets itself is to seek to determine why this is so, to search for any underlying consistency that may exist, and to give guidance as to the merits and demerits of the various series. In doing this, it also explores the relationship between these various series and the Forfás and CSO series on foreign-sector manufacturing employment. There is no particular reason to expect a strong or stable relationship between FDI and foreign-firm employment, given that capital-labour ratios will vary across time and across sectors and that FDI is not necessarily closely related to foreign-firm investment.5 Similar analyses have been carried out by Lipsey (2003) and UNCTAD (2001) however and some relationship between these types of series has indeed been found.
The paper is organised as follows. The next section explores the various series on FDI inflows. Section 3 looks at the sectoral destinations of FDI inflows. Section 4 explores the series on FDI stocks, and a final section examines the relationship between the FDI and foreign MNC employment series.
2 Both organisations have undertaken a number of surveys suggesting that implementation of the recommended
methodologies has improved over time, the most recent being the 2001 Survey of Implementation of Methodological Standards for Direct Investment (IMF/OECD 2004).
3
The CSO methodology also reflects particular European Central Bank and Eurostat interpretations of BPM5; CSO (2003).
4 Quijano (1990) reports that 81 percent of debt financing of foreign affiliates in the US occurs through US sources of
funds. An early study by Stewart (1985) on financing of a panel of foreign firms in Ireland found that bank borrowing (presumed to take place within Ireland) accounted for some 19 percent of gross funds in the 1964 to 1980 period.
5 Grubert and Mutti (1991) show that the FDI and foreign-firm investment series on US firms in Canada bear little
2. DATA SERIES ON FDI INFLOWS
Appendix Table 1 lists a number of series on FDI inflows to Ireland, all of which have been converted to US dollars, to facilitate comparison, using contemporary IMF conversion rates.
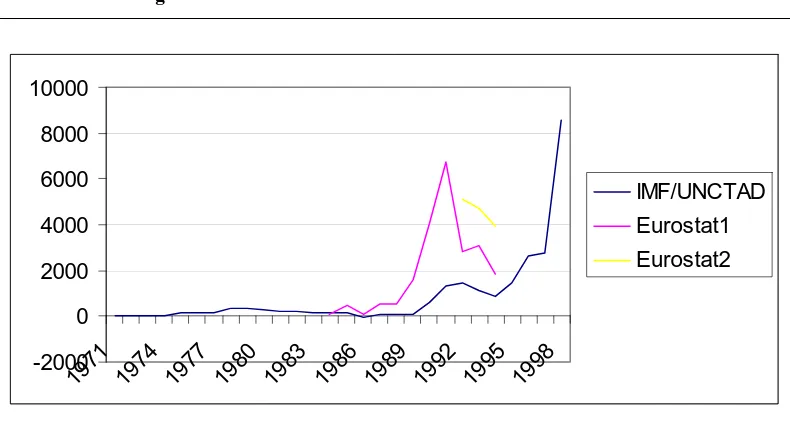
[image:3.595.100.495.253.466.2]The values reported by the IMF, UNCTAD and the OECD in one of its series (which we term OECD3) are similar, though the various series are updated at different times. We group these together as the IMF/UNCTAD series.6 There are clear breaks in this series in 1990 and 1998, as seen in Figure 1. The figure also depicts the Eurostat1 and Eurostat2 series. Both are seen to lie well above the IMF series in the mid-1990s.7
Figure 1: IMF/UNCTAD and Eurostat series on FDI inflows
-2000 0 2000 4000 6000 8000 10000
1971 1974 1977 1980 1983 1986 1989 1992 1995 1998
IMF/UNCTAD Eurostat1 Eurostat2
Figure 2 is drawn to a different scale and graphs the OECD2 series against that of the IMF. OECD2 starts off higher but crosses over in 1990 to become substantially lower.
6 The IMF series is from its Balance of Payments Statistics Yearbooks; the UNCTAD series is from its World Investment Reports, and this OECD series (which runs from 1990) is from the 2003 OECD International Investment Perspectives. The latter is stated to be sourced from the OECD International Direct Investment database but, as will be seen below, it differs sharply from the OECD2 series reported in some contemporary OECD International Direct Investment Statistics Yearbooks. There is yet another OECD series, OECD1 (not shown), which comes from the country aggregate tables in the 1993 and 2000 editions of the OECD International Direct Investment Statistics Yearbooks, and is largely in line with IMF data to 1998.
30
Figure 2: IMF/UNCTAD and OECD2 series on FDI Inflows
-500
0
500
1000
1500
2000
2500
3000
19
83
19
85
19
87
19
89
19
91
19
93
19
95
19
97
IMF/UNCTAD
OECD2
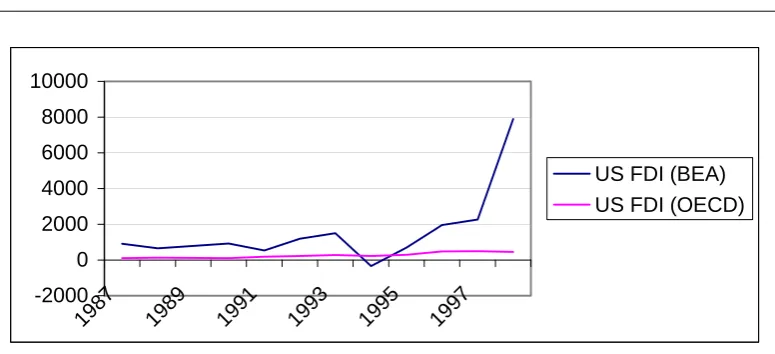
[image:4.595.105.493.373.550.2]Figure 3 graphs the two data sets on US FDI into Ireland; one published by the OECD and the other by the US BEA. The BEA values are above the OECD at all times other than 1994, when they dip negative.
Figure 3: Series on US FDI flows to Ireland (BEA and OECD)
-2000 0 2000 4000 6000 8000 10000
1987 198 9
1991 1993 1995 1997
US FDI (BEA) US FDI (OECD)
2.1 The IMF/UNCTAD Series
We begin with the IMF series. FDI funds, as we have pointed out, comprise equity, intra-company loans and reinvested earnings. The major determinant of the 1990 break in the IMF series was the inclusion of reinvested earnings (RIE) for the first time in that year. Thus the entire series up to 1990 underestimates FDI inflows.
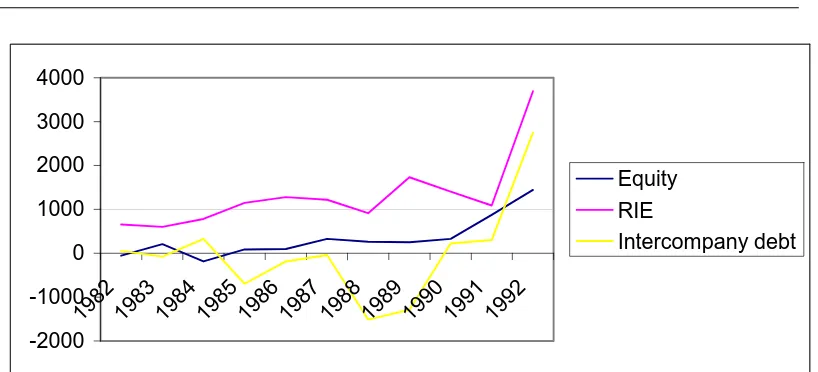
How serious an underestimate might this have been? All the data sources available to us suggest that it would have been substantial.8 Figure 4 graphs the three components of FDI inflows in the
31
8
US data on Ireland. Table 2 shows that that reinvested earnings, in this series, comprised an average of 80 percent of US FDI inflows to Ireland over the period 1982 to 1998.9 A similar pattern is apparent from the IMF series where, in the 1990-1997 period, they accounted for 95 percent of the total. RIE also account for the bulk of FDI inflows in the CSO series from 1998, though a smaller proportion than in the case of the IMF data. We speculate that the latter share may be lower because the CSO series includes substantial IFSC-type flows where RIE may be less important.
Figure 4: Components of US FDI Inflows
-2000 -1000 0 1000 2000 3000 4000
19821983198 4
198 5
198 6
198 7
198 8
198 9
199 0
19911992
Equity RIE
Intercompany debt
Table 1: Reinvested Earnings as share of total FDI Inflows to Ireland
US BEA data, 1982-1998 .8
IMF data, 1990-1997 .95
CSO data, 1998-2003 .55
_________________ _______________________________________
If RIE comprise around 80 percent or more of total FDI inflows as the US and IMF data suggest, then including them from 1990 on should increase measured FDI inflows by a factor of at least 5. We see that the IMF series for 1990, when reinvested earnings were included for the first time, actually increases by a factor of around 7. Ireland, it should be noted, was not alone in not recording RIE until this late stage. The 1992 IMF Report on the Measurement of International Capital Flows (‘the Godeaux report’) indicated that eleven of the industrial countries in its sample
taxed in the United States only when repatriated. Firms with tax-haven profits can therefore earn interest on their residual US tax liability for as long as they defer repatriation of these profits; see e.g. Hines and Rice (1994).
32
9 Prior to 1982, RIE for unincorporated US affiliates were not reported separately and were instead included with other
33
did not compile RIE at that time, though IMF/OECD (1999) reported that six of these had begun to do so by 1997, with further improvements since then; IMF/OECD (2004).10
Given the importance of RIE in FDI flows, this suggests that great care must be taken in using these FDI series for international comparisons. The caveat becomes even more pressing when it is realised that, for many developed countries, including all of the EU15 other than the Netherlands, at least one component of the FDI flow is not available from the IMF for several years over the course of the 1980s and 1990s; UNCTAD (2000, p.269).
The second major break in the IMF series came in 1998. Changes introduced by the CSO at that time saw Ireland now conform to international conventions, so that all FDI reporting institutions adopted the new series emerging from the CSO. These changes will be discussed in the next sub-section. Suffice it to say for the moment that financial service enterprises, particularly enterprises operating from the IFSC, began to be surveyed and the data included in the new series from that time.
The other concurrent change was the introduction of the directional as opposed to the asset/liability presentational method – as recommended by BPM5; CSO (2002) – and, crucially, the fact that gross rather than net directional flows now began to be reported. The asset/liability approach records all outward investments as assets and inward investments as liabilities, whereas the international recommendation is that reverse outward investments (where the direct investment enterprise acquires a financial claim on its direct investor) be netted out of inward investments where the subsidiary owns less than 10% of its direct investor.11 This change would hardly matter in terms of the reported data, as apparently only net flows had been reported up to then, but from 1999 onwards, ‘direct investment flows abroad’ (by Irish investors) were reported separately from ‘direct investment flows into Ireland’ (by foreign investors).12
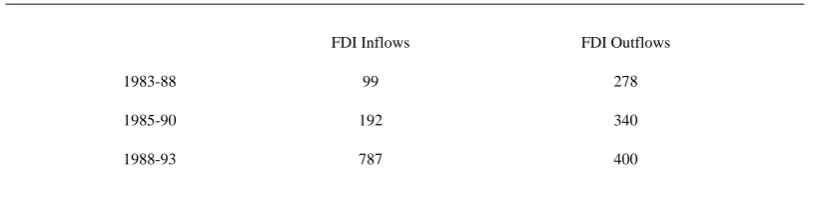
[image:6.595.95.504.482.590.2]An unresolved issue that arises here however in that while the IMF and UNCTAD were publishing these net data on FDI inflows, UNCTAD was also publishing a series on FDI outflows from Ireland. Some details of the two series are given in Table 2, where the inflow data are as in the main IMF/UNCTAD series discussed earlier.
Table 2: Annual average flows; $ millions.
FDI Inflows FDI Outflows
1983-88 99 278
1985-90 192 340
1988-93 787 400
Sources: UNCTAD World Investment Report (1995, 1997, 2000)
10 The difficulty with RIE is that, since no funds cross borders, data must be collected through enterprise surveys rather than
through more traditional balance-of-payments methods. Lack of RIE data may be more significant for some countries than for others. RIE are likely to be higher where FDI has been established for a number of years since the DI enterprise will have acquired the capacity to generate its own funds for reinvestment.
11 Reverse equity investments are generally relatively small but substantial flows and positions can take place under the
‘direct investment –other capital’ category; CSO (2003).
12 We have been informed that only net figures had been released up to this time because the gross flow data was felt to
34
It would be surprising if there were a net outflow of FDI from Ireland over the 1980s. If the inflow figures are indeed net, then gross inflows can be determined by summing the inflow and outflow data to yield the results in Table 3.
Table 3: A Possible Measure of Gross Relative to Net FDI Inflows suggested by the UNCTAD series.
Gross Inflow relative to Net Inflow (?)
1983-88 3.81
1985-90 2.77
1988-93 1.51
By way of benchmarking, we can compare these values to the measures of gross relative to net inflows yielded by the new CSO data series for the early years of the new millennium; Table 4.
Table 4: Gross and Net FDI Inflows
Gross relative to Net FDI Inflows Gross relative to Net FDI Inflows for non-IFSC-type investments
2001 1.73 4.27
2002 1.41 1.25
2003 1.15 1.1
Source: Balance of International Payments, September 2003 and 2004.
Main Features of the IMF/UNCTAD FDI Inflow Series
Reinvested earnings (RIE) only included from 1990. Earlier FDI inflows likely to have been substantially underestimated.
FDI components other than RIE reported only on a net basis up to 1998. Gross inflows could have been substantially higher.
Flows to financial services enterprises included from 1998, resulting in a large jump in the series.
2.2 CSO Series
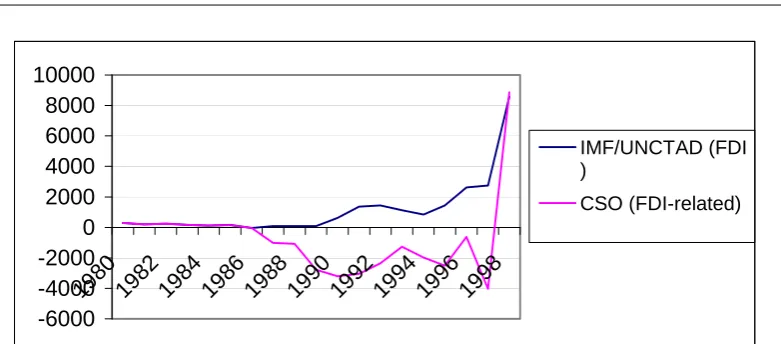
[image:8.595.105.496.276.448.2]The CSO published an FDI series up to 1987 which it then provided to the IMF and UNCTAD. In 1987, however, the CSO began to combine direct investment liabilities with ‘other private capital’, two items which had previously been reported separately. Thus, data for the period 1987-1997 include ‘external portfolio investment by Irish residents including that portion financed by domestic foreign currency borrowing; changes in deposits of non-bank resident at certain banks abroad; and any other private capital items not included elsewhere’; CSO (1993). The inclusion of ‘other private capital’ – an item on which, according to the Statistical Abstracts of Ireland, there had been an outflow in 1972 and in every year from 1975 to 1986 – turned the net figures sharply negative and, by adding portfolio to FDI flows, meant that the CSO abandoned any effort at reporting an FDI series for the period 1987 to 1998. This series is graphed against the IMF/UNCTAD FDI series in Figure 5.
Figure 5: CSO (FDI-related) series graphed against IMF/UNCTAD
-6000 -4000 -2000 0 2000 4000 6000 8000 10000
1980 1982 198 4
198 6
198 8
1990 1992 1994 1996 1998
IMF/UNCTAD (FDI )
CSO (FDI-related)
The FDI series until 1987 had been calculated via a combination of survey and exchange-control data. The progressive dismantling of exchange controls meant that this data source was drying up, while the quality of response to the surveys was generating growing concerns as to the overall quality of the data.13
Be that as it may, the CSO nevertheless continued to provide the relevant FDI data to the IMF. For example, though only beginning to publish a reinvested earnings series in the Balance of Payments in 1995, it reported RIE data to the IMF from 1990 onwards; CSO (1997). It also unbundled Direct Investment from ‘other private capital’ in its reporting to the IMF, allowing the IMF to continue to publish an FDI series for Ireland.14
From 1998/1999 the CSO began to publish a new FDI series that embraced financial as well as non-financial FDI sectors. Manufacturing and non-financial service enterprises had been reporting their BOP transactions to the CSO for a number of years, on a sample selection basis. In
13 Most EU countries (other than the UK and Ireland) used bank settlement data to estimate FDI flows. After some
discussion within the CSO it was decided not to implement this approach. In recent years a number of other EU countries have switched from the bank settlement to the survey method, which Ireland had continued to practice.
35
14
36
1998 however a number of new quarterly surveys were introduced which covered banking, insurance, asset financing, treasury, institutional investment, activities of mutual funds, unit trusts and similar collective investment operations, broking and other service provision. Information collected for all types of enterprises covered transactions with non-residents concerning purchases and sales of services, income flows and acquisitions and disposals of foreign assets or liabilities; CSO (2002).
The new CSO series breaks inflows down into IFSC and non-IFSC types. Non-IFSC inflows are traditional; industrial-type investments whereas, according to Forfás (2002), IFSC-type flows are of quite a different nature, entailing “large movements of capital by parent companies to their treasury, fund management and other IFSC financial subsidiaries, mostly to be reinvested in overseas assets. In this sense, such flows of direct investment into IFSC companies are roughly matched by outward flows of portfolio investment, and have little impact on the real domestic economy”.15
It is however the total of IFSC and non-IFSC flows that the CSO and the international agencies report as their measure of FDI inflows since 1998.
Main Differences between the CSO and IMF Series
From 1987, Direct Investment liabilities were combined with ‘other private capital’ – including substantial portfolio outflows – so no pure FDI series was published by the CSO between 1987 and 1998.
From 1998 the new CSO series yields data on FDI in financial as well as non-financial sectors. This led to a sharp increase in recorded FDI inflows. While the CSO distinguishes between IFSC-type and non-IFSC-type FDI inflows (with the latter bearing a stronger relationship to the earlier IMF/UNCTAD series), the international organisations now publish the sum of the two series as their measure of inward FDI.
2.3 The OECD2 Series
As mentioned earlier, the OECD2 series starts off higher than the IMF series but crosses over in 1990, eventually becoming substantially lower. Unlike most of the other series, this one for the years 1983-1998 is based on data provided by the IDA rather than the CSO.16
These IDA data refer to “approved investments” eligible for IDA grant aid. Since grant levels were related more to the level of anticipated employment than to the anticipated level of investment, these “approved investment” values may well have been far removed from the actual
15
Fund management flows (as is appropriate) are not counted as FDI by the CSO. Flows in support of foreign-owned banks, insurance and investment companies are included as FDI, however, and these generate jobs and physical investment in Ireland, just as is the case with manufacturing-sector FDI. UNCTAD (2004, p. 104) concurs with Forfás however that these flows generate less output and employment: “A good deal of services FDI – notably that in holdings and financial affiliates – involves activities with little value added, employment, sales or investment expenditure on fixed capital”. Forfás reports that most FDI inflows into Ireland from other euro-zone countries went into companies associated with the IFSC. 16 Many of the numbers reported in this series are obtained from totals in the sectoral and geographical breakdown tables
37
level of expenditure invested. It should also be borne in mind that the data refer only to sectors which were grant-aided by the IDA.17 Furthermore, since aid was directed almost exclusively towards greenfield projects, reinvested earnings would not typically have been included in approved investment levels. Finally, it is important to note that the source of funds for these “approved investments” would not have been taken into account; funds raised on European capital markets would have been included in exactly the same way as equity participation. Thus the OECD/IDA series is not a measure of FDI per se.
Why, though, did OECD 2 start off above the IMF series, crossing over in 1990 and eventually falling substantially below it, before the new FDI series produced by the CSO was eventually adopted in the late 1990s?
The IDA figures would have been akin to gross foreign-company greenfield investments while the IMF figures until 1998, as we have seen, are net (with indigenous and foreign-company FDI outflows netted out of foreign-company inflows). This would at least partly explain why the OECD series is above the IMF one until 1990. If the only difference between the IMF and OECD2 (IDA) series for this period were that the former measured net inflows (exclusive of RIE) and the latter measured gross inflows, also exclusive of RIE, than the implied level of FDI outflows to inflows over the period 1983-1989 would have been 2.45, which bears comparison with the results presented earlier. (It needs to be borne in mind however that the IDA series is not a pure FDI series).
From 1990, reinvested earnings are included in the IMF series, which bumps it up dramatically, apparently by a factor of between 5 and 7. It is not surprising, accordingly, that the IMF series dominates from then on, and indeed – in the period 1990 to 1997 inclusive, before IFSC inflows were included – it dominates by an order of magnitude of around 4.
One further point of interest is that, according to the OECD/IDA series, inflows from the US comprised an average of 59 percent of total FDI inflows recorded. This is consistent with the US-firm share of foreign-sector manufacturing employment, which in 1998 stood at 57.3 percent according to the Census of Industrial Production.
Main Features of the OECD2 Inflow Series
Uses data on inward investments eligible for grant aid (provided by IDA rather than CSO). Thus it is not a pure FDI series.
Consistent with the fact that FDI outflows are not netted out in this series as they are in the IMF, inflows exceed those reported by the IMF up to 1990,
From 1990, reinvested earnings included in the IMF series while continuing to be excluded from the OECD2 series, so the former comes to exceed the latter.
Inflows from the US average just fewer than 60 percent of total FDI flows according to this OECD source, which is consistent with the US-firm share of foreign-sector manufacturing employment.
17 Thus most services sectors would have been excluded, as would SFADCo area companies. Working capital and
38
2.4 The Eurostat Series
Eurostat provide two data series. Eurostat 1 runs from the early 1980s to the early 1990s and excludes RIE while Eurostat 2 yields data for the years 1992 to 1994 and includes RIE.18 Eurostat 1 yields generally higher numbers than the IMF series while Eurostat 2 yields substantially higher numbers.
[image:11.595.94.501.344.434.2]Although Eurostat’s European Union Direct Investment Yearbooks assert that the data are as reported by the CSO, at least some appears to have been estimated. How might they have been calculated? According to Eurostat (1997), IDA data supplied by the CSO were used to identify foreign countries which had a strong direct investment relationship with Ireland, and Eurostat estimates used for sectoral and geographical breakdowns are then “based on the information available on member state partner countries (plus the USA), combined with a structure of weights based on three declaring countries: the United Kingdom, the Netherlands, and Denmark”; Eurostat (1984-93, p.201) and Eurostat (1996, p.289). RIE, furthermore, are apparently based on a joint Eurostat/OECD questionnaire and are higher than the CSO estimates as reported by the IMF, as Table 5 illustrates.
Table 5: IMF and Eurostat Estimates of Reinvested Earnings, $m.
IMF Eurostat
1992 1336 2248
1993 1024 1600
1994 844 2055
Eurostat produced no FDI data for Ireland for the years 1995-1998, and neither the 1998 or 2000 yearbooks include tables for Ireland or Greece, though data appear to have been estimated to generate overall EU totals. Finally, Eurostat (1995) warns that its figures (for all countries) “should be treated with great caution”.
As will be seen in the section on the sectoral allocation of FDI inflows below, the Eurostat estimates include very high values for Financial Intermediation flows while the other data sources largely ignored this sector until 1998. This, we believe, is the main reason why the Eurostat estimates generally come in higher than others for the period up to 1998.
Main Features of the Eurostat Inflow Series Calculated independently of the CSO until 1998.
RIE also calculated independently.
Series includes estimates for Financial Intermediation flows before the CSO began to survey this sector in 1998. This appears to account for why the values reported are so much higher than those yielded by any of the other data sources.
18
39
.2.5 The BEA Series on US FDI Inflows
The main source of data for US FDI stocks and flows into Ireland is the Survey of Current Business (SCB) series compiled by the US Bureau of Economic Analysis (BEA). Country breakdowns of US FDI flows and investment positions are available from 1966.
The BEA uses two types of survey to compile these data. The ‘benchmark surveys’, undertaken every five years, are census surveys covering ‘every US person having a foreign affiliate’ (BEA 1994), though smaller enterprises are exempted from reporting requirements, with the exemption limits having been changed a number of times. These surveys collect BOP and Direct Investment Position (DIP) data, on the one hand, - the type of data we are examining here – and also financial and operating (or activity) data. Smaller sample surveys are undertaken quarterly for the BOP and DIP estimates, and annually for the financial and operating data.
Several changes to the treatment of various items have taken place over the years, though it is not clear what the implications of these might have been for the data on Ireland. One change introduced in 1977 was the rigorous implementation of the rule whereby the direct investor had to have an interest of at least 10% in the company for an investment to be classified as FDI. Prior to 1977, interests of less than 10 percent were also included (i) when another US person held an interest of at least 10% in the same foreign business enterprise, or (ii) when the combined interest of all US persons was at least 50% even if no single person had an interest of at least 10 percent.19 Another change was that, from June 1990, capital gains and losses associated with currency translation adjustments were removed from the reinvested earnings component and reclassified as valuation adjustments to the Direct Investment Position. Revisions were made back to 1982 (SCB August 1990) and considerably changed the recorded level of aggregate flows. There is no apparent break in the Irish data to reflect this however.
In 1998, intercompany debt transactions and associated interest transactions between parents and affiliates that are financial intermediaries (as opposed to depository institutions) were reclassified from direct to portfolio investment to be consistent with the guidelines in BPM5, though equity capital transactions with these intermediaries have continued to be classified as DI. The data were then revised back as far as 1994.20 Lipsey (2003) suggests that the effect of this change was to reduce net outflows substantially and to reduce volatility. This may have led to a break in the Irish series, though again none is readily apparent.
Comparing the US BEA series to IMF/UNCTAD we see that the US series was consistently higher, and generally substantially so, until 1990, from which time it has almost invariably been lower, and has been consistently lower since 1998. The outcome for the period to 1990 is consistent with two facts: (i) the US series included RIE while the IMF series did not, and (ii) the IMF series netted out outward FDI from indigenous and other firms, while the US series netted out only US firms.
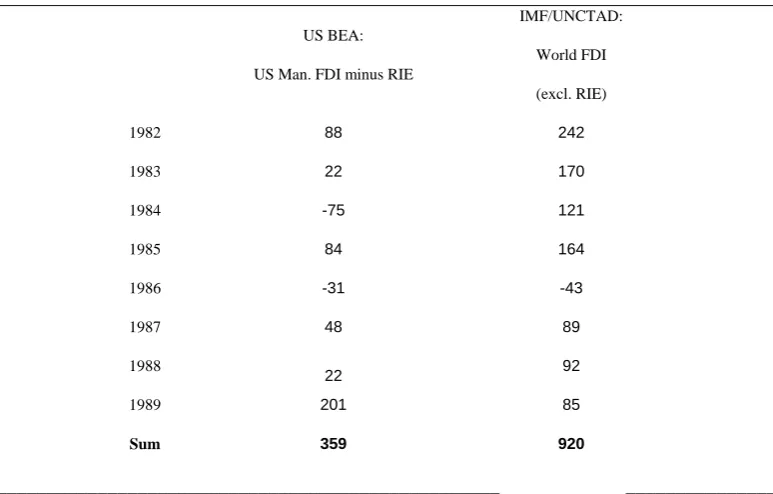
It must also be borne in mind that the US data included FDI in financial concerns which the IMF data would have largely excluded. To take account of the first and last point, we subtract manufacturing RIE from the US total manufacturing FDI inflow figures to see whether these are more closely related to the IMF figures up to 1990.21 This indeed, as seen in Table 6 and Figure 6, proves to be the case
19 Data prior to 1977 was not revised to reflect this change; Lipsey (2003). 20 It is the revised data that are reported here.
21
Table 6 US Total Manufacturing FDI inflows Excluding RIE
US BEA:
US Man. FDI minus RIE
IMF/UNCTAD:
World FDI
(excl. RIE)
1982 88 242
1983 22 170
1984 -75 121
1985 84 164
1986 -31 -43
1987 48 89
1988
22 92
1989 201 85
Sum 359 920
[image:13.595.100.495.157.574.2]___________________________________________________ _______________ Figure 6 US Total Manufacturing FDI inflows Excluding RIE
-200 0 200 400 600 800 1000
1982 1983 1984 1985 1986 1987 1988 1989
US Manuf FDI (excl RIE)
IMF/UNCTAD FDI
US FDI
Between 1990, when the IMF series began to include RIE and 1998 when it took IFSC-type flows into account, the US series excluding values for banking, finance, insurance and real estate, averaged 59 percent of the IMF series, while the US-firm share of foreign-sector manufacturing employment (in 1998) stood at 57.3 percent! The equivalent US series (in this case excluding banking, finance and insurance), between 1999 and 2002, comprised an average of 44 percent of the CSO non-IFSC series over this period.22
40
22
41
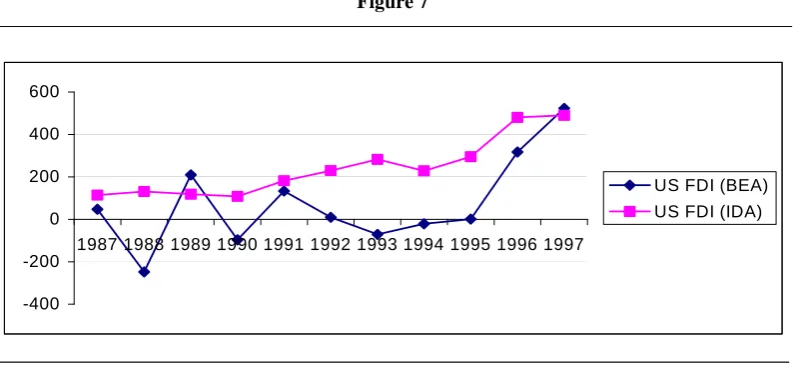
[image:14.595.113.498.199.413.2]While these last sets of figures may seem broadly compatible, we still need to try to work out the relationship between the OECD (IDA) data on US investments in Ireland and those reported by the US BEA. As the IDA data excludes RIE, we need to exclude these from the BEA data also. Secondly, we need to exclude financial-sector FDI from the BEA data (and presumably some other sectors such as petroleum and wholesale that would not have been grant-aided by the IDA). These series are detailed in Table 7 and the series graphed against each other in Figure 7.
Table 7 Total US FDI less RIE
US FDI less RIE in sectors other than Banking,
Finance, Petrol and Wholesale (BEA)
US FDI (OECD, IDA)
1987 48 114
1988 -248 131
1989 210 118
1990 -96 108
1991 133 182
1992 9 230
1993 -71 283
1994 -21 229
1995 1 295
1996 317 480
1997 523 490
Totals 805 2660
[image:14.595.101.498.495.679.2]The gap between the two series remains quite substantial, with the BEA series lower and substantially more volatile. As mentioned earlier, Griffith (1999, p.16) plotted broadly equivalent data series on US FDI and US MNC investment in the transport equipment industry in the UK. Figure 8 below replicates her data. In both cases, the FDI series is generally well below the foreign-firm investment series and is substantially more volatile.
Figure 7
-400 -200 0 200 400 600
1987 1988 1989 1990 1991 1992 1993 1994 1995 1996 1997
US FDI (BEA) US FDI (IDA)
Figure 8:
-1000
-500
0
500
1000
19
80
19
84
19
88
19
92
Capital
expenditure
(£m)
FDI (£m)
Source: Griffith (1999)
Main Features of the BEA US Inflow Series
US series was consistently higher than IMF until 1990. This is consistent with the fact that the US series included RIE and financial-sector flows over this period while the IMF series excluded them.
US manufacturing FDI excluding RIE over this period came to between one-third and one-half of the IMF series, which is broadly consistent with the employment data.
Between 1990, when the IMF series began to include RIE and 1998 when it took IFSC-type flows into account, the US series excluding values for banking, finance, insurance and real estate, but including RIE, averaged 59 percent of the IMF series, while the US-firm share of foreign-sector manufacturing employment stood at a level very close to this. The equivalent US series, between 1999 and 2002, comprised an average of 44 percent of the CSO non-IFSC series over this period.
The US FDI series was lower and more volatile than the OECD/IDA US MNC investment series. Equivalent findings have been reported for the UK.
3. DATA SERIES ON SECTORAL DISTRIBUTION OF FDI INFLOWS
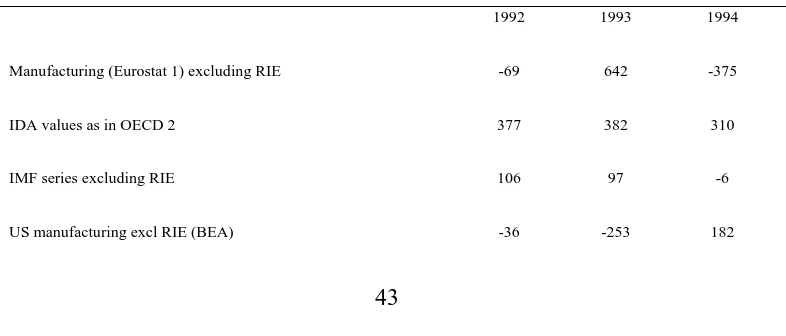
Three of the international data sources provide information on the sectoral allocation of FDI inflows: Eurostat 1, OECD 2 and the US BEA. Details of the sectoral breakdown in Eurostat 1 – which excludes RIE – are provided in Table 8.
43
Table 8: Sectoral breakdown of Eurostat 1; US$ m
1992 1993 1994
Agriculture & Fishing 0 1 5
Mining & Quarrying 0 -7 -328
Manufacturing -69 642 -375
Electricity, gas, water 32 704 -24
Construction 0 43 29
Trade & repairs -195 260 131
Hotels & Restaurants 0 0 -48
Transport&Communications 32 35 30
Incl Land, sea, air transport
Financial Intermediation and Insurance 1550 1207 2199
Real estate & business activity 1449 242 387
Other services -3 0 -5
Not allocated 38 -18 -125
Total 2830 3109 1878
Source: European Union Direct Investment Yearbook 1996 Notes: minus sign indicates disinvestments.
The main point to be made about this table is the small weight that manufacturing receives, and the extent of the fluctuations in manufacturing-sector FDI. These values fluctuate -$375 million and $642 million in the Eurostat1 data. The fluctuations are far less dramatic in any of the other data series we have on manufacturing, as shown in Table 9. Thus we concur with Eurostat’s (1995) warning that their figures “should be treated with great caution”.
Table 9: Manufacturing Sector FDI, various sources
1992 1993 1994
Manufacturing (Eurostat 1) excluding RIE -69 642 -375
IDA values as in OECD 2 377 382 310
IMF series excluding RIE 106 97 -6
[image:16.595.104.497.559.727.2]44
Another source yielding an estimate of the sectoral allocation of FDI inflows is OECD 2, which reports on data provided by the IDA. Unlike the Eurostat source, virtually all of the OECD numbers relate to manufacturing. A selection of these data are reported in Table 10.
Table 10: Sectoral Allocation of FDI inflows
US$m 1986 1988 1990 1992 1994 1996 1998
Manufacturing of which 234 245 200 364 304 547 548
Food products 63 38 17 31 45 43 53
Textiles and wood products 16 41 25 12 52 91 57
Petroleum, chemicals, rubber& plastic products
44 81 26 66 52 50 43
Metal and mechanical products 112 78 122 240 139 363 396
Other services 3 14 7 12 6 19 34
Unallocated 10 9
Total 250 257 207 376 310 576 591
Sources: OECD International DI Statistics yearbooks 1998 and 1999
[image:17.595.101.500.159.378.2]This sectoral distribution of FDI inflows is quite consistent with the sectoral distribution of foreign-sector jobs, as shown in Table 11.
Table 11: Sectoral Distribution of FDI inflows and Foreign Sector Employment
Allocation of FDI inflows, 1986-1998 (%)
Allocation of employment in foreign-owned industry, 1998
Food products 12 11
Textiles and wood products 10 12
Petroleum, chemicals, rubber& plastic products
18 20
Metal and mechanical products 60 57
Source: Employment from Census of Industrial Production (1998)
45
There have been name changes for several sectors over the years, none of which are thought to have had significant effects on the values reported, particularly for manufacturing to which we confine out attention here.23 The sectoral classifications have also changed a number of times over the years, particularly with the shift from SIC to NAICS (the 1997 North American Industrial Classification System), the industry classification system currently used by the US, Canada and Mexico and the system under which the capital outflows for the years 1999-2002 are reported.
[image:18.595.101.500.244.422.2]Comparing sectoral FDI inflows over the period 1994-2000 with the fairly stable sectoral shares of employment in US-owned firms, we see that three sectors dominate both series: Chemicals, Electronics and a category of diverse ‘other’ manufacturing sectors.
Table 12: Sectoral Distribution of FDI and US Employment Shares
Food and
kindred products
Chemicals & allied products
primary & fabricated metals
Industrial machinery metals
Electronic & other electric equip
Transport equip
Other man
Share of FDI,
1994-2000 4.14 35.94 1.45 13.62 20.95 0.07 23.78
Share of employment in
US-owned firms,
1998
3.76 16.83 3.91 4.15 51.47 1.26 18.63
Source: Employment data from Census of Industrial Production (1998)
Chemicals, however, appears to be strongly overrepresented in the FDI inflow data, with ‘other manufacturing’ slightly overrepresented and electronics substantially underrepresented. This pattern is at least consistent with the relative capital intensity of these sectors. According to Midelfart et al. (2000), the chemicals sector has a high capital-labour ratio, electronics a low one while the high-foreign-employment sectors in ‘other manufacturing’ (which are textiles and paper, printing and publishing) have medium-to-high capital-labour ratios. While this explanation appears attractive however, the pattern is nevertheless inconsistent with the findings reported earlier for the FDI-employment ratios in the OECD2/IDA data.
23 Several changes in manufacturing sector names were made to conform to the nomenclature used in the 1987 Standard
46
Findings on the Sectoral Allocation of FDI
- The sectoral allocation data in the Eurostat database are dominated by Financial Services, while fluctuations in manufacturing FDI inflows are very large compared to the other data sources.
- The allocation across manufacturing sectors in the OECD/IDA data is consistent with the employment allocation across these sectors.
- The allocation across manufacturing sectors in the US BEA data is fairly consistent with the sectoral employment allocation.
4. DATA SERIES ON FDI STOCKS
FDI stocks, or ‘Direct Investment Positions’, measure the value of accumulated flows of FDI. Depending on the valuation methods used, adjustments may occur from year to year not just because of flows but also because of revaluations reflecting changes in exchange rates and prices, as well as reclassifications and corrections.24
UNCTAD presents data on Ireland’s FDI stock at 5-yearly intervals for the 1980s and annually from 1992. Huge changes were made to the historic values in UNCTAD (2003) and beyond. The CSO first published International Investment Position (IIP) data in October 2003 with a series beginning in 1998 and plans to continue to publish these data on an annual basis. As with the flow data, direct investment is broken down into equity capital, reinvested earnings and ‘other capital’ components, and an IFSC/Non-IFSC activity breakdown is also included. (These series are contained in Appendix Table 3).
There is an apparent break in the UNCTAD 1 series in 1995 and a clear one in 2000. We can find no explanation for the surge in the 1995 value, since all the flow data sources show only moderate inflows in 1994. It is clear however that from the year 2000 UNCTAD has adopted CSO figures which include stocks in IFSC activities. In the several years preceding that, UNCTAD values are reasonably close to those reported by the CSO for non-IFSC activities.
UNCTAD (2003) revised its earlier figures very dramatically, raising its estimate of the 1980 stock, for example, by a factor of almost 10. It states that the new estimates of stocks prior to 1999 are generated by subtracting earlier flows from this higher stock value. This seems to us to yield a very misleading picture however, since the new 1999 stock figure adopted from the CSO includes IFSC-type stocks. In recalculating past stocks, UNCTAD has subtracted flows that did not include much IFSC-type FDI from stock values that do, implicitly holding the IFSC stock at its 1999 value and projecting that back into the past, leading to a massive overestimate of historical stocks. Accordingly we use the UNCTAD1 rather than UNCTAD2 series as our benchmark in the discussion below.
Appendix Table 3 also gives estimates of the net accumulated stock of capital that US parents have provided to their foreign affiliates. The direct investment position is the book value of US direct investors’ equity in, and net outstanding loans to, their foreign affiliates; SCB (June 1990).
24 See Lipsey (2003) on the various valuation methods used. The CSO position is that stocks should be evaluated on a
47
Stocks are measured at historical cost as this is the basis used for valuation in company accounting records in the US and so is the only basis on which companies can report data in the direct investment surveys; USDIA 1994 Benchmark Survey, Final Results.25
The table also gives a series for the US FDI stock in manufacturing and services, excluding wholesale, finance and real estate. This is probably close to what is normally though of as US FDI in Ireland (in that it includes software and IT-enabled services for example). This series started out dominated by manufacturing FDI but from the late 1990s has consisted of equal parts manufacturing and services.
These numbers come in at around 50 percent of the UNCTAD1 values for the total FDI stock in Ireland up to the year 2000, at which time UNCTAD started to include values for the IFSC. From that time on, the US numbers have come in at a somewhat lower proportion of the CSO numbers for the stock of non-IFSC FDI. These findings are reasonably consistent with the employment breakdown between US and other foreign-owned firms. In its December 2003 FDI issue, the CSO published a geographical breakdown of DI positions, which Table 13 below compares with the DIP reported by the US.26 These sets of numbers also turn out to be reasonably close.
Table 13: Comparison of the CSO and US BEA Direct Investment Positions (including IFSC-type)
US DI Position in Ireland
CSO BEA
Total US$m US$m
2001 28424 34499
2002 35327 41636
2003 55463
Sources: SCB Sept 2003; BEA website; CSO (2003) International Investment Position (IIP) December 2002
5. CORRELATIONS BETWEEN FDI STOCKS AND EMPLOYMENT SERIES
We now wish to explore the relationship, if any, between these various FDI stocks series and employment levels in foreign-owned manufacturing firms. These employment data, as compiled by Forfás, are presented in Appendix Table 4.
We first take the (pre-revision) UNCTAD1 series with data points at 1980, 1985, 1990 and 1992-1999, to which we add the CSO non-IFSC figure for 2000. This yields a correlation coefficient of 0.8979 when compared with the foreign-MNC employment series.27
25 Historical costing is widely considered to underestimate the value of investment stocks because it values the asset at its
purchase price and so ignores inflation. As a result BEA, since 1991, also uses current-cost and market-value estimates of the overall Direct Investment Position. However country detail continues to be available only on a historical-cost basis. 26 The CSO issue gives breakdowns between equity capital and reinvested earnings (as an aggregate) and ‘other capital’
but, as the US does not provide these breakdowns, they have not been reported here. 27
48
We next look at the US Direct Investment Position data, which we take from 1973 to 2000, and run it against the Forfás series on employment in US-owned firms. This yields an even higher correlation coefficient of 0.8997.
Note however that the DI Position includes data on US FDI in financial and other services while the Forfás series contains data only on manufacturing employment. Accordingly we isolate the DI position in manufacturing alone, which yields an extremely high correlation coefficient of 0.9653.
Lipsey (2001) reports on a similar examination of the relation between US outward-FDI stock data and measures of US MNC activity across sectors and across locations. He finds that the FDI stocks are quite closely related across countries to absolute changes in affiliate property, plant and equipment (PP&E) and affiliate sales, but much less closely related to affiliate employment. The relationships fall apart completely however when sectoral allocations are examined.
UNCTAD (2001; Annex D) also examines the relationship between FDI stock and MNC activity data for the US BEA data. This study shows a positive correlation between the US outward FDI position and employment abroad by US affiliates. For 1989 the correlation coefficient was 0.882, and for manufacturing alone 0.885. Changes in the outward FDI position and changes in employment (from 1966 to 1989) are much less strongly correlated. UNCTAD finds a correlation coefficient of 0.466 for all industries and 0.407 for manufacturing.
[image:21.595.95.502.448.575.2]Our next and final step is to examine the correlations between the BEA FDI stock and Forfás employment data at the sectoral level.28 These data are presented in Table 14. The correlations are rather mixed, ranging from 0.09 for Industrial Machinery to 0.89 for Chemicals. It is heartening that the correlations are particularly high in the cases of the two sectors that however for the bulk of US-firm employment: Chemicals and related industries (which account for 19 percent in 2000) and Electronics (which account for 60 percent).
Table 14: Correlations between FDI stock and MNC employment data, by sector; 1979-2000.
Food and kindred products
Chemicals & allied products
Primary & fabricated metals
Industrial machinery metals
Electronic & other electric
equip
Transport equip
Other manuf
0.23 0.89 0.18 0.09 0.72 0.39 0.30
Source: Employment data from Forfás.
overlapping data) is higher than when this series is replaced by the revised UNCTAD values.
28 The Forfás employment database differs somewhat from the Census of Industrial Production. Forfás reports the following
49
Analysis of the FDI stocks series
- We believe UNCTAD committed a serious error in its 2003 revisions to the historical stock series by subtracting flows that did not include much IFSC-type FDI from stock values that did, leading to a massive overestimate of historical stocks.
- The US FDI stock in manufacturing and services (from the BEA) comes in at around 50 percent of the unrevised UNCTAD1 stock values, which increases our faith in the unrevised UNCTAD figures. These unrevised figures are highly correlated, furthermore, with the foreign-MNC employment data, while the correlation is even higher between the US manufacturing FDI stock and the Forfás data series on employment in US-owned manufacturing firms.
- The correlations between the BEA FDI stock and Forfás employment data at the sectoral level are more mixed, but are particularly high in the cases of the two sectors that for the bulk of US-firm employment: Chemicals and Electronics.
6. CONCLUSIONS
Caveat emptor is the main message to emerge from the present analysis. Use of any of these FDI series for international comparisons (other than those coming from the US BEA) comes with many health warnings. Data for one or other of the three components of FDI was missing for fourteen of the EU15 countries for at least several years in the 1980s and 1990s.
The IMF series on Ireland did not included reinvested earnings until 1990, and we have seen that these generally comprise the bulk of FDI inflows. This largely explains the seven-fold jump in recorded FDI inflows to Ireland in 1990.
The CSO stopped publishing a pure FDI series in 1987 and resumed again only in 1998. The new series includes FDI inflows to financial services, heretofore largely excluded. As this is the series now reported by the international organisations (IMF, UNCTAD etc.) the apparent very sharp increase in FDI inflows when the new data source is introduced is misleading. The new CSO series on non-IFSC-type FDI inflows alone bears a stronger relationship to the earlier IMF/UNCTAD series than does the new total FDI series.
The OECD in one of its FDI series uses IDA data on inward investments eligible for grant aid. Thus it is not a pure FDI series. Up to 1990, inflows exceed those reported by the IMF, which is consistent with the fact that the OECD series is a measure akin to gross MNC investment while the IMF series measures net FDI inflows. From 1990, when reinvested earnings are included in the IMF series (while remaining excluded from the OECD2 series), the former comes to exceed the latter. According to the OECD source, inflows from the US average just under 60 percent of total MNC investments, which is consistent with the US-firm share of foreign-sector manufacturing employment.
The Eurostat Inflow series is calculated independently of the CSO (until 1998) and, unlike any of the other (non-US) series, includes estimates for financial intermediation flows. This appears to account for why the values reported are so much higher than those yielded by any of the other data sources.
50
total FDI inflows until 1990. This is consistent however with the fact that the US series included RIE and financial-sector flows over this period while the IMF series excluded them. Concentrating on manufacturing and taking account of RIE the relationship between the BEA and IMF series (and the CSO non-IFSC series since 1998) is broadly consistent with the employment data. The US FDI series was lower and more volatile than the US MNC investment series provided by the IDA, furthermore, which is consistent with findings for the UK.
Turning our attention now to the data sources yielding information on sectoral allocation of FDI inflows, the results of the Eurostat database arouse suspicion. Flows are dominated by the financial services sector, on which there appears to have been little survey evidence at that time, while the fluctuations in manufacturing FDI inflows are very large in comparison with the other data sources. By contrast, the FDI allocation across manufacturing sectors in both the OECD/IDA data and the data on US FDI from the BEA is fairly consistent with the allocation of employment across these sectors.
The final set of data we explore concern values for the FDI stock in Ireland. UNCTAD provided a historical series of such values but revised these dramatically in World Investment Report (2003). The estimate of the 1980 stock, for example, was raised almost tenfold. We believe a serious error was made in these revisions. In recalculating past stocks, UNCTAD subtracted flows that did not include much IFSC-type FDI from stock values that did, which would have resulted in a massive overestimate of historical stocks.
The US FDI stock in manufacturing and services, from the BEA, comes in at around 50 percent of the UNCTAD1 values for the total FDI stock in Ireland up to the year 1999, which increases our faith in the unrevised UNCTAD figures. These unrevised figures are highly correlated, furthermore, with the foreign-MNC employment data, while the correlation is even higher between the US manufacturing FDI stock and the Forfás data series on employment in US-owned manufacturing firms.
7. RECOMMENDATIONS
The decision of the CSO to provide data series that distinguish between IFSC-type and non-IFSC-type FDI is to be lauded. It only remains for us to suggest some other data series that we would like to see provided. Most econometric treatments of FDI-related issues in Ireland use the Forfás manufacturing employment series that distinguishes between foreign and indigenous industry back to 1973 rather than the much shorter one provided by the CSO (in the Census of Industrial Production). It would be very valuable if the CIP were able to be backdated further in distinguishing between indigenous and foreign industry. Forfás also collects other data of immense interest, relating to R&D expenditures for example. Again, these data would be more valuable for analytical purposes could they be combined with CIP-type data.
51
ReferencesBureau of Economic Analysis (various years) Survey of Current Business. BEA (1994)USDIA 1994 Benchmark Survey Final Results.
CSO (various years)Statistical Abstracts of Ireland. CSO (various years)Statistical Bulletin.
CSO (2002b)Statistical Release on International Investment Position.
CSO (2003)Foreign Direct Investment 2001 and 2002, December 2003.
Desai, M.A., Foley, C. F. and J. Hines (2002)Chains of ownership, regional tax competition and foreign direct investment. NBER Working Paper No. 9224.
ECB (2002)European Union Balance of Payments/International Investment Position Statistical Methods, November 2002.
Eurostat (various years)European Union Direct Investment Yearbook. Forfás (2001)International Trade and Investment Report 2000.
Forfás (2002) Half-Year Trade and Investment Brief, June 2002.
Griffith, R. (1999) “Productivity and Foreign Ownership in the UK Car Industry”, Institute for Fiscal Studies Working Paper Series No. W99/11, available at: http://www.ifs.org.uk/staff/rachel_g.shtml.
Grubert, H., and J. Mutti (1991) “Financial Flows versus Capital Spending: Alternative Measures of US-Canadian Investment and Trade in the Analysis of Taxes”, in P. Hooper and J. D. Richardson (eds.) International Economic Transactions: Issues in Measurement and Empirical Research, Chicago: University of Chicago Press, 293-317.
Hines, J.R. and E.M. Rice (1994) “Fiscal paradise: foreign tax havens and American business”. Quarterly Journal of Economics, (109:1), pp. 149-82.
IMF (1989, 2000, 2002) Balance of Payments Statistics yearbooks.
IMF (1992) ‘Report on the Measurement of International Capital Flows’ (the ‘Godeaux Report’). IMF (1993)Balance of Payments Manual 5th ed.
IMF/OECD (1999) Report on the Survey of Implementation of Methodological Standards for Direct Investment.
IMF/OECD (2004) Foreign Direct Investment Statistics: How Countries Measure FDI, 2001 edition.
52
Concepts, History and Data”, in E. Kwan Choi and J. Harrigan (ed) Handbook of International Trade, Blackwell. Also available as NBER WP 8665.
OECD (1992)International Direct Investment: Policies and Trends in the 1980s.
OECD (1996)Benchmark Definition of Foreign Direct Investment 3rd ed.
OECD (2001)Science, technology and industry scoreboard, OECD, Paris, France. OECD (various years)International Direct Investment Statistics Yearbook, Paris.
Quijano, A. (1990) “A Guide to BEA Statistics on FDI in the United States”, Survey of Current Business, January.
Ruane, F., and H. Gorg (1996) ‘Aspects of Foreign Direct Investment in Irish Manufacturing since 1973: Policy and Performance’, Journal of the Statistical and Social Inquiry Society of Ireland, Vol. XXVII, Part IV.
Stewart, J. (1985) “Aspects of the Financial Behaviour of Multinational Companies in Ireland”, in J. Fitzpatrick and J. Kelly (eds) Perspectives on Irish Industry, Dublin: Irish Management Institute.
UNCTAD (2001) Measures of the Transnationalisation of Economic Activity, Geneva: United Nations.
53
APPENDIXTable A1: FDI Inflows; US$ millions.
IMF/
UNCTAD
CSO29 CSO
(non-IFSC) OECD 2
(IDA)
Eurostat1
(excluding RIE)
Eurostat2
(including RIE)
US FDI
(BEA)
US FDI
(OECD)
1966 21
1967 22
1968 32
1969 39
1970 19
1971 25 25 30
1972 32 32 55
1973 53 53 75
1974 51 51 125
1975 159 159 174
1976 174 174 238
1977 136 136 273
1978 376 376 376
1979 337 337 478
1980 286 287 468
1981 204 205 315
1982 242 242 333
1983 170 167 239 419
1984 121 119 203 87 423
29 The CSO series in the 2nd column does not present itself as a pure measure of FDI since, as outlined in the text, some
54
1985 164 159 197 466 685
1986 -43 -40 250 62 613
1987 89 -1011 322 562 909 114
1988 92 -1082 257 562 659 131
1989 85 -2768 193 1597 793 118
1990 627 -3204 206 4070 926 108
1991 1357 -3047 372 6762 537 182
1992 1442 -2345 377 2830 5078 1191 230
1993 1121 -1264 382 3109 4709 1506 283
1994 838 -1971 310 1878 3933 -337 229
1995 1447 -2509 377 695 295
1996 2618 -624 575 1954 480
1997 2743 -4037 581 2266 490
1998 8579 8866 8856 8877 7891 461
1999 18218 18501 6015 18962 18967 4741
2000 25843 26447 13543 20718 20722 9823
2001 9659 15681 5588 196
2002 24486 24369 15182 4870
2003 25497 25493 20151 9093
Sources: as footnoted.
Business-55
Table A2: Sectoral allocation of US manufacturing FDI flows to Ireland
Year Manuf Total Food and kindred products Chemical s & allied products Primary & fabricate d metals Machinery, except electrical Electric & electronic equip Transport equip Other manuf
1982 279 36 23 6 58 33 2 122
1983 342 66 24 6 122 D -1 D
1984 308 115 19 3 63 58 -1 52
1985 458 77 179 7 86 31 <0.5m 78
1986 484 50 191 11 55 51 <0.5m 126
1987 711 57 197 8 164 140 <0.5m 145
1988 417 35 135 10 148 -2 4 87
1989 436 40 297 25 93 -51 12 19
1990 245 40 77 <0.5m -163 -47 41 297
1991 580 42 359 27 -111 72 -3 194
1992 597 D 377 17 -251 163 D 250
1993 409 D 560 17 175 -80 D 35
1994 833 40 240 25 371 28 <0.5m 128
1995 706 7 331 12 -41 169 -3 231
1996 1269 91 423 12 158 253 -22 353
1997 1698 186 467 19 401 378 6 241
1998 1773 35 663 22 -136 823 9 357
1999 888 17 420 20 241 74 21 94
2000 1569 -14 596 17 196 105 -5 673
2001 1551 102 348 10 213 218 10 648
Year Manuf Food Chemicals Primary
& fabricate d metals Machinery Computer and electronic products Electrical equip, appliances, and component s Transpr t equip
1999 1521 D 719 19 66 556 30 -7
2000 2317 D 581 17 13 945 D D
2001 1265 91 564 -1 -49 -45 D D
2002 2258 97 1129 7 6 745 D 10
2003 2548 47 965 12 3 741 D D
56
Table A3; DI Position (FDI stock) series; $m
UNCT AD1
UNCTA D2
CSO CSO CSO BEA BEA
WIR (2004)
Total Non IFSC
IFSC
US
US FDI stock in manufacturing and
services
(excluding wholesale, finance
and real estate)
1980 3749 31281 2319 1736
1985 4649 32181 3693 2770
1990 5502 33826 5894 3716
1992 5173 7607 4612
1993 5262 9224 4782
1994 5352 7239 4120
1995 11706 40024 7996 5095
1996 14162 10133 6339
1997 17051 11339 7428
1998 25647 59790 17928 41863 21825 13338
1999 43031 77224 32827 44397 25157 14699
2000 118550 136921 125835 73296 52538 35903 18475
2001 138266 136115 74414 61700 35712 20653
2002 157298 167945 160249 90391 69858 41636
2003 193442 194468 112990 81477 55463
Source: World Investment Report (various years);
CSO (2003) International Investment Position (IIP) December 2002 IMF Balance of Payments Statistics Yearbook 2003
57
Table A4: Forfás Employment Data.
Total employment in foreign-owned firms
Total employment in US-owned firms
1973 73631 15487
1974 74072 15737
1975 72599 16750
1976 76282 19345
1977 80518 22523
1978 84446 24799
1979 90170 28366
1980 90633 29679
1981 89513 30232
1982 89070 31916
1983 85786 32549
1984 84216 32130
1985 82052 30997
1986 82340 31576
1987 81211 30942
1988 83789 33148
1989 87418 35920
1990 88762 37939
1991 89169 38189
1992 88840 39732
1993 90397 42676
1994 93755 46232
1995 98853 51096
1996 102389 55199
1997 107877 61070
1998 110620 63114
1999 112564 65400
2000 121701 74807
58
DISCUSSION
Mr. Michael Connolly: I would like to propose a vote of thanks to the authors of this paper, Frank and Clare. The paper is the product of a substantial investigation into the various data series on inward FDI into Ireland and reflects a sound understanding of the concepts underlying this topic. The authors have shown great tenacity in resolving the many inconsistencies that they identify in the paper. They then proceed to validate these findings or hypotheses through the use of various comparative measures. I would now like to make a few observations on the paper together with some more general comments regarding the interpretation of FDI data.
Data Series
There are essentially two types of data series discussed in this paper, domestic data series, that is to say series produced in Ireland, and mirror data series which are data series compiled elsewhere. The domestic series is composed of the CSO Balance of Payments (BOP), published nationally which is also forwarded to the IMF for their publications and the IDA series of data on investment into grant aided industries. The mirror data is from the Bureau of Economic Analysis (BEA) in the US and Eurostat for earlier years. The CSO BOP is the source for two of the series on flows in Table 1 of the paper i.e. IMF/UNCTAD and CSO while IDA data is used for OECD2 series. These data series are relatively consistent until in 1987 when a decision was taken by CSO to combine FDI data with Portfolio Investment data together with data on holdings of deposits abroad under the heading Private Capital. From 1987 until 1997 this series (CSO) ceases to have any analytical value for FDI purposes. The decision to publish at a higher level of aggregation in 1987 reflects the serious concerns that CSO had regarding data quality due to poor survey response and the decreasing value of exchange controls data. During this same period the IMF/UNCTAD data series continued to be based on net FDI flows which were provided by CSO.
From 1998 onwards we find a general convergence towards the use of CSO data by all International Organisations. The paper examines each of these data series through the entire period and the authors’ assessments are difficult to disagree with. Regarding the IDA series we also see the analytical value of the series discussed. However, it is clear that this data series is far from comprehensive or complete and cannot really be considered as an FDI series. As part of this assessment of the domestic data, the authors identify reinvested earnings as a probable cause of the break in series in 1990 of the IMF/UNCTAD series. I want to develop this point about reinvested earnings in a more general way.
Re-invested Earnings (RIE)
The inclusion of RIE is correctly identified as causing a break in the IMF/UNCTAD flow data series. This resulted from CSO implementation of ESA95 (European System of Accounts) measurement standards for Profits which previously only recorded dividend repatriations. The data was revised in 1995 with back series to 1990. However, we should be clear that all national compilers have still not implemented this change in methodology, at least in the EU. As recently as March 2004 we find the ECB/Eurostat Joint Task Force on FDI (TF-FDI) making the following observations:
“The TF-FDI deems the non-inclusion of reinvested earnings as the most crucial problem in this area. This difficulty seems to be closely connected with the lack of FDI surveys which should be resolved promptly1…”
The Task Force report goes on to say that collection /compilation methods were in a transitional
1