Voltage Profile Modification Using Genetic
Algorithm In Distribution Systems
S.Jalilzadeh, S. Galvani, H. Hosseinian, F.Razavi
Abstract— With consideration to importance of power quality in power systems especially in distribution systems and with increasing application of electronic devices which have higher sensitivity to fed powers quality, in this paper voltage profile in distribution systems has been surveyed. Improvement of voltage profile via injection of reactive power has been depicted. Presence of loads which is generating harmonic components aren’t negligible hence for achievement precise result harmonic load flow was performed on case study that was IEEE 37 node test feeder.
Index Terms— Distribution networks, Genetic algorithm, Harmonic load flow, Voltage Profile.
I. INTRODUCTION
Application of non-linear loads which are the most important harmonic generation sources has been grown increasingly in recent years. Electric furnace and power electronic converters are examples of such devices. Generated harmonics which flow in network impedances cause voltage harmonics and reduce power quality of network. Loss increase, failing of capacitor banks, life reduction of electrical equipments, Disturbance in correct performance of control and protection systems and resonance between different harmonics are some effects of this phenomena. To reduce of harmonic effects and voltage profile deviation in distribution networks, reactive power injection can be used as a useful approach. Injection process includes locating and determination of needed reactive powers value, which cause losses reduction. Improvement in voltage profile and ability of using of maximum capacity of network equipments, losses reduction in distribution system by capacitor placement has been studied in many researches.
Classic methods such as gradient based approach are used for calculation of optimal power value of needed power injection. In some other the optimal reactive power flow has been divided to sitting and sizing sub problems. This problem has been solved with other optimization methods such as simulated annealing. Genetic algorithm because of its ability to solving nonlinear and discrete problems proposed to solve this problem. This problem has been performed with load loss
S.Jalilzadeh, S.Galvani and H.Hosseinian are with the department of electrical engineering, Zanjan University, Zanjan, Iran (corresponding author
phone: 0098-261-4333766; e-mail: [email protected]).
F. Razavi, is with department of electrical engineering, Amir kabir university of technology,Tehran, Iran.
reduction purpose or cost reduction purpose [3, 4]. But voltage profile has been less attended as fitness function specially with considering voltage harmonic component. In this paper the aim is comparison of various type of capacitor placement for improvement of voltage profile. Many of reactive power planning is based on frequency main component, but because of harmonic component increase in power networks and their effects on voltage profile and losses, harmonic disturbances must be more attended. In this paper reactive power planning in present of unbalanced loads are described initially then problem formulation with fitness function introducing and constraints are discussed. Finally results have been shown on IEEE 35 node test feeder (network attained from IEEE 37 node test feeder reduction).
II. OPTIMALREACTIVEPOWERPLANNING Nowadays reactive power planning is one of important factors in design and exploitation of power systems. Consumption growth leads to losses growth. So finding methods that can keep system voltage in permissible limits and decrease losses synchronously is essential. This affair is performed by network reactive power control usually. Expansion and large dimensions of distribution networks and power transfer through long lines cause great voltage drops in lines. Also with ever-increasing electronic devices applications power quality in load point must be improved from voltage and frequency aspects. Because voltage and frequency fluctuations can be very harmful for consumers reactive power control is one of best methods for good power quality achievement. This can be performed by reactive power injection in some substations with parallel capacitors or reactors or by other methods such as generator voltage changing, synchronous condenser installation in network and changes in auto transformers tap. Loads usually are fed radial in distribution networks from sub transmission substations so effective approach for optimization of reactive power in distribution systems is capacitors placement. Improper selection of location and value of capacitor lead to voltage profile deviation in substations and increase transmitted reactive power.
III. PROBLEMFORMULATION
in delta mode, third harmonic component and its multipliers don’t flow in the network and only fifth, seventh, eleventh harmonic component is considered. The aim in optimal reactive power control is not only minimization of losses or voltage profile improvement but value of variables must satisfy physical and operational constraints.
A. Fitness Function
Fitness function in optimal reactive power planning in order to voltage improvement is defined as (1)
2 1 1 2 1 2 ) ) ( ( ) 1 ( max
∑
∑
= = = − = h h h i i n i i V V V F (1)n Number of feeders in network
h i
V Voltage hth harmonic component in feeder i
i
V ith feeder voltage
max
h Highest harmonic component level
B. Constraints
Nodal active and reactive power balance equations are as in (1), (2) 0 ) ( = − −
∑
∈N i j
ij Di
Gi P P
P (2)
0
) (=
−
−
∑
∈Ni j
ij Di
Gi
Q
Q
Q
(3)Di Gi P
P , Generated and consumed active power in ith feeder
Di
Gi Q
Q , Generated and consumed reactive power in ith feeder
ij ij Q
P , Transferred active and reactive power from ith feeder to jth feeder
max
min i i
i V V
V ≤ ≤ (4) Permissible upper and lower bound of feeders voltage
m i p pi ,..., 2 ,1 max = ≤ (5) Maximum transferable active power in lines
m Number of lines in network
max
min G G
G Q Q
Q ≤ ≤ (6) Upper and lower boundaries of reactive power injection in feeders
IV. HARMONICLOADFLOWINRADIAL DISTRIBUTIONSYSTEMS
Conventional load flow methods such as Quasi-Seidel encounter with limitation such as convergence problem. In this method with decreasing lines reactance to resistance ratio
convergence speed decreases severely. Even in networks which their X and R value are near to each other divergence is occurred. A load flow method especially adapted for radial distribution systems was used in this research. Initially all feeders voltage assumed to be 1 pu. Line current harmonic component is calculated using this voltages and nodes active and reactive powers in each harmonic level then total line current are calculated and is used for calculation of active and reactive losses in lines. Total losses of network are equal to sum of all lines losses. Current in slack feeder is calculated according to (7) and (8).
∑
= h
h
I
I ( )2 (7)
* , , 1 , , 1 ,
, ( ) ( ) ih
S h i loss n i h i h i loss n i h i h i E Q Q j P P
I =
∑
+ −∑
+= = (8) h i loss
P, ,
∑
System total load in hth harmonic= n i h Q 1 h loss
P , Qlossh System total loss in hth harmonic
* S
E is conjugation of voltage in slack feeder. Calculation continues and voltage drop and current in each line obtained from slack feeder to end and new voltage of nodes achieved finally. When this cycle complete once total losses is calculated from (9) to (12) and is compared with previous cycle losses. This process continues till losses difference in two successive cycles be less than permissible tolerance.
∑
= h h loss tot loss PP (9)
∑
= h h loss tot loss QQ (10)
∑∑
= = ⎥ ⎥ ⎦ ⎤ ⎢ ⎢ ⎣ ⎡ − − + = n i nj ih jh ih hj
h j h i h ij ij h loss V V V V Y R P 1 1 2 2 2 ) cos( 2 ) ( ) ( ) ( θ
θ (11)
∑∑
= = ⎥ ⎥ ⎦ ⎤ ⎢ ⎢ ⎣ ⎡ − − + = n i nj ih jh ih hj
h j h i h ij ij h loss V V V V Y R Q 1 1 2 2 2 ) sin( 2 ) ( ) ( ) ( θ θ (12) Where: ij
R Resistance of line between feeder i and j
h ij
Y hth harmonic admittance between feeder i and j
h j h i V
V , hth harmonic component of voltage magnitudes in feeders i and j
h j h i θ
V. GENETIC ALGORITHM
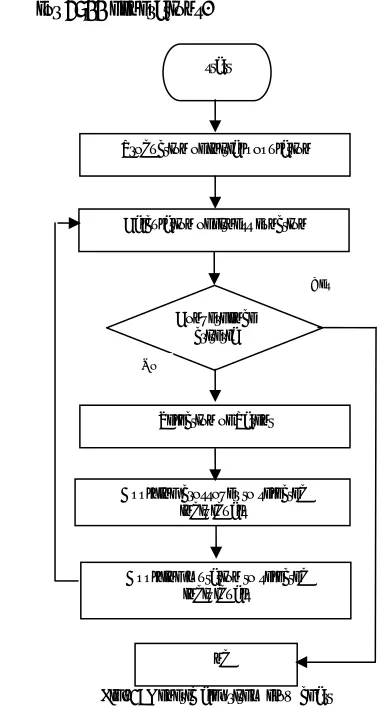
The GA is an optimization method based on evolution adaptations in nature. The GA works with a population of individuals (chromosomes) which each individual stands for a solution. Each part of chromosomes (genes) stands for special variable of mentioned problem. New generation is produced with considering individuals fitness function and genetic operators (selection, crossover and mutation) and individual’s fitness improve through the algorithm iterations. This algorithm is used for power system optimization problems widely. Optimal reactive power planning using genetic algorithm with consideration of losses as fitness function has been done in many papers. In this paper genetic algorithm is used for voltage profile improvement with consideration of loads harmonic component in distribution systems. The flowchart of this algorithm has been shown in figure 1.
Stopping criteria determine the causes of the algorithm stopping and include two parts. In this research algorithm will terminate if each of these conditions is satisfied:
• Performance of algorithm up to 5000 iterations.
[image:3.612.337.537.50.291.2]• If there is no improvement in the best fitness value for 2500 generations.
Fig. 1: Genetic algorithm flow chart
VI. STUDY CASE AND OBTAINED RESULTS
[image:3.612.65.261.309.668.2]35 node distribution power system shown in figure 2 is studied as case study.
Fig. 2: IEEE modified 35 node test feeder
network loads are P, Q constant loads with delta connection. Initial voltage profile has been shown in Fig. 3.
5 10 15 20 25 30 35 0.965
0.97 0.975 0.98 0.985 0.99 0.995 1 1.005
Buses Number
V
o
lt
ag
e (
p
[image:3.612.333.532.352.518.2]u)
Fig. 3: Initial network voltage profile
It is clear from figure 3 that voltage drop in feeders far from slack feeder is great. Since compensation is required for feeders with great voltage drop. In this study feeders with voltage drop greater than 0.02 p.u. are selected for reactive power injection which includes twelve feeders from feeder number 24 to 35.
Chromosome that is used for algorithm has twelve genes represent for amount of reactive power injection to each selected feeder as shown in Fig. 4.
Feeder number 24
Feeder number
25
… number 34Feeder number Feeder 35
QG24 QG25 … QG34 QG35
Fig. 4: Chromosome used for genetic algorithm start
Production of initial population
End Selection of Parent
Applying crossover to selected individuals Calculation of fitness function
Applying mutation to selected individuals Convergence
criteria
Yes
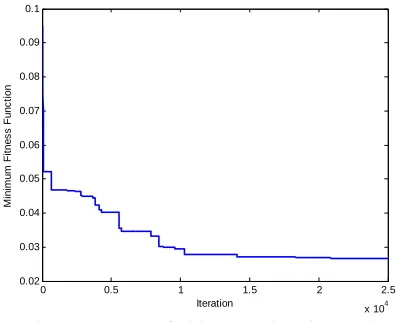
[image:3.612.306.571.654.704.2]Number of population individuals in each generation is selected 20 and crossover rated is 0.5 and mutation rate is 0.06. These rates are obtained after performing algorithm with various rates for mutation and crossover and selected as best values. Minimum of objective value for each generation has been shown in Fig 5. the reason of why algorithm terminate is 2500 iteration complete as shown in the fIg.5.
0 0.5 1 1.5 2 2.5
x 104 0.02
0.03 0.04 0.05 0.06 0.07 0.08 0.09 0.1
Iteration
Min
imu
m F
it
n
e
s
s
Fu
n
c
ti
o
[image:4.612.69.269.143.304.2]n
Fig.5: Improvement of minimum cost in each generation
[image:4.612.332.532.145.297.2]Proposed result of algorithm for reactive power injection in selected feeders is shown in figure 6 and precise amount of them are shown in table 1. With consider to table, number 30, 31 and 34 feeders require to reactive power consumption.
Table I: PRECISE VALUE OF INJECTED REACTIVE POWER TO FEEDER
Feeder
number 2524 26 27 28 29
Reactive power (kVar)
-589
-596 -570 -595 -530 -563
Feeder
number 3130 32 33 34 35
Reactive power (kVar)
+389
+177 -561 -167 +418 -61
24 25 26 27 28 29 30 31 32 33 34 35 -600
-400 -200 0 200 400 600
Buses Number
In
je
cte
d
R
e
a
c
ti
ve
P
o
w
e
r
Fig. 6: Bar diagram of injected reactive power to feeders
After reactive power injection to selected feeders, network total voltage profile has been shown in figure 7. the end feeders voltage have good improvement through this. In addition voltage level in other feeders improves relatively. Finally network voltage profile in two states (before and after reactive power injection) has been compared with each other in table II.
5 10 15 20 25 30 35 0.965
0.97 0.975 0.98 0.985 0.99 0.995 1 1.005
Buses Number
V
o
lt
ag
e (
p
u)
Fig .7: Network voltage profile after reactive power injection
TABLE II: FITNESS FUNCTION VALUES AND AMOUNT OF LOSES BEFORE AND AFTER REACTIVE POWER INJECTION
Before reactive
power injection power injectionAfter reactive Fitness function
value 0.02340.1122
Losses
%12.4 %11.6
Also losses amount in this two states has been brought in table 2. as it has been shown in the table network total loss decreased from 12.4 percent to 11.6 percent.
VII. CONCLUSION
In this paper voltage profile and its importance in distribution systems was surveyed. With consideration to great effects of loads harmonic component on network voltage profile, harmonical load flow has been used for precise results. Reactive power injection especially in end busses that are far from slack buss has been used in order to improvement of voltage profile and genetic algorithm has been selected as search method to determine optimum value of injected reactive power. Results show that voltage profile was improved and amount of losses was decreased by this method.
REFERENCES
[1] J. J. Grainger, S .H .Lee, "Optimal size and location of shunt capacitors
for reduction of losses on distribution feeders", IEEE Transaction on Power APP.Syst, vol. PAS-100, Mar. 1981, Page(s):1105-1116
[2] M .E. Baran, F .F. Wu, "Optimal capacitor placement on radial
distribution systems", IEEE Transaction on Power Delivery ,Volume 4, Issue 1, Jan. 1989, Page(s):725 – 734.
[3] C. S. Chen, C. T. Hsu, Y. H. Yan, "Optimal distribution feeder capacitor
[image:4.612.43.306.400.703.2]Transaction on Power Delivery, Volume 10, Issue 2, April 1995, Page(s):987 – 994.
[4] S. Sundhararajan, A. Pahwa, "Optimal selection of capacitors for radial
distribution systems using a genetic algorithm", IEEE Transaction on
PowerSystem, Volume 9, Issue 3, Aug. 1994, Page(s):1499 – 1507.
[5] K. N. Miu, H. D. Chiang, G. Darling, "Capacitor placement,
replacement and control in large-scale distribution systems by a
GA-based two-stage algorithm", IEEE Transaction on Power System,
Volume 12, Issue 3, Aug. 1997, Page(s):1160 – 1166. [6] http://ewh.ieee.org/soc/pes/dsacom/testfeeders.html
[7] C. J. Kaufman, Rocky Mountain Research Lab., Boulder, CO, private
communication, May 1995.
[8] T. Niknam, A. M. Ranjbar, H. Arabian, M. Mirjafari, "Optimal reactive