Abstract— Although experimentation is a frequent activity of engineers, they usually use primitive strategies to carry on their experiments. A survey identifies the needs of using an efficient and practical technique for the experimentation. Although Six Sigma improvement initiative emphasized the use of Design of Experiments (DoE) for experimentation, engineers still consider it a difficult technique to apply and interpret. For this reason, this paper presents a methodology that tries to make easier the implementation of DoE, as an approach to bridge the existing gap between the technique and industries.
Index Terms—Design of Experiments, Methodology, Six Sigma, Survey.
I. INTRODUCTION
Engineers do a variety of activities such as developing new products, improving previous designs, maintain, controlling and improving ongoing manufacturing process; maintaining and repairing products, among others. As experimentation is a frequent task in those activities, engineers end up using statistics regardless of their background in it. Therefore the issue is not whether they use statistics or not, but how good they are at it [1]. The aim of this paper is to stimulate the engineering community to apply an efficient technique to experimentation, the Design of Experiments, to tackle quality problems in key processes that they deal with everyday.
We understand as Lye [2], the Design of Experiments (DoE) as a methodology for systematically applying statistics to experimentation. It consists of a series of tests in which purposeful changes are made to the input variables (factors) of a product or process so that one may observe and identify the reasons for these changes in the output response [3]. DoE provides a quick and cost-effective method to understand and optimize products and processes. Although these techniques are commonly found in statistics and quality literature, they are hardly used in industry.
By the end of the twentieth century, DoE was no longer viewed as merely a stand-alone tool, because it was packaged
Manuscript submitted March 20, 2007.
Martín Tanco is from the Department of Industrial Management Engineering at TECNUN (University of Navarra), Spain. (phone: 34- 943219877; e-mail: mtanco@ tecnun.es)
Elisabeth Viles, Laura Ilzarbe, María Jesus Álvarez are from the Department of Industrial Management Engineering at TECNUN (University of Navarra), Spain (emails: {eviles,lilzarbe,mjalvarez}@tecnun.es)
together with a structured initiative for business improvement known as Six Sigma. Moreover, an increased emphasis on DoE took place during this period in Six Sigma literature [4]. Although, Six Sigma emphasizes the benefits of using DoE in experimentation and promote its use, little efforts has been given to making DoE application simpler and more practical.
In the following section, we briefly explain Six Sigma and the importance of DoE on it. In section 3, we use a survey to evaluate the necessity and degree of implementation of DoE. Finally, in section 4 we present our methodology as an approach to bridge the existing gap between DoE and industries. Moreover, we included a brief explanation of the activities needed and tools which can be used for each step
II. DESIGN OF EXPERIMENTS:KEY TOOL OF SIX SIGMA
Although there is no common definition of Six Sigma, apart from the statistical term definition, we use Linderman’s definition [4]: “Six sigma is an organized and systematic method for strategic process improvement and new product and service development that relies on statistical methods and the scientific method to make dramatic reductions in customer defined defect rates”.
Like quality management in general, Six Sigma has penetrated most sectors of today’s business world, still being one of the most popular philosophies in the business world. A key difference between Six Sigma and other approaches is the integration of a highly disciplined process with one that is quantitative and data oriented [5]. In light of the stellar results obtained by the companies that have used it (see Fortune 500 companies), one can only conclude that this is a wining combination.
Six sigma uses a five-step process known as DMAIC, named for the five steps in the process: Define, Measure, Analyse, Improve, and Control. Generally, after the project definition phase, key process characteristics are identified and benchmarked in the Measurement and Analyse phases; this is followed by the Improvement phase where the process is changed for better performance, then the Control phase aimed at monitoring and sustaining gains. The detailed contents and sequence of applications of DMAIC tools could vary from one organization to another and from project to project. However, their integration and logical flow is what makes possible the overall impact of Six Sigma [6].
Experimentation, mainly in the phases of Analysis and
Manufacturing Industries Need
Design of Experiments
(DoE)
Improvement, is often the best way to achieve the goals proposed for the project. Consequently, DoE as an efficient technique for experimentation constitutes the bulk of these important phases, making DoE a crucial technique.
III. GAP BETWEEN DOE AND INDUSTRIES
If In order to get first-hand information, a survey was designed to detect the need of DoE and the degree of implementation of this technique within industries. Questionnaires were sent by post in April 2006 to over 760 manufacturing industries, with over 50 employees, in The Basque Country. Though the geographical area of The Basque Country may be modest, Basque industry is recognized throughout Europe for its quality and prestige (see for example the EFQM Quality awards).
A total of 138 completed questionnaires were received, at a response rate of 18%, which leads to a survey-wide sample error rate of 7,7%. A significant bias caused by industry-size responses exists, so results given for the whole population have been calculated using true determiners of industry size.
To be able to detect the need for specific experimentation techniques, the frequency of experimentation in industries must first be established. Results showed in fig. 1 state that 95% of industries in The Basque Country carry out experimentation, 50% of which do it frequently.
Montgomery [3] suggests that three types of experimentation strategies exist: Best Guess, One Factor At a Time (OFAT) and Statistical Designed Experiments (DoE). The first one consists of using prior knowledge to modify several variables and conduct the experiment under conditions expected to give the best results. Secondly, OFAT strategy consists of modifying one variable at a time while keeping the others fixed. Finally, DoE is the most effective method for solving complex problem with many variables.
[image:2.612.322.525.493.634.2]Results show that 39% of industries follow Best Guest strategies, while 80% of industries conduct experimentation using the OFAT strategy. Furthermore, only 20% of industries carry out experimentation with a pre-established statistical methodology.
Fig. 1 – Frequency of experimentation
Most engineers apply OFAT strategy to their experiments. They will continue to do so until they understand the
advantages of DoE over OFAT. Many articles have been written about the advantages, although we recommend Czitrom’s work [7]. It shows, with real engineering examples, how DoE presents the following advantages over OFAT:
• It requires less resources (experiments, time, material, etc.) for the amount of information obtained
• The estimates of the effect of each factors (variable) on the response are more precise
• The interactions between factors can be estimated systematically (Interactions are not estimable with OFAT experiments)
• There is experimental information in a larger region of the factor space.
Foreseeing the low usage of statistical methodologies, the need for a methodology to help industries carry out their experiments was evaluated. This survey shows that 76% of industries consider themselves in need of a methodology.
The respondents were asked to rate their knowledge of DoE on a scale from ‘1-not at all’ to ‘5-master’. The results to this questionnaire show that the majority of respondents are unfamiliar with DoE, as only 33% of industries claim to know at least ‘3-something’ about DoE.
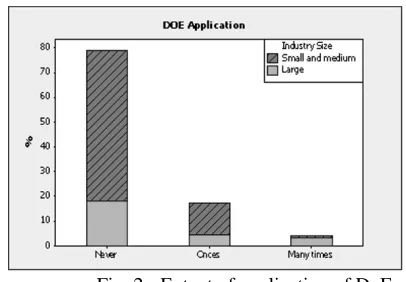
[image:2.612.76.279.558.698.2]Afterwards, respondents were asked to rate the extent to which they used DoE on a scale from 1 (not at all) to 3 (frequently). The results in fig. 2 confirm that despite all efforts by specialists in quality and statistics, DoE is still not applied as widely as it could and should be. Only 20% of industries in The Basque Country have applied DoE and only 3 % of those apply it frequently (representing 15% of total users). Again there is a significant difference in the application rate when it comes to industry size, as is seen in the application rate of 18% at small and medium industries(SMI) and 29% at large industries, of which only 6% and 39% apply it frequently.
Fig. 2 - Extent of application of DoE
Application rates of DoE, presented in previous papers, do not significantly differ from our survey results. Besides the low rate of application reflected by surveys, recent results seem to show a light increase in the application of DoE throughout this region.
using the terms never, sometimes or generally. The survey shows that 31% of industries used Six Sigma on recent projects, although only 3% apply it frequently. There is a significant difference in Six Sigma applications when it comes to industries sizes, as large industries use twice as many applications as SMIs. The application of Six Sigma methodology has a predictably positive influence on the application of DoE. The application rate among Six Sigma users is 39%, twice that of non-users, which sits at 18%. Furthermore, more than 50% of DoE applications are executed by Six Sigma users.
Taguchi proposed an approach to DoE based on orthogonal designs and some novel yet simple methods for analyzing the resulting data. His analyses were criticized for being inefficient and in many cases ineffective [8]. However, the simplicity of his approach increased the use of his analysis in manufacturing industries. Results show that 51% of respondents are familiar with TM, although only 14% of them apply it. We noticed that the TM is not correlated to industry size, surely due to the simplicity of its methods.
In order to pinpoint the challenges that DoE faces in finding its niche in industries, respondents were asked to describe their view of DoE using one of several possible answers. Results show that two biggest barriers in the application of DoE are: “Theoretical ignorance of DoE for real applications” (43%) and “Absence of a clear methodology to simplify its application” (37%).
To sum up, although experimentation is a frequent activity, strategies used are quite primitive, leading to a very low usage of statistical tools. It can be concluded that DoE is little used in industries, although that trend seems to be changing. Results also showed that Six Sigma has a positive influence on the application of DoE.
IV. NEW METHODOLOGY FOR THE APPLICATION OF DOE Hard work must be done to bridge the existing gap between DoE and industries. Our approach for bridging the current gap between industries and statistical methods was to elaborate a simple, easy and thorough methodology from an engineering point of view, without ignoring the complexity of this task and its statistical severity. The survey supports our decision, showing that 76% of respondents believed that a methodology is truly needed and that the absence of a clear methodology was one of the main barriers in the application of DoE.
Our new methodology has been validated theoretically at the DEMA conference [9] and proved to be useful in an automotive engineering industrial application.
A. Methodology model
In the beginning DoE research focused on models, criteria and many other topics referring almost exclusively to the experimentation and analysis step. Since the 1980s, interest in the pre-experiment stage and the forgotten control stage grew significantly, reviving the development of some complete methodology and models representing different stages such as
Montgomery’s [3] seven steps model, among others(e.g.: Drain [10] and Lorenzen [11]). In spite of these methodologies, none clearly describes from a practical point of view, the steps and activities that must be fulfilled to apply DoE.
Applying DoE in industries is a very complex task whereas the scientific community continues to develop algorithms and designs with better mathematical properties, scant importance has been provided to solve industry’s real problems. DoE is too important as to be left only to statisticians.
Taking advantage of the democratization of statistics, partly thanks to software packages and the spread of Six Sigma thinking throughout industries, our approach will present a framework for the experimentation process following the traditional DMAIC steps as a generic problem solving methodology.
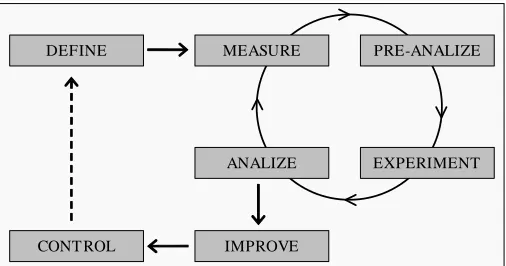
However, it was necessary to adapt the DMAIC model, in order to fit the application of DoE to a similar structure. Fig. 3 shows the complete model of the methodology, in which can be seen the need for two more steps: Pre-Analyse and Experiment. A hypothetical Analysis step from the DMAIC was divided intro three, including the selection of the experimental design in the Pre-Analysis step and the analysis of the data obtained from the Experiment step Analysis step.
PRE-ANALIZE MEASURE
EXPERIMENT ANALIZE
DEFINE
[image:3.612.314.567.344.477.2]IMPROVE CONT ROL
Fig. 3- Model of the methodology for applying DoE Moreover, the model aims to transmit some more theoretical concepts. Firstly, the existing cycle stimulate not to conduct a one-shot experiment and make experiments in more than one stage. As Fisher, the pioneer of DoE said, the best moment to design an experiment is when it is concluded. Consequently, the following experiments will obtain better results than the first ones. Benefits of the sequenced experiments are shown in Box’s helicopter example [12].
Secondly, the arrow connecting the Control and Define stages aims to establish experimentation as an inductive-deductive learning process [13]. Experimentation must be understood us a tool to continuously improve the whole process.
B. Activities & Tools
complete a DoE project. Furthermore, the guidelines mention the tools that may help users to fulfil their task. The guidelines are written without statistical jargon in order to reach those who have a weak statistical background. Finally, special worksheets were designed for each of the steps in order to recollect the information needed, the tools utilized and the results obtained in every activity.
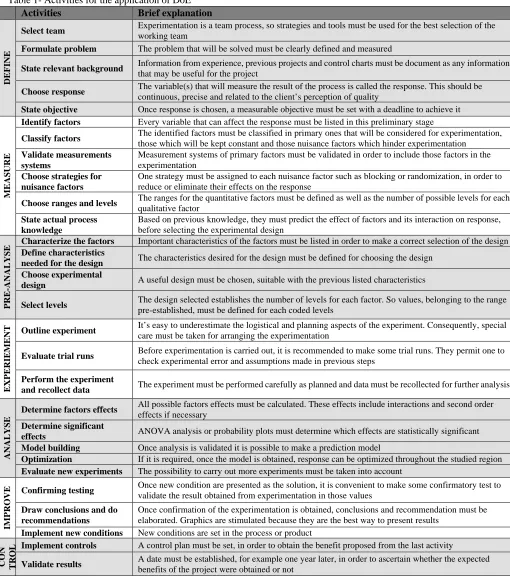
Because we cannot include the whole guidelines, the activities needed for each step are present in Table 1, along with a brief explanation of the task.
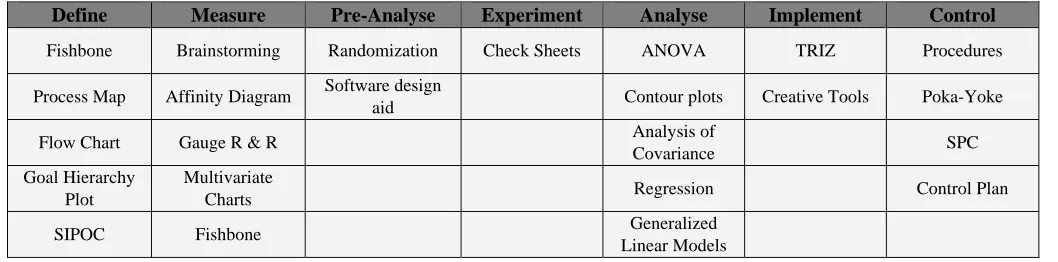
[image:4.612.49.559.155.736.2]As mentioned before, tools which can help to carry out easily the activities needed are included in the guidelines. Table 2 shows a resume of the main tools that can be used for each step.
Table 1- Activities for the application of DoE
Activities Brief explanation
DEFINE
Select team Experimentation is a team process, so strategies and tools must be used for the best selection of the working team
Formulate problem The problem that will be solved must be clearly defined and measured
State relevant background Information from experience, previous projects and control charts must be document as any information that may be useful for the project
Choose response The variable(s) that will measure the result of the process is called the response. This should be continuous, precise and related to the client’s perception of quality
State objective Once response is chosen, a measurable objective must be set with a deadline to achieve it
MEASURE
Identify factors Every variable that can affect the response must be listed in this preliminary stage
Classify factors The identified factors must be classified in primary ones that will be considered for experimentation, those which will be kept constant and those nuisance factors which hinder experimentation
Validate measurements systems
Measurement systems of primary factors must be validated in order to include those factors in the experimentation
Choose strategies for nuisance factors
One strategy must be assigned to each nuisance factor such as blocking or randomization, in order to reduce or eliminate their effects on the response
Choose ranges and levels The ranges for the quantitative factors must be defined as well as the number of possible levels for each qualitative factor
State actual process knowledge
Based on previous knowledge, they must predict the effect of factors and its interaction on response, before selecting the experimental design
PRE-ANALYSE
Characterize the factors Important characteristics of the factors must be listed in order to make a correct selection of the design Define characteristics
needed for the design The characteristics desired for the design must be defined for choosing the design Choose experimental
design A useful design must be chosen, suitable with the previous listed characteristics
Select levels The design selected establishes the number of levels for each factor. So values, belonging to the range pre-established, must be defined for each coded levels
EXPERIEMENT
Outline experiment It’s easy to underestimate the logistical and planning aspects of the experiment. Consequently, special care must be taken for arranging the experimentation
Evaluate trial runs Before experimentation is carried out, it is recommended to make some trial runs. They permit one to check experimental error and assumptions made in previous steps
Perform the experiment
and recollect data The experiment must be performed carefully as planned and data must be recollected for further analysis
ANALYSE
Determine factors effects All possible factors effects must be calculated. These effects include interactions and second order effects if necessary
Determine significant
effects ANOVA analysis or probability plots must determine which effects are statistically significant Model building Once analysis is validated it is possible to make a prediction model
Optimization If it is required, once the model is obtained, response can be optimized throughout the studied region Evaluate new experiments The possibility to carry out more experiments must be taken into account
IM
PROVE
Confirming testing Once new condition are presented as the solution, it is convenient to make some confirmatory test to validate the result obtained from experimentation in those values
Draw conclusions and do recommendations
Once confirmation of the experimentation is obtained, conclusions and recommendation must be elaborated. Graphics are stimulated because they are the best way to present results
Implement new conditions New conditions are set in the process or product
CON TROL
Implement controls A control plan must be set, in order to obtain the benefit proposed from the last activity
Evaluate iteration Experimentation is an iterative inductive deduction learning process, so once the whole cycle is finished, new experimentation must be evaluated
Table 2- Tools that may be used in each step of the methodology
V.CONCLUSIONS
Engineers perform experiments and analyse data as an integral part of their job. Whether or not engineers have learned statistics, the will use statistics. The survey confirmed that DoE is hardly used; however this technique is necessary for the experimentation frequently carried out within industries. However, manufacturing industries need the Design of Experiments (DoE) technique to increase the effectiveness of their engineers and the efficiency of their processes. Moreover, Six Sigma has made DoE even more necessary, since it is a key tool of this widespread methodology. Our approach is to present a validated methodology to simplify and clarify the application of DoE, guiding them through the entire project with structured steps and activities explained using special guidelines. We hope this methodology will help DoE become well-known and frequently used among industries.
REFERENCES
[1] Bisgaard, S., Teaching Statistics to Engineers. The American
Statistician, 1991. 45(4): p. 274-283.
[2] Lye, L.M. Tools and toys for teaching design of experiments
methodology. in 33rd Anual General Conference of the
Canadian Society for Civil Engineering. 2005. Toronto, Ontario, Canada.
[3] Montgomery, D.C., Design and Analysis of Experiments. 2005:
John Wiley & Sons, Inc.
[4] Brady, J.E. and T.T. Allen, Six Sigma literature: A review and
agenda for future research. Quality and Reliability Engineering International, 2006. 22: p. 335-367.
[5] Hahn, G.J., Six Sigma: 20 Key Lessons Learned. Quality and
Reliability Engineering International, 2005. 21: p. 225-233.
[6] Goh, T.N., The role of statistical Design of Experiments in Six
Sigma: Perpectives of a practitioner. Quality Engineering, 2002. 14(4): p. 659-671.
[7] Czitrom, V., One factor at a time versus Designed Experiments.
The American Statistician, 1999. 53(2): p. 126-131.
[8] Nair, V.N., Taguchi's Parameter Design: A panel discussion.
Technometrics, 1992. 31(2): p. 127-161.
[9] Viles, E., Tanco, M., Ilzarbe, L., Alvarez, M.J. An approach for
bridging the gap between industries and DOE, in DEMA: Recent Advances in Methods and Applications. 2006: Southampton, UK.
[10] Drain, D., Handbook of Experimental Methods for process
improvement, ed. T. Science. 1997. 317.
[11] Lorenzen, T.J. and V.L. Anderson, Design of Experiments - A
No-Name Approach, ed. Dekker. 1993. 414.
[12] Box, G.E.P. and P.Y.T. Liu, Statistics as a Catalyst to learning
by Scientific Methof Part I. Journal of Quality Technology, 1999. 31(1): p. 1-15.
[13] Box, G.E.P., J.S. Hunter, and W.G. Hunter, Statistics for
Experimenters - Design, Innovation and Discovery. Second Edition ed. Wiley Series in Probability and Statistics, ed. Wiley. 2005, John Wiley & Sons.
Define Measure Pre-Analyse Experiment Analyse Implement Control
Fishbone Brainstorming Randomization Check Sheets ANOVA TRIZ Procedures
Process Map Affinity Diagram Software design
aid Contour plots Creative Tools Poka-Yoke
Flow Chart Gauge R & R Analysis of
Covariance SPC
Goal Hierarchy Plot
Multivariate
Charts Regression Control Plan
SIPOC Fishbone Generalized