HIGHER EDUCATION AUTHORITY
HEA
Higher Education 2012/13
KEY FACTS &
FIGURES
3 2
contents
New Entrants
9
Graduates
19
Enrolments
12
Participation
25
Finances
42
Staff 40
Research 22
The Higher Education Authority wishes to acknowledge the authorship of Vivienne Patterson, Dawn Carroll and Valerie Harvey.
5 4
The HEA Key Facts and Figures 2012/13 is the ninth in the series of annual reports from the HEA’s
Policy and Strategic Planning (Statistics) unit.
It provides an overview of data from the Irish higher education system highlighting key trends for
the year. It also includes specific information on:
• New Entrants
• Enrolments
• Graduates
• Research
• Participation
• Staffing
Furthermore, for the first time, the report contains detail on finances in the system, taken from the
higher education institutions' audited financial statements.
Overall enrolments to the higher education system continue to increase with over 200,000
full-time, part-time and remote students enrolled in HEA funded institutions in 2012/13, an increase
of 14% over the last five years. The number of full-time new entrants to undergraduate higher
education now exceeds 41,000, a figure that is 7% higher than five years ago and reflects an
increasing demand for higher education in Ireland. There are 9,500 students engaged in research
annually in HEA-funded institutions, a figure which has dropped by 8% over 2011/12.
A new format of infographic presentation of the year’s key statistics is given in this report and
aims to provide the reader with a new interesting approach to the interpretation of the HEA’s
student statistics. A range of trends for the period are also displayed in this publication and are
intended as a convenient reference document for higher education institutions, government
departments and those with an interest in higher education in Ireland. Further student statistics
for 2012/13 are available on the HEA website.
The HEA wishes to thank the participating institutions for their on-going cooperation.
Tom Boland
Chief Executive
April 2014
94% were from Ireland and of these, nearly a quarter from Dublin and over 10% from Cork.
41,413 full-time undergraduate new entrants to higher education in 2012/13.
Full-time undergraduate new entrants increased by 7% in the last five years.
Almost three-quarters of these new entrants went into an Honours Bachelor Degree programme.
The most popular study area was Social Sciences, Business and Law.
41,000
Foreword by Mr Tom Boland
Chief Executive, Higher Education Authority
key facts & figures 2012/13
new entrants
7 6
enrolments
Over 200,000 students enrolled in higher education institutions in 2012/13: 81.2% full-time, 17.4% part-time and 1.4% remote.
Four out of five students enrolled in full-time programmes and of these 87% undergraduate and 13% postgraduate.
Full-time undergraduates increased by 14% in the last five years.
The gender split between males and females is now 50:50, unlike five years ago, when females made up 54% of all full-time undergraduates.
14%
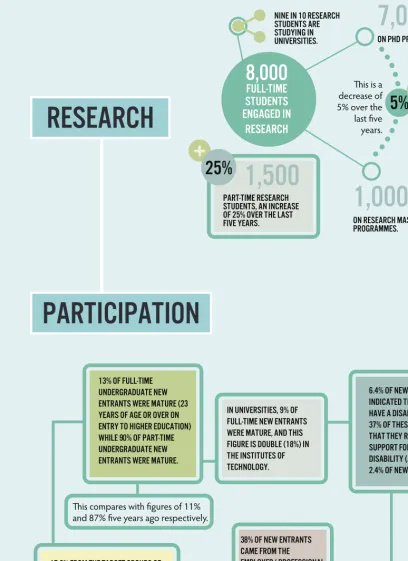
Nine in 10 research students are studying in universities.
7,000
on PhD programmes1,000
on research masters programmes. This is a decrease of 5% over the last five years.
5%
8,000
full-time
students
engaged in
research
25%
1,500
part-time research students, an increase of 25% over the last five years.This compares with figures of 11% and 87% five years ago respectively.
13% of full-time undergraduate new entrants were mature (23 years of age or over on entry to higher education) while 90% of part-time undergraduate new entrants were mature.
[image:4.1077.570.978.74.635.2]In universities, 9% of full-time new entrants were mature, and this figure is double (18%) in the institutes of technology.
38% of new entrants came from the employer/ professional socio economic groups. 17.2% FROM THE TARGET GROUPS OF
NON-MANUAL, SEMI- AND UNSKILLED.
6.4% of new entrants indicated that they have a disability and 37% of these indicated that they require support for their disability (a figure of 2.4% of new entrants).
research
participation
15% of honours degree graduates got a first class qualification.
Over 40% came from the Arts, Humanities, Social Sciences, Business and Law.
Nearly a quarter came from Science, Mathematics and Engineering. o
Nearly 44,000 undergraduates and 17,000 postgraduates.
NEARLY
61,000
GRADUATES OF
HIGHER
EDUCATION
INSTITUTIONS IN
2012.
2
graduates
9 8
over the last
five years
57%
63%
57%
43%
57%
63%
37%
63%
over 17,000 CORE staff
in higher education
institutions.
over 9,000 academic staff
8,000 non-academic staff
-10%
-17%
There are a further
5,300 research and
specialist staff
}
staffing
Nearly 10,000 (or 5% of) students pay a non-EU fee every year.
5%
The higher education sector takes in
€2.3bn annually and spends €1.6bn
every year on pay costs.
finances
+36%
57% of academic staff are
male, but 63% of
non-academic staff are female.
over the last five years
26% of full-time international from EU
asia 40%
NORTH AMERICA 26%
REST OF WORLD 8%
international
participation
academic
non-academic
45,000 40,000 35,000 30,000 25,000 20,000 15,000 10,000 5,000 0
2007/08 2008/09 2009/10 2010/11 2011/12 2012/13
Total
Female
Male
16,746 18,790 20,577 20,436 20,523 20,922
19,206 20,038 20,239 20,313 20,342 20,491
35,952 38,828
40,816 40,749 40,865 41,413
new entrants
FULL TIME UNDERGRADUATE NEW ENTRANT GENDER TRENDS 2007/08 – 2012/13
11 10
Full Time Undergraduate New Entrants by field of study 2012/13
Domiciliary of Origin of Full Time Undergraduate New
Entrants 2012/13
europe eu 95.6%
asia 2.1%
north america 2.0%
africa 0.2%
Monaghan 582 1% Cavan 641 2% Leitrim 291 1% Donegal 1,462 4%
Sligo 737 2% Mayo 1,373 6%
Roscommon 647 2%
Longford 394 1% Galway
2,515 6%
Westmeath 854 2%
Meath 1,606 4%
Louth 1,113 3%
Dublin 8,626 24% Wicklow 1,086 3% Kildare 1,737 4% Laois 594 2% Offaly 639 2% Clare
1,127 3%
Tipperary 1,513 4% Limerick 1,743 5% Kerry 1,478
4% Cork4,293 11%
Waterford 1,136 3%
Kilkenny 841
2% Wexford1,211 3% Carlow 465 1% Tyrone 15 0% Derry
13 0% Down 77 0%
Fermanagh 12 0%
Antrim 52 0% Armagh 11 0%
County of Origin for Irish Domiciled Full Time Undergraduate New Entrants
2012/13
Agriculture and Veterinary 2%
Combined 6%
Education 4% Engineering,
Manufacturing and Construction 11%
Health and Welfare 15%
Social Sciences, Business and Law 22%
Humanities and Arts 15%
Science, Mathematics and Computing 18%
Services 6%
IOT sector (43%)
University Sector (57%)
2007/08
IOT sector (46%)
University Sector (54%)
2012/13
Full Time Undergraduate New Enrtrant Gender trends 2007/08 – 2012/13
2007/08 2012/13
47%
53%
50%
50%
2012/13
UG Cert (L6) 2,593 UG Dip (L7) 208 UG Ord Deg (L7) 7,704 UG Hons Deg (L8) 29,981 UG Occasional 927
Age Distribution of all Full Time Undergraduate New
Entrants 2012/13 Full Time Undergraduate New Entrants bylevel 2012/13 Change in Full Time Undergraduate New
Entrants in the University and IOT sector 2007/08 – 2012/13
6% 34% 32% 9% 3% 2% 1% 2% 5% 7% 17 and under 2,296
18 14,011
19 13,457
20 3,716
21 1,375
22 720
23 445
24 774
25-29 1,912 30 and over 2,707
72% 19%
13 12
Universities 108,040
Total 202,504
6%
53%
41%
Colleges 11,856 Institutes of
Technology* 82,608
Universities 90,341
Total 164,498
6%
55%
40%
Colleges 9,118 Institutes of
Technology 65,039
Universities 16,834
Total 35,181
7%
48%
45%
Colleges 2,481 Institutes of
Technology 15,866
Universities 865
Total 2,825
9%
31%
60%
Colleges 257 Institutes of
Technology 1,703
FULL-TIME ENROLMENTS BY SECTOR 2012/13
PART-TIME ENROLMENTS BY SECTOR 2012/13
REMOTE ENROLMENTS BY SECTOR 2012/13
enrolments
ALL ENROLMENTS BY SECTOR 2012/13
*Excludes FETAC courses in Institutes of Technology
15 14
5 Year
change
14%
1 Year
change
+7% +4% +2% +1%
124,990 133,849139,092 141,226142,718
20 08 /0 9 20 09 /1 0 20 10 /1 1 20 11 /1 2 20 12 /1 3 Undergraduate trend
Undergraduate % of UG
Honours Bachelor Degrees 111,993 78% Ordinary Degrees 22,724 16% Diplomas, Certificates &
Occasional 8,001 6%
Undergraduate Total 142,718 100% Undergraduate by Programme Type 2012/13
Undergraduate 2007/08
50%
50%
46%
55%
Undergraduate 2012/13 71,008 71,710 54,681 65,117Undergraduate by Gender
Total 142,718 Total 119,798
Field of Study 2012/13 % 2007/08 %
General Programmes 227 0% 0% Education 5,186 4% 5% Humanities and Arts 21,466 15% 18% Social Science, Business and Law 33,290 23% 26% Science, Mathematics and Computing 24,403 17% 13% Engineering, Manufacturing and
Construction 16,071 11% 14% Agriculture and Veterinary 3,345 2% 2% Health and Welfare 25,271 18% 17% Services 7,438 5% 4% Combined 6,021 4% 0%
Total 142,718 100% 100%
Undergraduate by Discipline Undergraduate by Discipline and Sector 2012/13
5 Year
change
5%
1 Year
change
+8% -2% -1% +1%
20,700 20 08 /0 9 20 09 /1 0 20 10 /1 1 20 11 /1 2 20 12 /1 322,419 21,880 21,560 21,780
postgraduate trend Postgraduate by programme type 2012/13
Postgraduate % of PG
Ph. D. 6,953 32% Masters (Research) 1,110 5% Masters (Taught) 10,104 46% Diplomas, Certificates &
Occasional 3,613 17%
Postgraduate Total 21,780 100%
Postgraduate 2007/08
49%
51%
44%
56%
Postgraduate 2012/13 10,587 11,193 8,335 10,472Postgraduate by Gender
Total 21,780 Total 18,807
FULL TIME ENROLMENTS 2012/13
17 and under 19 0%
18 117 1%
19 207 1%
20 328 2%
21 1,129 5%
22 2,627 12%
23 2,608 12%
24 2,077 10%
25-29 6,388 29% 30 and over 6,277 29%
Unknown 3 0%
Total 21,780
17 and under 2,315 2% 18 15,936 11% 19 27,302 19% 20 28,027 20% 21 23,048 16%
22 13,122 9%
23 5,852 4%
24 3,889 3%
25-29 10,547 7% 30 and over 12,637 9% Unknown 43 0%
Total 142,718
Universities Colleges IoTs
64 (0%) 163 (0%) 1,657 (2%) 3,353 (42%) 176 (0%) 12,320 (17%) 2,256 (28%) 6,890 (11%) 17,668 (24%) 15,622 (25%) 13,618 (19%) 126 (2%) 10,659 (17%) 5,310 (7%) 23 (0%) 10,738 (17%) 1,894 (3%) 1,451 (2%) 13,637 (19%) 2,319 (29%) 9,315 (15%)
77 (0%) 7,361 (12%) 6,020 (8%) 1 (0%)
72,265 (100%)8,077 (100%) 62,376 (100%)
Postgraduate by Discipline Postgraduate by Discipline and Sector 2012/13
Field of Study 2012/13 % 2007/08 %
General Programmes 59 0% 0% Education 2,201 10% 12% Humanities and Arts 3,036 14% 16% Social Science, Business and Law 5,810 27% 27% Science, Mathematics and Computing 4,460 20% 21% Engineering, Manufacturing and
Construction 2,546 12% 9% Agriculture and Veterinary 274 1% 1% Health and Welfare 3,096 14% 12%
Services 205 1% 2%
Combined 93 0% 0%
Total 21,780 100% 100%
Universities Colleges IoTs
48 (0%) 11 (0%) 1,651 (9%) 439 (42%) 111 (4%) 2,363 (13%) 247 (24%) 426 (16%) 4,907 (27%) 903 (34%) 3,811 (21%) 649 (24%) 2,138 (12%) 408 (15%)
274 (2%)
2,670 (15%) 354 (34%) 72 (3%) 122 (1%) 83 (3%)
92 (1%) 1 (0%)
18,076 (100%) 1,041 (100%) 2,663 (100%)
UNDERGRADUATE POSTGRADUATE
UNDERGRADUATE BY AGE 2012/13
17 16
17 and under 0 0%
18 1 0%
19 2 0%
20 3 0%
21 39 0%
22 138 1%
23 235 1%
24 398 2%
25-29 2,666 12% 30 and over 10,536 48% Unknown 33 0%
Total 14,051
17 and under 139 0%
18 109 0%
19 263 0%
20 409 0%
21 488 0%
22 487 0%
23 529 0%
24 613 0%
25-29 3,594 3% 30 and over 14,426 10% Unknown 73 0%
Total 21,130
5 Year
change
3%
1 Year
change
-7% +1% +7% +2%
20,456
19,097 19,355 120,616 21,130
20 08 /0 9 20 09 /1 0 20 10 /1 1 20 11 /1 2 20 12 /1 3
Undergraduate trend Undergraduate by Programme Type 2012/13
Undergraduate 2007/08
52%
48%
45%
55%
Undergraduate 2012/13 10,891 10,239 9,673 11,781Undergraduate by Gender
Total 21,130 Total 21,454
Undergraduate by Discipline Undergraduate by Discipline and Sector 2012/13
5 Year
change
25%
1 Year
change
+14% 0% -1% +10%
11,242
12,801 12,860 12,785 14,051 20 08 /0 9 20 09 /1 0 20 10 /1 1 20 11 /1 2 20 12 /1 3
postgraduate trend Postgraduate by programme type 2012/13
Undergraduate % of UG
Honours Bachelor Degrees 5,509 26% Ordinary Degrees 230 1% Diplomas 5,598 26% Certificates 5,231 25% Occasional 2,697 13% Professional Training 1,865 9%
Undergraduate Total 21,130 100%
Postgraduate % of PG
Ph. D. 1,210 9% Masters (Research) 292 2% Masters (Taught) 7,189 51% Diplomas 3,307 24% Certificates 1,142 8% Occasional 587 4% Professional Training 324 2%
Postgraduate Total 14,051 100%
Field of Study 2012/13 % 2007/08 %
General Programmes 418 2% 3%
Education 900 4% 3%
Humanities and Arts 2,775 13% 13% Social Science, Business and Law 6,347 30% 34% Science, Mathematics and Computing 3,095 15% 7% Engineering, Manufacturing and
Construction 3,386 16% 17% Agriculture and Veterinary 29 0% 1% Health and Welfare 2,902 14% 13%
Services 1,238 6% 7%
Combined 40 0% 1%
Total 21,130 100% 100%
Field of Study 2012/13 % 2007/08 %
General Programmes 154 1% 1% Education 2,654 19% 17% Humanities and Arts 829 6% 6% Social Science, Business and Law 4,220 30% 28% Science, Mathematics and Computing 1,781 13% 11% Engineering, Manufacturing and
Construction 818 6% 8% Agriculture and Veterinary 108 1% 0% Health and Welfare 3,128 22% 26%
Services 251 2% 3%
Combined 108 1% 0%
Total 14,051 100% 100
Postgraduate by Discipline Postgraduate by Discipline and Sector 2012/13 postgraduate 2007/08
45%
55%
43%
57%
postgraduate 2012/13 6,319 7,732 4,758 6,215postgraduate by Gender
Total 14,051 Total 10,973
PART TIME ENROLMENTS 2012/13
UNDERGRADUATE POSTGRADUATEUNDERGRADUATE BY AGE 2012/13 POSTGRADUATE BY AGE 2012/13
Universities Colleges IoTs
304 (4%) 114 (1%) 517 (7%) 75 (10%) 308 (2%) 1,790 (24%) 376 (51%) 609 (5%) 2,267 (30%) 27 (4%) 4,053 (31%)
818 (11%) 2,277 (18%) 352 (5%) 46 (6%) 2,988 (23%) 14 (0%) 15 (0%) 1,250 (17%) 212 (29%) 1,440 (11%)
151 (2%) 1,087 (8%) 40 (1%)
7,503 (100%) 736 (100%) 12,891(100%)
Universities Colleges IoTs
67 (1%) 87 (3%) 1,627 (17%) 680 (39%) 347 (12%)
473 (5%) 224 (13%) 132 (4%) 3,143 (34%) 1,077 (36%) 1,077 (12%) 1 (0%) 703 (24%)
409 (4%) 409 (14%) 108 (1%)
2,159 (23%) 840 (48%) 129 (4%) 160 (2%) 91 (3%) 108 (1%)
19 18
Africa 265 0.2% 214 1.0%
Asia
3,678 2.6% 1,546 7.1% Ireland (including
Northern Ireland) 133,581 93.6% 17,755 81.5%
Europe non EU 104 0.1% 124 0.6% North America
2,808 2.0% 618 2.8%
Europe EU 2,098 1.5% 1,323 6.1%
Oceania 55 0.0% 25 0.1% South America
21 0.0% 50 0.2%
A Monaghan 1,980 1% Cavan 2,153 1% Leitrim 1,080 1% Donegal 4,720 3% Sligo 2,602 2% Mayo 4,946 3% Roscommon 2,361 2% Longford 1,278 1% Galway 9,852 7% Westmeath 2,968 2% Meath 5,664 4% Louth 3,900 3% Dublin 35,750 24% Wicklow 4,259 3% Kildare 6,384 4% Laois 2,071 1% Offaly 2,263 2% Clare 4,517 3% Tipperary 5,555 4% Limerick 7,129 5% Kerry 5,560
4% Cork18,623 12% Waterford 4,415 3% Kilkenny 3,199
2% Wexford4,450 3% Carlow 1,854 1% Tyrone 90 0% Derry
66 0% Down 208 0%
Fermanagh 43 0%
Antrim 166 0% Armagh 55 0%
Area Domiciliary undergraduate Domiciliary Postgraduate County Irish-domiciled Full-time Enrolments by County Monaghan 216 1% Cavan 281 1% Leitrim 183 1% Donegal 639 2% Sligo 429 1% Mayo 795 2% Roscommon 410 1% Longford 239 1% Galway 2,837 9% Westmeath 641 2% Meath 1,073 3% Louth 687 2% Dublin 9,725 30% Wicklow 982 3% Kildare 1,691 5% Laois 425 1% Offaly 381 1% Clare 667 2% Tipperary 791 2% Limerick 1,123 3% Kerry 681
2% Cork4,290 13% Waterford 930 3% Kilkenny 622
2% Wexford824 3% Carlow 470 1% Tyrone 41 0% Derry
27 0% Down 56 0%
Fermanagh 11 0%
Antrim 27 0% Armagh 33 0%
County
Irish-domiciled Part-time Enrolments by
County
FULL TIME ENROLMENTS BY DOMICILIARY OF ORIGIN 2012/13 ENROLMENTS BY COUNTY 2012/13
21 20
General Programmes Education Humanities and Arts Social Science, Business and Law Science, Mathematics and Computing Engineering, Manufacturing and Construction Agriculture and Veterinary Health and Welfare Services Combined
Postgraduate Certificate Postgraduate Diploma
Taught Masters Research Masters PhD
0 1,500 3,000 4,500 6,000
POSTGRADUATE QUALIFICATIONS AWARDED IN 2012 BY FIELD OF STUDY (ALL MODES)
General Programmes
Education Humanities and Arts
Social Science, Business and Law
Science, Mathematics
and Computing
Engineering, Manufacturing
and Construction
Agriculture and Veterinary
Health and Welfare
Services Combined 342
0.6%
4,893 8.1%
7,739 12.8%
18,049 29.8%
7,164 11.8%
7,273 12.0%
958 1.6%
9,865 16.3%
2,926
4.8% 1,437 2.4%
ALL LEVELS AWARDED IN 2012 BY FIELD OF STUDY (ALL MODES)
General Programmes Education Humanities and Arts Social Science, Business and Law Science, Mathematics and Computing Engineering, Manufacturing and Construction Agriculture and Veterinary Health and Welfare Services Combined
Undergraduate Certificate Undergraduate Diploma Ordinary Bachelor Degree Honours Bachelor Degree
0 3,500 7,000 10,500 14,000
UNDERGRADUATE QUALIFICATIONS AWARDED IN 2012 BY FIELD OF STUDY (ALL MODES)
HONOURS BACHELOR DEGREES AWARDED IN 2012 BY CLASS OF AWARD
30% 25% 20% 15% 10% 5% 0%
Agriculture and Veterinary +20%
General Programmes +55%
Education +12% Engineering,
Manufacturing and Construction +8%
Health and Welfare +20%
Social Science, Business and Law +3%
Humanities and Arts -13%
Science, Mathematics and Computing +15%
Services -9%
Total
+8%
GRADUATE TREND % CHANGE 2007 - 2012
First Class Honours
15%
Pass
7% 2.1
44%
Honours
Bachelor
Degree
Third Class Honours
2% Other
Honours 2%
2.2 30%
27
2,986
5,708
2,078
937
131
2,895
311
58
1,927 315
1,907
12,341
5,086
6,336
827
6,970
2,615
1,379
5,812
23 22
Age Male Female Total
21 22 17 39
22 141 153 294
23 273 240 513
24 362 318 680
25-29 1,694 1,617 3,311 30 and over 1,633 1,593 3,226
Grand Total 4,125 3,938 8,063
Age Male Female Total
22 1 1
23 3 1 4
24 5 3 8
25-29 73 70 143
30 and over 633 710 1,343
Unknown 2 1 3
Grand Total 716 786 1,502
University Sector
Institute of Technology
Sector Total Full-time 7,248 815 8,063
Masters Research (Postgraduate) 694 416 1,110 PhD (Postgraduate) 6,554 399 6,953
Part-time 1,298 204 1,502
Masters Research (Postgraduate) 203 89 292 PhD (Postgraduate) 1,095 115 1,210
Grand Total 8,546 1,019 9,565
22 (4%) 23 (6%) 24 (8%) 25-29 (41%) 30 and over (40%)
24 (1%) 25-29 (10%) 30 and over (89%)
Research Enrolments 2012/13 by Sector
Age Distribution of Part Time Research Enrolments 2012/13 As % of total
Full Time Research
Postgraduate 07/08 08/09 09/10 10/11 11/12 12/13
PhD 5,219 6,330 7,414 7,512 7,684 6,953 Masters Degree Research 2,531 2,206 1,715 1,457 1,190 1,110 Total Full Time 7,750 8,536 9,129 8,969 8,874 8,063
Part Time Research
Postgraduate 07/08 08/09 09/10 10/11 11/12 12/13
PhD 617 770 920 1,059 1,142 1,210 Masters Degree Research 629 429 450 370 351 292 Total Part Time 1,246 1,199 1,370 1,429 1,493 1,502
Full Time Research Postgraduate
Male Female Total
PhD 3,538 3,415 6,953 Masters Degree Research 587 523 1,110
Part Time Research Postgraduate
PhD 556 654 1,210
Masters Degree Research 160 132 292
Overall Total 4,841 4,724 9,565
Part Time Postgraduate Research Enrolment Trends 2007/08 to 2012/13
Research Enrolments 2012/13 by Gender
Full Time Postgraduate Research Enrolment Trends 2007/08 to 2012/13
Research Enrolments 2012/13 by Gender
Age Distribution of Full Time Research Enrolments 2012/13
PhD
Masters Degree Research
PhD
Masters Degree Research Overall Total
51%
53% 46% 55%
51% 49%
47% 45%
49%
54%
Female Male
Full Time Research Postgraduate
Part Time Research Postgraduate
PhD
Masters Degree Research
PhD
Masters Degree Research Overall Total
51%
53% 46% 55%
51% 49%
47% 45%
49%
54%
Female Male
Full Time Research Postgraduate
Part Time Research Postgraduate
As % of total
Change in Research Enrolments provision as a Proportion of FTE* L8-10 key 2008 2009 2010 2011 2012
University Sector
Overall Total Institute of
Technology Sector
PhD
Masters Degree Research
PhD
Masters Degree Research Overall Total
51%
53% 46% 55%
51% 49%
47% 45%
49%
54%
Female Male
Full Time Research Postgraduate
Part Time Research Postgraduate
13%
12%12% 12%12%
4%
3%
2% 3% 3%
8%
7%
6% 7% 7%
Graduates
Research
Staff
Finances
Enrolments
Participation
Full Time Research enrolment has declined from a 2009/10 peak. Part Time Research enrolment shows a year on year increase.
research
25 24
University Sector
Institute of Technology
Sector
Grand Total
University Sector
Institute of Technology
Sector
Grand Total
Education 253 6 259 3% 1% 3%
Humanities and Arts 1,202 117 1,319 17% 14% 16% Social Sciences, Business and
Law 1,044 113 1,157 14% 14% 14%
Science, Mathematics and
Computing 2,168 350 2,518 30% 43% 31% Engineering, Manufacturing and
Construction 978 184 1,162 13% 23% 14% Agriculture and Veterinary 193 0 193 3% 0% 2% Health and Welfare 1,279 19 1,298 18% 2% 16%
Services 58 26 84 1% 3% 1%
Combined 73 0 73 1% 0% 1%
Grand Total 7,248 815 8,063 100% 100% 100% University
Sector
Institute of Technology
Sector
Grand Total
University Sector
Institute of Technology
Sector
Grand Total
Education 267 1 268 21% 0% 18%
Humanities and Arts 142 34 176 11% 17% 12% Social Sciences, Business and
Law 317 51 368 24% 25% 25%
Science, Mathematics and
Computing 122 48 170 9% 24% 11%
Engineering, Manufacturing and
Construction 115 64 179 9% 31% 12% Agriculture and Veterinary 13 13 1% 0% 1% Health and Welfare 281 2 283 22% 1% 19%
Services 4 4 8 0% 2% 1%
Combined 37 37 3% 0% 2%
Grand Total 1,298 204 1,502 100% 100% 100%
Full Time Research Enrolments 2012/13 by Discipline and Sector
Part Time Research Enrolments 2012/13 by Discipline and Sector
Equal Access Survey
The Equal Access survey is a voluntary survey which collects information on the social, economic and ethnic background of new students who enter higher education for the first time. The survey commenced in 2007 and this annual collection is managed jointly by the National Access Office and the Statistics unit of the HEA. Equal Access data has been used:
• from 2010 onwards to advise the allocation of the Student Assistance Fund to each higher education institution for the support of students in financial need;
• since 2011 to implement the access element of the annual HEA recurrent grant allocation model for higher education institutions to support the provision of access and lifelong learning initiatives. It should be noted the figures in this section represent full-time new entrants to year 1 of Undergraduate Certificate & Diploma, Ordinary Bachelor Degree, and Honours Bachelor Degree programmes. The new entrant figures in other selected sections of this report also contain occasional figures which are excluded here. Data from the National College of Ireland (NCI) is included in this section. NCI are the only non-HEA-funded institution that participates in this important survey. Response rates to the Equal Access survey by institution are given in Appendix 2.
Graduates
Research
New Entrants
Staff
Finances
Enrolments
Participation
participation
27 26
New Entrants 2012/13
Response to Access survey
2012/13 %
% New Entrants who responded to socio-economic group questions
% New Entrants who responded to Ethnic Group questions Universities 21,262 90% 75% 84%
Institutes of Technology &
National College of Ireland 19,201 93% 49% 53%
Total 40,463 91% 63% 69%
Response rates by Sector & selected Equal Access Survey Question 2012/13
Socio-Economic Group of Respondents 2012/13 and 2011/12
% of new entrant respondents socio-economic group 2012/13 % of new entrant respondents socio-economic group 2011/12 25%
20%
15%
10%
5%
0%
Employers and Managers
Higher Professional
Lower Professional
Non manual Manual skilled
Semi skilled Unskilled Own account workers
Farmers Agricultural workers
All others gainfully occupied &
unknown
1
8
.0
%
1
8
.9
%
1
1
.3
%
1
1
.0
%
8
.7
%
9
.3
%
9
.3
%
9
.3
% 11
.3
%
1
1
.9
%
5
.4
%
5
.5
%
2
.5
%
2
.4
%
8
.0
%
8
.4
%
7
.6
%
7
.6
%
0
.8
%
0
.8
%
1
7
.1
%
1
5
.0
%
Socio-Economic Group by Sector 2012/13 and 2011/12
Soci-economic group Universities Institutes of Technology & National College of Ireland
2012/13 2011/12 2012/13 2011/12
Employers and Managers 20.1% 21.1% 14.5% 16.0%
Higher Professional 14.4% 15.1% 6.1% 5.5%
Lower Professional 9.9% 11.4% 6.5% 6.6%
Non-manual 9.4% 9.2% 9.3% 9.4%
Manual skilled 9.6% 9.5% 14.1% 15.1%
Semi-skilled 4.6% 4.5% 6.8% 6.8%
Unskilled 1.9% 1.6% 3.5% 3.3%
Own account workers 7.7% 7.7% 8.5% 9.2%
Farmers 7.8% 8.0% 7.2% 7.0%
Agricultural workers 0.7% 0.7% 1.0% 1.0%
All others gainfully occupied, and unknown 13.9% 11.1% 22.7% 20.1%
Type of disability % of respondents % of new entrants
Blindness, deafness, severe vision or hearing impairment 7.8% 0.5%
Physical Condition 9.4% 0.6%
Specific Learning Difficulty 46.9% 3.0%
Psychological/Emotional Condition 21.5% 1.4%
Other, incl Chronic Illness 23.8% 1.5%
Respondents with a disability 2012/13
% of total New Entrants with a disability 6.4%
% of total respondents to Equal Access survey with a disability 7.0%
% of New Entrants requiring support 2.4%
% of respondents with a disability requiring support 37.3%
Proportions of respondents with a disability 2012/13
Universities Institutes of Technology All Institutions
Irish 92.0% 88.0% 90.5%
Irish Traveller 0.1% 0.1% 0.1%
Any Other White Background 4.0% 7.0% 5.0%
African 0.9% 2.2% 1.3%
Any Other Black Background 0.1% 0.1% 0.1%
Chinese 0.5% 0.3% 0.4%
Any Other Asian Background 1.4% 1.3% 1.4%
Other 1.0% 1.0% 1.0%
Total 100.0% 100.0% 100.0%
29 28
Ethnic Group of Respondents 2012/13
2012/13 2011/12 Census 2011*
6%
5%
4%
3%
2%
1%
0%
Irish Traveller
Any Other White Background
African Any Other Black Background
Chinese Any Other Asian Background
Other
0
.1
%
0
.1
%
5
.0
%
1
.3
%
0
.1
% 0
.4
%
1
.4
%
1
.0
%
1
.2
%
4
.8
%
1
.4
%
0
.1
%
0
.5
%
1
.1
%
1
.0
%
6
.2
%
1
.3
%
0
.1
% 0.3%
1
.1
%
1
.0
%
* Census 2011 data taken from 15-19 year age group by ethnic group
Mature New Entrants
The following analysis outlines the trends in mature student participation in Irish higher education over recent years and presents a demographic profile of this group.
A mature new entrant is defined as a student who was 23 or over on the 1 January of the year of entry to the higher education institution.
In this analysis we have included new entrants for year one of Undergraduate Certificate, Diploma, Ordinary Bachelor Degree and Honours Bachelor Degree programmes.
Mature New Entrants Full-time
87%
13%
90%
10%
Non Mature New
Entrants Full-time Mature New Entrants PART-time
Non Mature New Entrants PART-time
PROPORTIONS OF MATURE AND NON-MATURE NEW ENTRANTS 2012/13
Full Time Part Time
Full-time Mature New Entrant as % of all Full-time New Entrants3 Part-time Mature New Entrants as % of all Part-Time New Entrants
100% 75% 50% 25% 0%
2007/08 2008/09 2009/10 2010/11 2011/12 2012/13 11%
83%
11% 87%
14% 90%
15% 92%
14% 88%
13% 90%
31 30
Full and Part Time Mature New Entrants as a % of all New Entrants by sector 2012/13
Universities Institutes of Technology
Universities Institutes of Technology
25%
20%
15%
10%
5%
0% 2007/08 2008/09 2009/10 2010/11 2011/12 2012/13
10% 12%
9% 13%
10% 17%
11% 20%
10% 18%
9% 18%
Trends in Full and Part-Time Mature New Entrants as a % of all New Entrants 2007/08 - 2012/13
Full-Time
100%
80%
60%
40%
20%
0%
Full-time Part-time Full-time Part-time 9%
95%
18%
85%
Universities Institutes of Technology
100%
75%
50%
25%
0% 2007/08 2008/09 2009/10 2010/11 2011/12 2012/13 90%
77%
93%
80%
94% 83%
94% 89%
96%
77%
95% 85%
Part-Time
Level 6
Proportions of Full and Part-Time Mature New Entrants by level and sector 2012/13
100%
75%
50%
25%
0%
95%
Level 7 82%
Level 8 8% 35%
21% 19%
UNIVERSITIES
INSTITUTES OF TECHNOLOGy
33 32 MATURE NON MATURE 30% 25% 20% 15% 10% 5% 0% Health and Welfare Social Sciences, Business and Law Humanities and Arts Engineering, Manufacturing and Construction Education Services 30% 12% Universities
DISCIPLINE OF FULL TIME MATURE NEW ENTRANTS BY SECTOR 2012/13
18% 23% 18%20% 13% 19% 10% 5% 7% 4%
1% 2% 1% 0% 10% 7% 0% 0% Science, Mathematics and Computing Combined Agriculture and Veterinary General Programmes MATURE NON MATURE 30% 25% 20% 15% 10% 5% 0% Health and Welfare Social Sciences, Business and Law Humanities and Arts Engineering, Manufacturing and Construction Education Services 19% 14%
Institutes of Technology
19% 24% 12% 10% 22% 19% 14% 16% 3% 0% 0% 2% Science, Mathematics and Computing Combined Agriculture and Veterinary General Programmes
0% 0% 0% 0%
11% 14% MATURE NON MATURE 40% 30% 20% 10% 0% Social Sciences, Business and Law General Programmes Humanities and Arts Engineering, Manufacturing and Construction Services 32% 27% Universities
DISCIPLINE OF PART TIME MATURE NEW ENTRANTS BY SECTOR 2012/13
Health and Welfare Science, Mathematics and Computing Education 14% 11% 13% 22% 12% 13% 9% 20% 9% 4% 7% 2% 5% 0% MATURE NON MATURE 60% 45% 30% 15% 0% Engineering, Manufacturing and Construction Services Social Sciences, Business and Law Humanities and Arts Education 27% 10%
Institutes of Technology
Health and Welfare Science, Mathematics and Computing General Programmes 23% 18% 17% 52% 16% 14% 12% 5% 5%
2% 0% 0% 0% 0%
35 34
GENDER OF MATURE NEW ENTRANTS BY SECTOR 2012/13
full-time
44% 56%
52%
48%
part-time universities
full-time
67% 33%
61% 39%
part-time Institutes of Technology
full-time
44% 56%
58% 42%
part-time All HEA institutions
GENDER OF FULL TIME MATURE NEW ENTRANTS BY SECTOR 2007/08 - 2012/13
AGE OF MATURE NEW ENTRANTS AS A % OF TOTAL MATURE NEW ENTRANTS 2012/13
16%
12%
8%
4%
0%
23 25 27 29 31 33 35 37 39 41 43 45 47 49 51 53 55 57 59 61 63 65 67 69 72 74 80 Full-time Mature New Entrants
Part-time Mature New Entrants 70%
60% 50% 40% 30% 20% 10% 0%
Institutes of Technology universities
49%
2007/08 2008/09 2009/10 2010/11 2011/12 2012/13 2007/08 2008/09 2009/10 2010/11 2011/12 2012/13
51% 55%
45% 58%
42% 61%
39% 62%
38% 61%
39% 40%
60%
45% 55%
50% 52%
48% 50% 50% 50% 50% 50%
MALE FEMALE
100%
75%
50%
25%
0%
23-25 26-28 29-31 32-34 35-37 38-40 41-43 44-46 47-49 50-52 53-55 56-58 59-61 62-64 65-67 68-70
Universities Institutes of Technology
100%
75%
50%
25%
0%
Universities Institutes of Technology
23-25 26-28 29-31 32-34 35-37 38-40 41-43 44-46 47-49 50-52 53-55 56-58 59-61 62-64 65-67 68-70 71+
AGE PROFILE OF MATURE NEW ENTRANTS 2012/13
full-time
37 36
Universities 108,040
Total
202,504
6%
53%
41%
Colleges 11,856 Institutes of
Technology 82,608
Africa 9.6% 14.8%
Asia 25.4% 50.0% Europe non EU 1.8% 0.0% North America
14.0% 1.9%
Europe EU 39.5% 29.6%
Oceania 1.8% 1.9% South America
0.9% 1.9%
Area Full-time Part-time
Domiciliary of Origin of Full and Part-Time Mature New Entrants 2012/13 by mode
Universities 108,040
Total
202,504
6%
53%
41%
Colleges 11,856 Institutes of
Technology 82,608
Africa 9.6% 14.8%
Asia 25.4% 50.0% Europe non EU 1.8% 0.0% North America
14.0% 1.9%
Europe EU 39.5% 29.6%
Oceania 1.8% 1.9% South America
0.9% 1.9%
Area Full-time Part-time
Universities 108,040
Total
202,504
6%
53%
41%
Colleges 11,856 Institutes of
Technology 82,608
Africa 5.0% 18.0%
Asia 35.0% 31.0% Europe non EU 0.0% 2.0% North America
20.0% 0.0%
Europe EU 38.0% 35.0%
Oceania 1.0% 2.0% South America
1.0% 1.0%
Area universities Institutes of Technology
Domiciliary of Origin of Full and Part-Time Mature New Entrants 2012/13 by sector
Universities 108,040
Total
202,504
6%
53%
41%
Colleges 11,856 Institutes of
Technology 82,608
Africa 5.0% 18.0%
Asia 35.0% 31.0% Europe non EU 0.0% 2.0% North America
20.0% 0.0%
Europe EU 38.0% 35.0%
Oceania 1.0% 2.0% South America
1.0% 1.0%
Area universities Institutes of Technology
ETHNIC GROUP FULL-TIME MATURE AND NON MATURE RESPONDENTS 2012/13
Ethnic Group Mature Non Mature
Irish 82.1% 91.7%
Irish Traveller 0.1% 0.1%
Any Other White Background 12.0% 4.2%
African 3.4% 1.1%
Any Other Black Background 0.3% 0.1%
Chinese 0.2% 0.5%
Any Other Asian Background 1.1% 1.4%
Other 0.9% 1.0%
Total 100.0% 100.0%
Equal Access Survey Data of Mature New Entrants
The Equal Access survey is administered to all new entrants in HEA institutions at registration every year. This section examines the responses of mature new entrants to questions in this survey. All data in this section refers to full-time mature new entrants to year 1 of Undergraduate Certificate, Diploma, Ordinary Bachelor Degree and Honours Bachelor Degree programmes.
Response rates to the Equal Access survey by institution for mature new entrants are given in Appendix 3.
39 38
TYPE OF DISABILITY FULL TIME MATURE AND NON MATURE RESPONDENTS 2012/13
Mature respondents Non mature respondents
392 2,158
Type of disability*
As % of total mature respondents with a
disability
As % of total non mature respondents with a
disability
Blindness, deafness, severe hearing or vision impairment* 9.4% 7.4%
Physical condition* 21.2% 7.3%
Specific learning difficulty* 19.4% 51.4%
Psychological/Emotional condition* 36.2% 19.1%
Other inc. chronic illness* 29.8% 23.0%
% of people with a disability indicating support required 26.8% 39.1%
* % refer to proportion of disabilities as some respondents indicated more than one disability
Type of disability*
No. of disabiltites for Mature Respondents As %
All Mature New Entrants
No. of disabiltites for Non Mature Respondents As % All
Non Mature New Entrants Blindness, deafness, severe vision or hearing impairment* 0.7% 0.5%
Physical Condition* 1.6% 0.5%
Specific Learning Difficulty* 1.5% 3.2%
Psych./Emotional Condition* 2.7% 1.2%
Other, incl Chronic Illness* 2.2% 1.4%
Respondents with a disability as % of all new entrants 7.5% 6.2%
Respondents with a disability as % of all respondents to
survey 8.5% 6.8%
Those indicating support required as % of all new entrants 2.0% 2.4%
TYPE OF DISABILITY FULL TIME MATURE AND NON MATURE RESPONDENTS AS A % OF ALL NEW ENTRANTS 2012/13
Socio-economic group Mature Non Mature
Employers and Managers 15.3% 22.1% Higher Professional 8.1% 14.1% Lower Professional 8.0% 10.6%
Non-manual 11.6% 11.2%
Manual skilled 20.9% 13.1%
Semi-skilled 9.6% 6.4%
Unskilled 5.9% 2.7%
Own account workers 11.4% 9.5%
Farmers 6.9% 9.4%
Agricultural workers 2.2% 0.9%
All New entrants 2012/13 Universities Institutes of Technology Total
Mature 1,809 3,419 5,228
Non Mature 19,453 15,297 34,750
% of New entrants responding to Equal access survey 2012/13
Mature 84% 91% 89%
Non Mature 91% 93% 92%
% of Respondents for whom a socio-economic classification was assigned (not including gainfully enployed)
Mature 46% 22% 30%
Non Mature 74% 46% 61%
RESPONSE RATES FULL TIME MATURE AND NON MATURE NEW ENTRANTS 2012/13
SOCIO-ECONOMIC GROUP OF FULL TIME MATURE AND NON MATURE RESPONDENTS FOR WHOM A CLASSIFICATION WAS ASSIGNED 2012/13
Socio-economic group Mature Universities Non Mature Universities
Mature Institutes of Technology
Non Mature Institutes of Technology
Employers and Managers 18.3% 23.6% 12.3% 19.2% Higher Professional 10.6% 17.1% 5.6% 8.1% Lower Professional 7.3% 11.7% 8.8% 8.4% Non-manual 11.7% 10.8% 11.6% 12.0% Manual skilled 18.8% 10.7% 23.0% 17.8% Semi-skilled 8.8% 5.2% 10.4% 8.7%
Unskilled 4.3% 2.1% 7.6% 4.1%
Own account workers 12.0% 8.8% 10.8% 10.9%
Farmers 6.1% 9.2% 7.6% 9.7%
Agricultural workers 2.1% 0.7% 2.3% 1.2%
41 40
9,057 1,895
8,280 3,406
Research and Specialist - Non
Academic
Research and Specialist
-Academic
Non Academic
Academic
2008 2012
Change 2008-2012
Change 2008-2012
Universities Academic 4,796 4,229 -12% -566 Non Academic 6,054 5,092 -16% -962 Research and Specialist - Academic 2,875 3,179 11% 304 Research and Specialist - Non Academic 455 1,312 188% 856
Total 14,180 13,812 -3% -368
Colleges Academic 445 399 -10% -45
Non Academic 362 337 -7% -25
Research and Specialist - Academic 37 2 -94% -35 Research and Specialist - Non Academic 5 12 129% 7
Total 849 751 -12% -99
Institutes of Technology
Academic 4,869 4,428 -9% -441
Non Academic 3,509 2,851 -19% -658 Research and Specialist - Academic
512 225 55% -288 Research and Specialist - Non Academic 571 571
Total 8,891 8,075 -9% -815
Total Academic 10,109 9,057 -10% -1,053 Non Academic 9,925 8,280 -17% -1,645 Research and Specialist - Academic
3,886 3,406 36% -480 Research and Specialist - Non Academic 1,895 1,895
Total 23,920 22,638 -5% -1,282
Graduates
Research
New Entrants
Staff
Finances
Enrolments
Participation
STAFFING STATISTICS
2008-2012 (DECEMBER FIGURES):
NUMBERS IN WHOLE-TIME
EQUIVALENTS (WTES)
2012 totals
staffing
Gender breakdown By sector Academic and non-academic 2012
age breakdown By sector Academic and non-academic 2012
PhD and Masters PhD Masters
Universities 100% 84% 15%
Colleges 97% 62% 35%
Institutes of Technology 85% 26% 59%
Overall 92% 55% 37%
staff qualifications by sector full-time academic staff 2012 academic
57% 43%
universities
non-academic
35%
65%
39%
61%
colleges
32%
68%
57%
43%
institutes of technology
41%
59%
academic non-academic academic non-academic
academic non-academic
37%
63%
total
57%
43%
TOTAL UNIVERSITIES COLLEGES INSTITUTES OF TECHNOLOGY
ACADEMIC
20-39 27% 32% 21% 23%
40-54 52% 50% 57% 54%
55 and above 21% 19% 22% 23%
Total 100% 100% 100% 100%
NON-ACADEMIC
20-39 32% 35% 25% 28%
40-54 43% 42% 44% 44%
55 and above 24% 22% 31% 27%
Total 100% 100% 100% 100%
TOTAL
20-39 30% 34% 23% 25%
40-54 48% 46% 51% 50%
55 and above 23% 21% 26% 25%
Total 100% 100% 100% 100%
42 43
Full-time Part-time Remote Total
Universities 90,341 16,834 865 108,040 Paying Non-EU fee 5,949 466 5 6,420
% 7% 3% 1% 6%
Colleges* 9,118 2,481 257 11,856
Paying Non-EU fee 1,428 29 0 1,457
% 16% 1% 0% 12%
Institutes of Technology 65,039 15,866 1,703 82,608 Paying Non-EU fee 1,937 86 0 2,023
% 3% 1% 0% 2%
Total 164,498 35,181 2,825 202,504 Paying Non-EU fee 9,314 581 5 9,900
% 6% 2% 0% 5%
ALL HEA INCOME AND EXPENDITURE (FIGURES IN €000) 2010/11*
*In RSCI 43% of students pay a non-EU fee. In the other colleges less than 1% pay a non-EU fee
Total Income €2,311,959 State Grants €779,397 Fees, of which: €900,394 Exchequer Fees €434,821 Non-Exchequer Fees €465,573 Research Grants & Contracts €452,532 Other Income €179,636 Total Expenditure €2,268,311 Core - Pay €1,354,520 Core - Non-Pay €466,754 Research Grants & Contracts - Pay €269,346 Research Grants & Contracts - Non-Pay €177,691 Exchequer/Non-Exchequer Fees Ratio 0.9 Pay/Non-Pay Expenditure Ratio (incl. Research) 2.5 Pay/Non-Pay Expenditure Ratio (excl. Research) 2.9
Graduates
Research
Staff
Finances
Enrolments
Participation
Finance
students paying non-eu fees 2012/13
*Figures exclude RCSI
Universities (€000)
Total Income €1,468,325 State Grants €378,330 Fees, of which: €606,624 Exchequer Fees €301,053 Non-Exchequer Fees €305,571 Research Grants & Contracts €372,209 Other Income €111,162 Total Expenditure €1,467,658 Core - Pay €786,633 Core - Non-Pay €308,813 Research Grants & Contracts - Pay €235,559 Research Grants & Contracts - Non-Pay €136,653 Exchequer/Non-Exchequer Fees Ratio 1.0 Pay/Non-Pay Expenditure Ratio (incl. Research) 2.3 Pay/Non-Pay Expenditure Ratio (excl. Research) 2.5
Colleges (€000) EXCLUDING RCSI
Total Income €94,836
State Grants €44,235 Fees, of which: €38,769 Exchequer Fees €23,693 Non-Exchequer Fees €15,076 Research Grants & Contracts €4,024 Other Income €7,808 Total Expenditure €76,841 Core - Pay €54,486 Core - Non-Pay €22,355 Research Grants & Contracts - Pay €0 Research Grants & Contracts - Non-Pay €0 Exchequer/Non-Exchequer Fees Ratio 1.6 Pay/Non-Pay Expenditure Ratio (incl. Research) 2.4 Pay/Non-Pay Expenditure Ratio (excl. Research) 2.4
Institutes of Technology (€000)
Total Income €748,798 State Grants €356,832 Fees, of which: €255,001 Exchequer Fees €110,075 Non-Exchequer Fees €144,926 Research Grants & Contracts €76,299 Other Income €60,666 Total Expenditure €723,812 Core - Pay €513,401 Core - Non-Pay €135,586 Research Grants & Contracts - Pay €33,787 Research Grants & Contracts - Non-Pay €41,038 Exchequer/Non-Exchequer Fees Ratio 0.8 Pay/Non-Pay Expenditure Ratio (incl. Research) 3.1 Pay/Non-Pay Expenditure Ratio (excl. Research) 3.8
45 44
The University Sector
University College Dublin University College Cork
National University of Ireland Galway National University of Ireland Maynooth Trinity College Dublin
University of Limerick Dublin City University
Mary Immaculate College Limerick Mater Dei Institute of Education St. Patrick’s College, Drumcondra National College of Art and Design St. Angela’s College, Sligo
Royal College of Surgeons in Ireland
The Institute of Technology Sector
Athlone Institute of Technology Institute of Technology Blanchardstown Cork Institute of Technology
Institute of Technology Carlow Dublin Institute of Technology
Dunlaoghaire Institute of Art, Design and Technology Dundalk Institute of Technology
Galway-Mayo Institute of Technology Limerick Institute of Technology Letterkenny Institute of Technology Institute of Technology Sligo Tralee Institute of Technology Institute of Technology Tallaght Waterford Institute of Technology
Other Institutions
National College of Ireland
Appendix 1: Institutions participating in the Student Records System (SRS) Appendix 2: Response Rates to the Equal Access Survey by Institution 2012/13 and 2011/12
Institution Response Rate as %
of all New Entrants 2012/13
Response Rate as % of all New Entrants 2011/12
Dublin Institute of Technology 100% 100% St. Angela's College, Sligo 100% 100% St. Patrick's College, Drumcondra 100% 100%
University of Limerick 100% 100%
National College Art & Design 99% 100% National College of Ireland 99% 100%
Waterford IT 98% 99%
IT Tralee 98% 100%
Trinity College Dublin 97% 90%
Cork IT 97% 97%
Mary Immaculate College, Limerick 96% 77%
Athlone IT 95% 100%
Dun Laoghaire IADT 95% 93%
University College Dublin 94% 94%
NUI Maynooth 94% 98%
University College Cork 93% 94%
IT Tallaght 93% 96%
Dundalk IT 92% 93%
Letterkenny IT 90% 91%
Mater Dei Institute, Dublin 90% 92%
IT Sligo 89% 100%
Limerick IT 89% 91%
NUI Galway 86% 42%
IT Blanchardstown 82% 82%
IT Carlow 81% 75%
Galway-Mayo IT 80% 100%
Dublin City University 57% 98%
47 46
Institution Response Rate 2012/13
Dublin Institute of Technology 100%
Dun Laoghaire IADT 100%
National College of Art and Design 100%
St. Angelas College Sligo 100%
St. Patricks College Drumcondra 100%
University of Limerick 100%
IT Tralee 98%
Letterkenny IT 98%
Waterford IT 98%
Athlone IT 96%
IT Tallaght 96%
Trinity College Dublin 93%
Dundalk IT 91%
IT Sligo 90%
University College Cork 90%
Limerick IT 87%
IT Blanchardstown 86%
NUI Maynooth 84%
NUI Galway 82%
Galway-Mayo IT 81%
IT Carlow 81%
Mater Dei Institute Dublin 80%
Cork IT 79%
University College Dublin 78%
Mary Immaculate College, Limerick 67%
Dublin City University 56%
Total Institution Response Rate 89%