Distributed Multi-User Urban Simulation
Clodagh Rossi
A dissertation submitted to the University of Dublin,
in partial fulfilment of the requirements for the degree of
Master of Science in Computer Science
Declaration
I declare that the work described in this dissertation is, except where
otherwise stated, entirely my own work and has not been submitted as an
exercise for a degree at this or any other university.
___________________
Clodagh Rossi
14
thSeptember 2001
Permission to lend and/or copy
I agree that Trinity College Library may lend or copy this dissertation
upon request.
___________________
Acknowledgements
Abstract
The objective of the research project is the importation, representation and 3D navigation of a large-scale city model. The model will be the backbone for the construction of the proposed Virtual Dublin project.
The research & design carried out was aimed to identify issues in distributed multi-user Virtual Environments (VE).
A simulation was created which demonstrates the many benefits of the proposed architecture including the following
• 3D Rendering: Level of Detail its importance and benefits towards acceptable response times
• Distributed Database: Provides polygonal mesh data and removes the need for replicated data.
• A Multi-tasking Environment: Allows for the required multi-user activities
• Dead Reckoning: Reduces the network traffic required contributing towards quicker response times and more up to date rendering.
Contents
Table of Figures ...vii
1: Introduction...1
1.1 Background to Virtual Environments ...1
1.1.1 Virtual Cities...1
1.1.2 NPSNET...3
1.1.3 The Walkthrough Project ...5
1.1.4 Virtual Bath ...6
1.2 Project Goals ...8
1.3 Overview ...8
2: Research...9
2.1 Dead Reckoning ...9
2.1.1 Introduction ...9
2.1.2 Dead Reckoning Algorithms ...11
Case 1: ...11
Case 2: ...12
Case 3: ...12
2.2 Distributed Multi-User Virtual Environments ...14
2.2.1 Design Issues for Distributed Systems...14
2.2.2 Architectural Consideration...16
2.2.3 Central Server Models...19
2.2.4 Design Issues for Virtual Environments ...20
2.3 Polygonal Meshes...22
2.3.1 Processing Polygonal Meshes ...22
2.3.2 Polygonal Model Simplification...22
2.3.2.1 Levels of Detail...23
3: Analysis & Design...25
3.1 Camera Design ...25
3.1.1 Positioning and Pointing the Camera ...26
3.1.2 Building the Camera into the Program...27
3.2 Polygonal Mesh ...28
3.3 Server Design ...29
3.3.1 Main Thread: Display Graphics and Handle User I/O...30
3.3.2 Listening Thread ...32
3.3.3 Client Thread 1 ...32
3.3.4 Client Thread 2 ...32
3.4 Client Design...32
3.4.1 Main Thread ...33
3.4.2 Sending Thread ...34
3.4.3 Receiving Thread ...34
3.5 Dead Reckoning Algorithm ...34
4: Implementation ...37
4.1 MSQL Mesh Database ...37
4.2 Camera ...39
4.3 MSQLDB ...41
4.4 Thread ...42
4.5 Threed ...42
4.6.2 Client Specific Routines. ...44
5: Evaluation & Future Work ...45
5.1 Server Responsibilities...45
5.2 Graphics ...46
5.3 Mesh Data & Textures ...48
5.4 Dead Reckoning ...50
Table of Figures
Fig 1.1: Screen Shot of Virtual Tokyo 3
Fig 1.2: NPSNET History 4
Fig 1.3: Screen Shot of Virtual Bath 7
Fig 2.1: Dead Reckoning Level of Threshold 13
Fig 2.2: Point to Point Communication 17
Fig 2.3: Broadcast Communication 17
Fig 2.4: Multicast Communication 18
Fig 3.1: Camera Overview 25
Fig 3.2: Camera Orientation 27
Fig 3.3: Turning the camera to the right or left 28
Fig3.4: Polygonal Mesh Overview 29
Fig 3.5: Server Activities 30
Fig 3.6: Display Sectors 31
Fig 3.7: Client Activities 33
Fig 5.1: Time Effects from Rendering 46
1: Introduction
Virtual environments are used in many applications - Architecture, Mechanical Design, Scientific Visualisation, Military Simulations, Training, and Healthcare etc. For each of these applications, virtual environments have to be designed and implemented in a business-like manner [Duke 01].
This project aims to analyse and discuss all -important issues involved in the development of these virtual environments and design and implement a 3D navigation of an urban simulation.
1.1 Background to Virtual Environments
1.1.1 Virtual Cities
The increasing popularity and emergence of affordable virtual reality on the World-Wide Web has lead to an ever-rising interest in ‘Virtual Cities’. These interactive simulations have numerous potential uses in aiding the planning and managing of cities as people can explore and interact with the city on screen. [Dodge, Smith & Doyle 1997b] state that there are important distinctions in the type of virtual cities currently on the Web and have devised a four-fold classification.
2. "Flat" Virtual Cities: These use "flat" image maps of buildings and street as an static interface. A typical example is [Virtual Bologna].
3. Three-dimensional Virtual Cities: These use Web-based Virtual Reality (VR) technologies to model the built form of cities, to varying degrees of accuracy and realism. These cities are usually navigable in the sense that the user can walk around and fly through the scene. Buildings are represented as 3D polygons with textures to add realism. Virtual Reality Modelling Language (VRML) is often used to create such sites, although they are seldom compiled using accurate base map data as a foundation and generally only cover small part of the city.
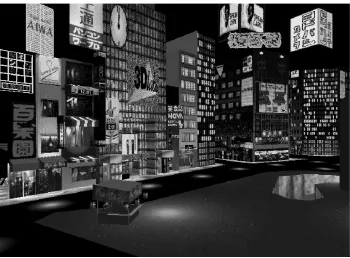
4. "True" Virtual Cities are ones, which are an effective digital equivalent of real cities, providing people with a genuine sense of walking around an urban place. To fulfil this demanding criterion a true virtual city must have a sufficiently realistic built form interface, a rich diversity of services, functions and information content, and crucially, the ability to support social interaction with other people.
Fig 1.1: Screen Shot of Virtual Tokyo
When developing virtual reality walkthroughs like Virtual Tokyo, real time generation of realistic looking images is essential [Isler et. Al. 96]. A “simple” city is not very realistic and/or does not operate in real-time, examples of these would be Type 1 and 2 defined by [Dodge et.al.].
1.1.2 NPSNET
Fig1.2: NPSNET History
[Pratt 93] discusses some of the major challenges and issues that were dealt with during the development of NPSNET and makes reference to how the issues are not limited to NPSNET, or just workstation based simulation systems, but across the entire Virtual World (VW) development platforms. These issues are summarised below:
• Cost Reduction: Using commercially available workstations
reduces the overall development cost both by enabling re-use of the workstation for other purposes when not being used in the simulation exercise and sharing the cost over many host users.
• World Construction and Maintenance: The run-time world
database must be flexible, expandable and rapidly accessed.
Evolution of NPSNET Networking
DIS Protocol, IP
MultiCAST Object-Oriented For Large Scale Simulations
NPSNET IV
NPSNET-DI
NPSNET II NPSSTEALTH
NPSNET I Local Protocol
Distributed LAN
• World Population: There is not always enough resources for
every simulated vehicle to be controlled by a human and to alleviate this problem scripted vehicles are used.
• Realistic Icon Interaction: Users tend to focus on objects that
are missing or incorrect than on objects that are correct i.e. all physical entities behave according to certain rules and users expect those rules to be followed.
• Machine Limitations: To reach an acceptable frame rate in a
system the graphics subsystem, the network and processor components must all be enhanced.
• Human Computer Interaction: Information must be
presented to the user in a way that they feel immersed in the simulation.
1.1.3 The Walkthrough Project
The overall goal of the [Walkthrough Project] is to create interactive graphics systems that enable a viewer to experience an architectural model by simulating a walk through of the model. The project considers the following areas as the most important areas for research and enhancement in their simulations.
• Faster Display: This involves looking at the use of
Hierarchical Levels of Detail where fidelity based level of detail creates lower complexity representations of objects and renders these simpler versions when the user cant discern the difference.
• Interaction: Collision detection and proximity queries with
large models are used for evaluation of maintenance and operation requirements.
• Prettier Models: Better lighting, photo- and procedural
• Real Application and Model Building: Models of real or
proposed structures are used in walkthroughs by the client, architect and interior designer to evaluate remodelling options.
• Handier Interface: Investigations are being carried out into
how people navigate and perform spatial problems in virtual environments.
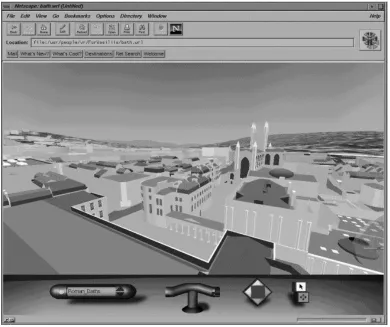
1.1.4 Virtual Bath
In 1991 the Centre for Advanced Studies in Architecture, University of Bath, constructed a 3D computer model of the city of Bath [Smith et. al]. The model was constructed using aerial photographs using photogrammetry [Bourdakis et al., 1997]. Bath City Council supported the project and since its completion the model has been used by the city planners to test the visual impact of a number of proposed developments in the city. The model was developed as separate units based on city blocks with each unit being modelled in a PC based CAD package.
Levels of Detail (LOD) are used in rendering to help improve the frame rate i.e. the further an object is from the camera the less need for detail there is and less time spent on rendering.
Bourdakis describes the four levels of detail used in Virtual Bath.
• Level 1: A simple volumetric description of each terrace with
a flat roof at the average height for that terrace. Roads, pavements and landscape areas are also added in.
• Level 2: Each building is modelled with accurate wall and roof
address of the property is directly accessible. Trees that are within the urban block are also switched on (as billboards). Typically Level 2 switches on at approximately 150 metres from the camera.
• Level 3: Windows, doors, parapets, party walls and
freestanding garden walls are added. Level 3 typically switches on at 90 metres.
• Level 4: Architectural detail such as chimney pots, string
courses and pilasters are added. At this level some photographic texture maps are also included for windows and shop fronts. The Level 3 structure is kept; Level 4 switches on at approximately 60 metres.
[image:14.595.161.551.341.668.2]
1.2 Project Goals
This project involves the importation, representation and 3D navigation of a large-scale city model. The model will be the backbone for the successful construction of the proposed Virtual Dublin project. This project looks at ways of representing the data in a format suitable for 3D rendering using OpenGL, and then providing a 3D interface, which allows multiple users to navigate the city in real-time. The large-scale size of the finished model will require a distributed database and the effects of this such as timely loading of visible regions is investigated. Level of Detail control is also an important factor. The ultimate goal will be to integrate this project with other projects in the large-scale sentient traffic management project, with the final aim being a large-scale simulation where autonomous vehicles will drive safely around Dublin.
1.3 Overview
2: Research
2.1 Dead Reckoning
2.1.1 Introduction
In the construction of networked virtual environments there are three primary aims [Crowley99].
• Response times (latency) must be kept to a minimum.
• Network bandwidth usage must be minimised.
• Consistency must be maintained between all nodes.
To obtain consistency entities send their current relevant details e.g. the position they are currently at, their direction and speed, to other entities in the system. Every time an entity updates its criteria it must send the update to the other members of the system.
appear to ‘jump’ over screens instead of moving in a continuous steady path.
To reduce the number of connections and the number of messages being sent, the dead reckoning technique may be employed [Gossweiler et. al]. Dead Reckoning is a form of replicated computing in that everyone participating in a multi-user system winds up simulating all the entities in the environment, a predefined set of algorithms are used by all entity nodes to extrapolate the behaviour of entities in the game, and an agreement on how far reality should be allowed to get from these extrapolation algorithms before a correction is issued [Aronson97].
When an entity is created the computer that owns the entity sends out information about itself. The packet of data contains information to describe the current state of the entity for example, a unique identifier for the entity, its position, velocity, acceleration and orientation. Upon receipt of the first entity state packet each node on the net begins moving the entity using the dead reckoning algorithm. This entities position calculation, based on last known velocity, is called dead reckoning. As long as the entity continues to move in a predictable fashion, it appears in a consistent, synchronized way on all nodes on the net with no further network traffic required.
2.1.2 Dead Reckoning Algorithms
Case 1:
Dead reckoning is at the heart of popular simulation mechanisms, such as DIS (the Distributed Interactive Simulation protocol)[IEEE93], and is used in SIMNET [Pope89] and NPSNET [Macedonia95].
In both SIMNET and DIS no central computer is used for event scheduling and each host is autonomous, maintaining its own state. A broadcast communication model is used in conjunction with a homogeneous world database. Entities interact through a series of events. Entities are autonomous and all events are broadcast and are available to all interested entities. An entity initiating an event does not calculate which other entities might be interested or how the receiving entities can be affected by it and each entity transmits the absolute truth about its state. This state is commonly referred to as ‘ground truth’ information. The receiving entities are responsible for transforming the ground-truth information to model the real world. A host in the SIMNET and DIS model can only know what it is told. A constant update of position would consume a lot of network bandwidth so a dead reckoning algorithm is used.
“receive thread”. This allows the graphics display rate to be maintained while data is read/written in separate lightweight processes [O’Connell97].
Case 2:
The following algorithm is proposed in [Aronson97] where the entities position, velocity and acceleration are used to extrapolate the entity forward from its initial position at time t0. The first algorithm maintains an entity at the position specified in the entity’s state from t0. The second algorithm extrapolates the entity forward from its known t0 position based on its velocity at t0. The third algorithm also extrapolates forward from the entity’s last known position, but uses both velocity and acceleration in the extrapolation.
Position t1 = Position t0 (#1)
Position t1 = Position t0 + v r(t1 –t0) (#2)
Position t1 = Position t0 + v r(t1 –t0)+ 1/2a r(t1-t0)(#3)
Case 3:
The following extrapolation equations are provided. One-step formulas use the last state update packet to extrapolate an entity’s position, whereas multi-step formulas use the last two or more state update packets in the extrapolation.
One-Step Two-Step
1stOrder xt = xt’ + t’T xt = xt’ + (xt’- xt’’)/(t’ – t’’) T
2ndOrder xt = xt’ + vt’ T + 0.5at’ T 2 xt = xt’ + vt’ T + 0.5(vt’- vt’’)/(t’ – t’’) T 2
xt’ = position , vt’ = velocity , at’ = acceleration,
T = time elapse from the last update, t = t’ + T
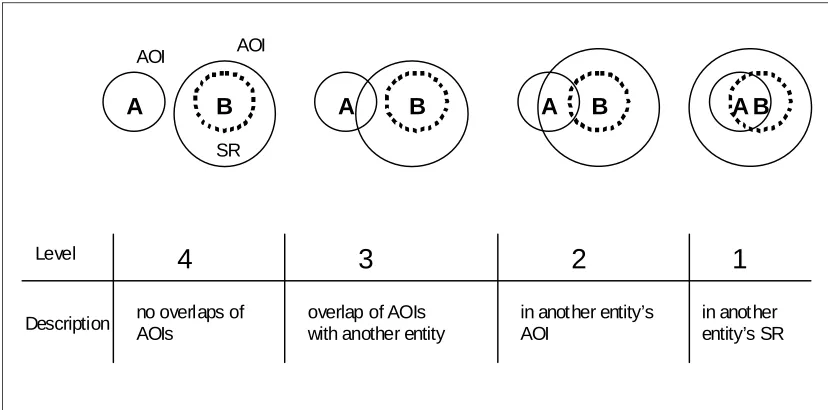
The adaptive multi-level threshold uses relevance filtering to determine the levels of threshold. The Area of Interest (AOI) of an entity is defined as a circle with a constant radius around the entity, the length of which is defined according to the entity type. Also used is the Sensitive Region (SI), if one entity moves into another entity’s SR, a
collision is likely to happen. The following diagrams show how both the AOI and SR are used to determine the level of threshold.
B A
AOI
SR AOI
A B A B A B
Level
Description no overlaps of AOIs overlap of AOIs with another entity in another entity’s AOI in another entity’s SR
[image:20.595.161.575.521.726.2]4
3
2
1
In all cases extrapolation of A needs to be accurate though the degree of accuracy required is different. For example in level 1 A is in entity B’s SR and to prevent entity B from making misjudgement on collision entity A’s update packet will be emitted most frequently, but its extrapolation will be the most accurate.
Level 2 is where A is outside B’s SR but within its AOI, to avoid missing the detection of an approaching entity, entity B needs to have a more accurate position of entity A. However there is no danger of a misjudgement on collision so a small threshold will be adequate in entity A’s extrapolation.
Level 3 is where A is outside B’s AOI since the two AOIs are overlapped one entity may move to another’s AOI in a short period of time. Extrapolation of A’s position still needs to be accurate but the requirement is less rigid. As A is not in B’s AOI its update packets do not need to be sent frequently. So a large threshold can be used in A’s extrapolation.
2.2 Distributed Multi-User Virtual Environments
2.2.1 Design Issues for Distributed Systems
According to [Tan95] when designing Distributed Systems the following key issues must be taken into consideration:
2.2.1.1 Transparency
• Location Transparency: The users cannot tell where resources are located.
• Migration Transparency: Resources can move at will without changing their names.
• Replication Transparency: The user cannot tell how many copies exist.
• Concurrency Transparency: Multiple users can share resources automatically
• Parallelism transparency: Activities can happen in parallel without users knowing.
2.2.1.2 Flexibility
It is important that the system is flexible so the design decisions, which now seem reasonable and later may prove, to be wrong can be easily changed.
2.2.1.3 Reliability
The original goal of building distributed systems was to make them more reliable than single-processor systems.
2.2.1.4 Performance
When running an application on a distributed system, it should not be appreciably worse than running the same application on a single processor.
2.2.1.5 Scalability
magnitude larger, and solutions that work well for 200 machines will fail miserable for larger numbers of machines.
Data distribution policies affect not only network performances but also consistency, reliability, and scalability. According to [Crowley99] there are two main challenges to be considered when designing a distributed system, Consistency and Latency.
• Consistency: Each users world must correspond closely to all other users. In some cases, lack of consistency may be tolerated as long as the user cannot perceive this and does not affect the future subjective consistency of the world. All objects within each user’s world-view must correspond with those of the whole.
• Latency: The system must respond without perpetual delay to both the user’s actions and to other users’ or entities’ actions.
2.2.2 Architectural Consideration
When designing distributed systems for Virtual Environments (VE) there two main points that need to be addressed [OConnell97], the communication model to be adopted, and the approaches for distributing the system.
2.2.2.1 Communication Models:
The communication techniques adopted by multi-user VW fall into three categories, point-to-point, broadcast, and multicast
Point-to-Point: One connection for each host is established
communication is scaled, as it requires n2 messages, where n is the number of hosts in the network.
Fig 2.2: Point to Point Communication
Broadcast This communication protocol allows each host on
the network to send a single message that is received by all other hosts in the system. Kahani and Beadle state how the data is sent so everyone regardless if they need it or not.
Fig 2.3: Broadcast Communicatio n
Multicasting This involves in hosts joining multicast groups.
Data is sent to one or more multicast addresses and if a host is part of the multicast address it will receive the data. Multicasting is seen as method for improving efficiency compared to Broadcasting where data is sent so everyone in LAN regardless if they need it or not [KahaniBeadle].
A
B
C
D
A
Fig 2.4: Multicast Communication
2.2.2.4 Distribution Schemes:
All distributed VEs share the problem of where to keep the VE database on the network and how to represent it.
• Replicated Database: Each host maintains a full copy of the
world database. Each host is responsible for the maintenance and upkeep of its internal database and reflect any changes made. The originator of any change to the database must send a message to the other hosts on the network informing them of the change. This distribution model is typically associated with a broadcast communication model, whereby when the state of an entity on a host changes, the host broadcasts that change to all of the other hosts on the network.
• Centralised Database: A single server host is responsible for
communicating with each of the clients to determine and report the current state of the system. The server maintains the database while the clients handle computation and rendering and present the users with a view of the VE.
A
• Partitioned Database: The database is partitioned among
clients and a server is used to communicate the database between the relevant clients.
• Shared Distributed Databases: Basically a shared memory
system, where each new entity which is created or modified is distributed through the shared memory model.
2.2.3 Central Server Models
In Central Server Models clients communicate with a central server, which manages the entire system and informs clients of any updates and changes in object states. Clients only communicate with the server, which contains the entire database and tracks all objects of interest within the system [Crowley99]. The server processes all input from each client, and dispatches the changes in the environment to each user. All clients perform graphics and other user I/O e.g. traversing the system.
Centralised systems have the following benefits when used in a small-scale distributed multi-user environment
o There is one definite point of reference for the VW.
o The server is aware of the entire state of the VW at any point in time, and can always update a participant client with the state of an object or other clients.
o Database housekeeping are easier to maintain
[Looman00] takes the following factors into consideration when designing both the client and server nodes for a Central Server system:
• Clients have three distinct activities:
o Sending data to or reading data from the server
o Terminating the connection.
• Servers activities include:
o Handle communications with existing clients
o Process console commands
o Accept new client connections fast enough so the client doesn’t timeout.
According to Looman the only real way to solve the problem of catering for these multiple activities is to dedicate one thread to handling the console in the main thread, allocate another thread for processing new client connections, and spawn new threads to manage communications with each connected client. This is the method that has been adopted in this dissertation; more detail of the design can be seen in the Analysis and Design Chapter.
2.2.4 Design Issues for Virtual Environments
[Diaz et.al] describe the three fundamental elements that exist in VEs and issues that are associated with them.
1. Contexts: A context defines a set of circumstances and describes the purpose of these. A VE is defined as a set of connected contexts. Contexts are connected by links, which allow users to navigate among contexts. From the visualization point of view, each context could be represented by a street metaphor and navigation could mean to walk down the street.
o Deterministic Behaviour: These are where the static entities never change during the simulation e.g. mountains or buildings. Certain animated entities change but their states are predictable and can be determined e.g. clock hands.
o Non-deterministic Entities: These are intelligent entities that are complex and can’t be predicted e.g. humans.
3. Users and Groups: There is need to model the user profile with all of their abilities, history and preferences in the system and all activities that the user can do:
o To activate an object that carries out some activity
o To collect objects
o To move objects from one place to another, this could imply to move the object inside or outside the current context
o To possess objects i.e. only its owner can handle the objects
2.3 Polygonal Meshes
Polygonal meshes currently dominate the field of interactive three-dimensional computer graphics due to their mathematical simplicity that allows fast rendering of polygonal data sets [Chasan].
2.3.1 Processing Polygonal Meshes
[Kobbelt, Kahler et al. 00] outline the main areas involved in gathering data and processing it into polygonal mesh format.
Data Acquisition: The first task is to retrieve the relevant
properties of the object i.e. gather its geometry, surface texture, volumetric density information etc.
Mesh Generation: This step taking the data retrieved in the
first step and generates a single surface representation i.e. a triangle mesh.
Mesh Decimation: Reduces the complexity of a given input
mesh by removal of detail information i.e. vertices and triangles.
Subdivision Surfaces: Provide a uniform and efficient way to
describe smooth curves and surfaces.
Remeshing: This involves applying a regular refinement
operator to a coarse triangle mesh so that every submesh corresponds to one base triangle i.e. each submesh has the structure of a regular grid.
2.3.2 Polygonal Model Simplification
quoted by [Aliaga et. Al. 98] who state that the ideal algorithmic approach is: Do not even attempt to render any geometry that the user will not ultimately see.
2.3.2.1 Levels of Detail
The aim of polygonal simplification, when used for levels of detail (LOD) generation, is to remove primitives from an original mesh in order to produce simpler models, which retain the important visual characteristics of the original object [Krus et. Al]. According to [Krus et. Al.], in order to maintain a constant frame rate, the key is to find a good balance between the richness of the models and the time it takes to display them. The following are characteristics that need to be considered in the simplification algorithm being used:
LOD Continuum: Successive LODs will differ by the number of polygons they have so that switching from one to the other is usually noticeable by the observer i.e. popping effect. This popping effect needs to be minimised.
Shape Preservation: The simplification must keep the general shape and characteristics, which make the object easily identifiable, are preserved. Thus the algorithms have to look for the following distinct features:
o Inspecting the normals of adjacent polygons can identify Planar Area. These polygons can be merged
to form bigger ones.
o Sharp Edges should be preserved and can be simplified
by merging connected edges, which are nearly collinear.
o Pointed Edges must be preserved since they have many
Measure of the Approximation Error: To control simplification the approximation error should be measured locally.
User Specification of the Amount of Simplification: Most algorithms allow the user to specify the limit to the amount of simplification in terms of upper bound for the local approximation error.
Topology Preservation: Algorithms may have a choice of simplifying the topology but the result is rarely usable as the differences with the original object is too noticeable.
3: Analysis & Design
3.1 Camera Design
All hosts require fine control over camera movements due to the need to forward their details to other hosts. OpenGL provides simple camera commands, however in order to know the cameras co-ordinates it is necessary to create the programs own camera where, after each change to the camera is made it “tells” OpenGL the new camera position.
The following diagram shows the general form of a camera. It has an eye positioned at some point in space, and its view volume is a portion of a rectangular pyramid, whose apex is at the eye. The opening of the pyramid is set by the view angle θ. Two planes are defined perpendicular to the axis of the pyramid: the near plane and the far plane. Where these planes intersect the pyramid, they form rectangular windows. The windows have a certain aspect ratio, which can be set in a program.
near plane
far plane
y
z
x
F P’ P eye
OpenGL clips off any parts of the scene that lie outside the view volume. Points inside the view volume are projected onto the view plane to a corresponding point P′. With a perspective projection, the point P′ is determined by finding where a line from the eye to P intersects the view plane. Finally the image formed on the view plane is mapped into the view port.
3.1.1 Positioning and Pointing the Camera
In order to obtain the desired view of a scene, the camera is moved away from its default position and aimed in a particular direction. This is done by performing a rotation and translation which, become part of what is called the modelview matrix.
The modelview matrix combines two effects: the sequence of modelling transformations applied to objects and the transformation that orients and positions the camera in space.
To help camera position and orientation an explicit coordinate system is attached to the camera, which helps describe transformations to the camera. The coordinate system has its origin at the eye and has three axes u, v and n that define its orientation. The axes are pointed in directions given by the vectors u, v and n.
Fig3.2: Camera Orientation
3.1.2 Building the Camera into the Program
The Camera class contains fields for the eye and the directions u, v and n. It also has fields that describe the shape of the view volume: viewAngle, aspect, nearDist, and farDist. A utility routine setModelViewMatrix() communicates the modelview matrix to OpenGL. It is called after each change is made to the camera’s position or orientation.
3.1.2.1 Sliding the Camera
Sliding the camera means to move it along one of its own axes without rotating it i.e. in the u, v, or n direction. Since the camera is looking along the negative n-axis movement along n is “forward” or “back”, u is “left” or “right” and v is “up” or “down”. This is done using the equation :
eye = eye + Du
D is the distance to move and in this particular example the client is moved along the u-axis.
y
x
z u
v
3.1.2.2 Rotating the Camera
Rotating the camera means to rotate it about the v-axis, which means both u and n must be rotated.
∝
Fig3.3: Turning the camera to the right or left
Two new axes u′ and n′ are formed which lie in the same plane as u and n but have been rotated through the angle ∝ radians. Both u′ and n′ are formed as the appropriate linear combination of u and n:
u′ = cos(∝)u + sin(∝)n n′ = -sin(∝)u + cos(∝)n
The new axes u′ and n′ then replace u and n in the camera.
3.2 Polygonal Mesh
Polylines are a connected sequence of straight lines that don’t form a closed figure but if the first and last points are connected by an edge the polyline is a polygon.
Polygonal meshes are a collection of polygons that are given by a sequence of vertices. Each vertex has a normal vector associated with it. The normal vector provides directional information about the way a polygon is facing and is used in the shading process and determines how light is reflected off the surface of the polygon. To create a realistic 3D view of a scene textures are mapped onto the polygons.
u‘
u v
The following diagram gives an overview of a basic polygonal mesh. It highlights the eight vertices that make up the corners of the block, these vertices make up ‘triangles’, which form the skin of the block and enable the texture to be mapped to the block giving it the appearance of a building.
Fig3.4: Polygonal Mesh Overview
3.3 Server Design
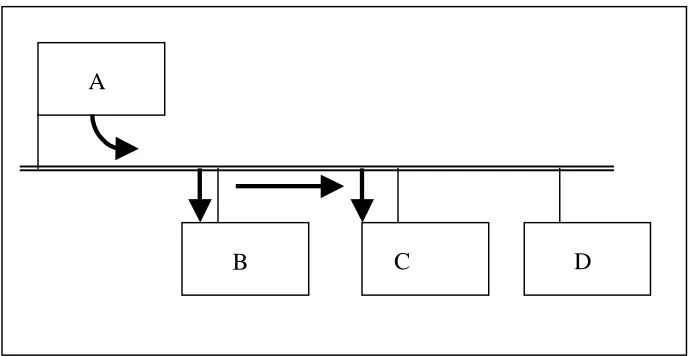
The server as well as graphics and user I/O is responsible for communicating all client activities to the other clients in the system i.e. clients do not communicate with each other directly but through the server. To cater for these multiple tasks the server must be multi-threaded as shown in the following diagram.
0(-1,1,-1) 3(1,1,-1)
7(1,-1,-1)
6(1,-1,1) 5(-1,-1,1)
1(-1,1,1)
2(1,1,1) 4(-1,-1,-1)
Triangles
• 013
• 231
• 457
• 567
• 015
• 025
• 326
Fig3.5: Server Activities
3.3.1 Main Thread: Display Graphics and Handle User I/O
When dealing with 3D rendering the following factors have to be taken into account:
3.3.1.1 Lighting
• Enable users to see things
• Provides 3D graphics with more realistic worlds, with shadows, reflective surfaces, colour, and various other effects.
• Three different types of light
o Ambient Light
o Diffuse Light
o Specular Light
3.3.1.2 Texture Mapping
Display graphics and handle user I/O
Listen for new Client connections
Send Data Packets to Clients
• Turn the 3D world from a bunch of coloured triangles into a photo realistic scene
3.3.1.3 Determine Sector
To display the whole world on screen results in response times being very slow e.g. user cannot navigate swiftly through the world but instead it seems to jump intermittently between each frame.
The solution is to divide the world into blocks or sectors, then use the clients’ current position to draw the meshes in their surrounding vicinity.
The following diagram highlights the sectors that would be drawn around the clients’ current position marked by the face. If the client moved into another sector the nine surrounding sectors would then be displayed.
Fig 3.6: Display Sectors
If the user is new draw the position received
Otherwise predict position for the user using Dead Reckoning if client has not resent its new position.
3.3.1.5 Receive User I/O
Determine where to move camera to Move camera tell openGL
Determine if server position needs to be sent again – dead reckoning
3.3.2 Listening Thread
This thread must continuously listen at the predefined socket for new clients wanting to log on. It sits waiting for input on the socket and when it receives new client details it immediately creates a new client thread for this user and goes back to listening for new clients.
3.3.3 Client Thread 1
The first Client Thread will be responsible for sending both the server details and passing on any other clients details logged onto the system.
3.3.4 Client Thread 2
This thread receives any updates that will be sent by this client giving its new position.
3.4 Client Design
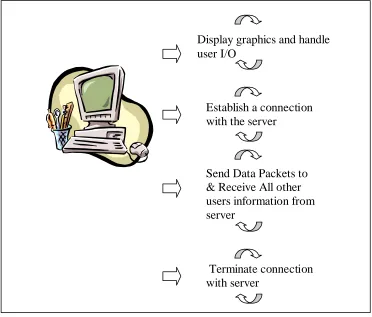
Fig 3.7: Client Activities
3.4.1 Main Thread
This threads main function is similar to the server:
3.4.1.1 Responsible for drawing graphics
Light
Determine Sector
Draw mesh for this sector and surrounding sectors
Draw other users logged on if new position draw this position otherwise predict posn for user
3.4.1.2 Receive User I/O
Determine where to move camera to
Display graphics and handle user I/O
Establish a connection with the server
Send Data Packets to & Receive All other users information from server
Move camera tell openGL
3.4.1.3 Determine if client’s position needs to be sent
again.
3.4.2 Sending Thread
If the clients position needs to be resent again this thread will send it to the server.
3.4.3 Receiving Thread
This thread will receive all other clients’ co-ordinate details from the server through this thread.
3.5 Dead Reckoning Algorithm
This virtual world has a central server to which all entities connect. The entity upon connection to the server sends its state packet to the server, where the server will assign a unique id to the entity. The server will then send to the new entity the servers state packet and all state packets for the other entities. At the same time it will send the state packet for the new entity to all other nodes, which will recognise this as a new entity by its unique id.
Acceleration and speed are not taken into consideration in this prediction algorithm as entities move at a fixed rate however the direction that the entity is moving must be sent by the entity so that other entities can predict the axis to move along i.e. if the entity is going forwards or backwards or to the right or left. The state packet is therefore made up of the following data.
Entity Direction
Entity X Position
Entity Y Position
Once the state packet is sent and there is on screen movement the prediction algorithm comes into play. The entity after each actual move will also calculate its ‘ghost’ position i.e. the position calculated from the last state packet sent which all other nodes will use to predict this entity’s progress. The distance between these two points will then be found using the following function:
Dist = √(Xcurrent – Xpredicted)2 + (Ycurrent – Ypredicted)2 + (Zcurrent – Zpredicted)2
If the distance is greater than the fixed threshold level the entity must resend its state packet to the server for redistribution among the other nodes. A flag is set to indicate to the thread responsible for sending and receiving data from the server that a new state packet is to be sent and the new ‘last position sent’ is recorded to calculate the ghost position.
4: Implementation
The following sections summarise the database and tables for storing the polygonal mesh data and the main classes involved in the project, giving an overview of the main procedures and routines involved in each class.
4.1 MSQL Mesh Database
The mesh table indicates the number of vertices, normals and triangles in each mesh. The values retrieved from this table specify the number of rows that are to be retrieved from the other tables i.e. how many vertices, normals and triangles are associated with each mesh to be drawn.
Simple SQL statements are used in code to retrieve the data. For example the following piece of code is called to retrieve data from the mesh table with the mesh id being passed to the routine to indicate which mesh is being accessed.
void DBase::selectmTable(int meshNo){
sprintf(query, "select * from %s where mesh_id = %d",TABLE,
meshNo);
if (msqlQuery(sock,query) < 0){
printf("Error: %s\n", msqlErrMsg);
exit(-1);
}
res = msqlStoreResult();
if ((numrows =msqlNumRows(res))){
row = msqlFetchRow(res);
//numfields = msqlNumFields(res);
num_Vertices = atoi(row[1]);
num_Triangles = atoi(row[2]);
num_Normals = atoi(row[3]);
}
msqlFreeResult(res);
}
4.2 Camera
This class contains all camera co-ordinates and the procedures to move and store the camera positions around the world.
void SetModelViewMatrix( );
void Set (Point3 Initial Position, Point3 LookAt Position, Point3 Up Position);
void setShape(float View Angle, float Aspect, float near Distance, float far Distance);
void setProjectionMatrix( );
These procedures all contribute towards determining the cameras current co-ordinates i.e. creating the modelview matrix and projection matrix and sending the details to OpenGL.
void Slide(float X direction, float Y direction, float Z direction); void Rotate(float angle, Vector3 a, Vector3 b);
void right(float angle); void left(float angle);
int DetermineSector( );
This procedure determines where the camera is in the world. The sector number is returned and then used to determine which sectors are to be drawn on screen
double DiffBetweenGhost( ); double DiffInRotation( );
void ghostSlide(float delX, float delY, float delZ); void ghostRotate(float angle, Vector3 a, Vector3 b); void ghostRight(float angle);
void ghostLeft(float angle); void setGhost( );
void predictPosition((HANDLE sEvent, int nu);
4.3 MSQLDB
This class contains all routines required for accessing the city data in the msql database so that the buildings and objects can be rendered on screen. The query statements use sql to access the tables.
void connectDB( );
This routine is called to connect to the database. The IP Config Address of the database is used to indicate where the db is stored.
void selectmTable(int meshNo);
void selectVertTable(TriMesh *mesh, int meshID, int num_Vertices);
void selectTriangTable(TriMesh *mesh,int meshID, int num_Triangles);
void selectNormalTable(TriMesh *mesh,int meshID, int num_Normals);
4.4 Thread
This defines the ClientPos class that is used to store all other clients’ positions logged on and also the dead reckoning routines, which are required to calculate their new co-ordinates in each frame.
void calcPosn( )
void slide(float delX, float delY, float delZ) void rotate(float angle, Vector3 a, Vector3 b) void right(float angle)
void left(float angle)
These procedures are all used in calculating the client’s new position. The calcPosn routine uses the current client ‘direction’ to determine where the client is moving to i.e. if they are going forward or backwards, to the right or left or turning around.
4.5 Threed
The Point3 and Vector3 classes and routines define the 3D points and vectors used in the building setup and the camera co-ordinates.
void Point3::set( Point3 &p); void Vector3::set(Vector3 &v); void Vector3::flip( );
void Vector3::setDiff(Vector3& a, Vector3& b); void Vector3::flip( );
4.6 Main
The main class is responsible for creating the different threads required to carry out the multiple activities both in the Client and Server.
void GLUTinitialise(int argc, char *argv[])
The GLUTinitialise procedure carries out a number of initial functions that are required. The different types of light and surface reflection values are determined. The textures that are mapped onto the city objects are also loaded in here. All polygonal meshes are read in from the database. The initial camera and ‘ghost’co-ordinates are set.
void GLUTdrawFunction( )
This procedure determines the sector that the camera is currently in and then draws the relevant sectors surrounding the camera binding the correct textures to the objects/buildings to be drawn. All clients logged on are also drawn either by using the newly received clients position or by calculating their new position using dead reckoning.
void GLUTkeyFunction(unsigned char k, int x, int y)
4.6.1 Server Specific Routines.
void mainLoopThread(void *dummy) void createUserThread(void *us)
The mainLoopThread listens continuously at the agreed socket for new incoming connections. Once a new connection is accepted the createUserThread is called to create a new thread to deal with this client. The createUserThread then determines if this is a ‘send’ or ‘receive’ thread for the client. If it’s a ‘send’ thread it knows that its function is to send all clients positional information to this client when it receives it. If it’s a ‘receive’ thread its function is to receive this clients positional updates.
4.6.2 Client Specific Routines.
void sendThread(void* dummy) void mainLoopThread(void *dummy)
5: Evaluation & Future Work
This project has provided a substantial basis towards the successful completion of the proposed Multi-User Virtual Dublin Environment.
The multi-user nature of this project means that all users must know and be able to see the exact location of all other users in the environment. The Camera setup means that at any time all users can send their exact positional details to others who can then represent them on their screens. The database provides polygonal mesh data and removes the need for replicated data. A multi-tasking environment allows for the required multi-user activities and dead reckoning reduces the network traffic required contributing towards quicker response times and more up to date rendering.
The results found have also highlighted areas for improvements and future work.
5.1 Server Responsibilities
The design and implementation for the server includes the server carrying out graphics rendering and catering for user I/O. Tests have shown that this hinders the servers capabilities of dealing with clients requests and can contribute towards delays on screen.
Further developments will therefore remove this activity from the server thus improving the overall multi-user interaction and communication.
5.2 Graphics
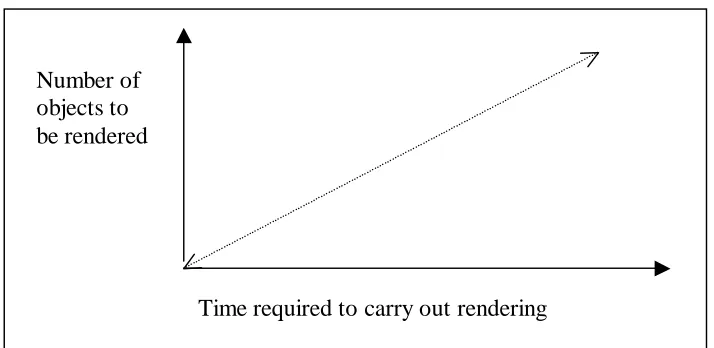
When designing a 3D world to display the whole world on screen at the same time is too slow, both the movement on screen is badly effected and the time it takes to send/receive network data between hosts. This is due to the amount of time required to carry out the rendering for all the world objects in each frame.
[image:53.595.151.508.438.612.2]The following graph shows the relationship between time and 3D rendering and how the greater the amount of rendering required the more time is required to draw each frame and therefore the slower the response times for all other activities.
Fig 5.1: Time Effects from Rendering
The solution to this problem is to divide the world into sectors and assign buildings to sectors depending on their positions. The users current camera position is then used to tell the program the sectors that are directly around the user and that need to be drawn. This solution
Time required to carry out rendering Number of
greatly improves the response times as less rendering is required, however other factors must then be taken into consideration.
Sectoring leads to ‘popping’ affects on screen which is when the users move from one sector to another resulting in different sectors being drawn so that buildings seem to ‘pop’ on screen out of nowhere. To reduce the popping affect so that it is less obvious to the user means to draw more sectors or increase the size of sectors so that the buildings are popping up at a distance that is too far away from the users position to be noticed. This solution however is again increasing the rendering required and so is going to affect the response times bringing us back to the original problem.
Tests carried out on on this project to determine the optimal number of sectors that should be rendered, counting 80 block meshes in one sector with a width of 25 units and depth of 47 units to allow a satisfactory user I/O showed the following results with the number of frames shown per second
25 20
10
50 100 1000
5
200
No. of Sectors Rendered No. of
The number of sectors that were found to be the most usable for the response times meant that popping was more evident when the user moved from sector to sector.
What is needed is the same response times but more objects rendered on screen. To obtain this result display more sectors but reduce the details required on objects/buildings that are drawn depending on the distance to the user. This means that the buildings are still visible on screen but due to the distance a high level of detail is not required, therefore less rendering is required and so less time needed to draw them. It is only the objects in the direct vicinity of the user that the highest level of detail is required.
This solution results therefore in more buildings being drawn on screen simultaneously and so less obvious popping affects, however due to lower levels of detail for distant objects less time is required for rendering so the response time will not be as badly affected and will not hinder users activities.
5.3 Mesh Data & Textures
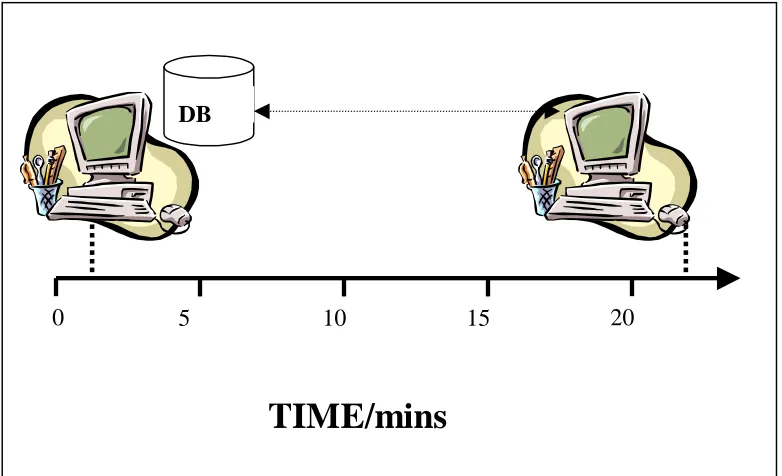
Fig 5.2: Database time loadup
This diagram highlights the time difference it takes for two machines to load up the mesh data depending on if the database is on the hosts machine or if it is on another machine.
Buildings in this projects environment are basic block buildings and therefore do not require many vertices, normals and triangles to be stored. However buildings are usually not that simple and have complicated designs and this will greatly increase the amount of data required to represent them. For example the following figure gives the number of vertices, normals and triangles in a basic block building and a building in Trinity College.
TIME/mins
DB
0 5 10 15 20
DB
Block Building
No. Vertices: 10 No. Normals: 8 No. Triangles: 12
Trinity Building
If the time required for reading in simple mesh formats is so high the time required to read in the large amounts of data for actual real buildings would be too long and totally unacceptable.
Building mesh databases can be stored on each users machine however this leads to more complicated housekeeping and ensuring that all databases are updated simultaneously and are the same version. Loading in the buildings as required would reduce the time needed to load the data into RAM to be displayed instead of reading all mesh formats into memory at the beginning of the program.
Caching will also reduce network traffic and loading times required. Users can cache sectors that they recently traversed or that they traverse on a frequent basis.
Large mesh formats will also increase the amount of memory required to store the mesh data. This will eventually result in multiple databases being required to represent the city. How to split this data and distribute it needs to be considered. Typical solutions could include partitioning the database among clients or in larger systems where more than one server is required dividing the databases among the servers and having the data distributed among the servers and forwarded to the clients.
Buildings textures are also quite complicated and will result in more than one texture being required per building. How to store the textures and map them onto the buildings also needs to be addressed.
5.4 Dead Reckoning
6: Bibliography
[Aliaga et. Al98] D.Aliaga, J. Cohen, A. Wilson, H. Zhang, C. Erikson, K. Hoff, T. Hudson, W. Stuerzlinger, E. Baker, R. Bastos, M. Whitton, F. Brooks, D. Manocha. A Framework for the Real-Time Walkthrough of Massive Models
[Aronson97] Jesse Aronson. Dead Reckoning: Latency Hiding for Networked Games, 1997.
[Bourdakis et al., 1997] Vassilis Bourdakis & Alan Day. A VRML model of Bath, 1997.
[Cai et. al99] Wentong Cai, Francis B.S.Lee, L.Chen. An Auto Adaptive Dead Reckoning Algorithm for Distributed Interactive Simulation, 1999.
[Chasan] Visualisation of Complex Polygonal Models
http://www.dcc.uchile.cl/~chasan/visual.html
[Crowley99] Daniel Crowley. DVRML: Extending VRML for Multi-User Virtual Reality, M.Sc. 1999.
[Diaz et. Al] Alicia Diaz, Ronald Melster. Patterns for Modelling Behaviour in Virtual Environment Applications
[Dodge, Smith & Doyle 1997b] Towards the Virtual City: VR & Internet GIS for Urban Planning.
David Duke, University of Bath. A full day VVECC seminar presenting the state of the art in the design of virtual environments. http:// www-ais.itd.clrc.ac.uk/VVECC/proceed/vedesign
[Falby et. Al] NPSNET: Hierarchical Data Structures for Real-Time Three Dimensional Visual Simulation John S. Falby, Michael J. Zyda, David R.Pratt and Randy L. Mackey.
[Gossweiler et. al] Rich Gossweiler, Robert J. Laferriere, Michael L.Keller, Randy Pausch. An Introductory Tutorial for Developing Multi-User Virtual Environments.
[IEEE93] Institute of Electrical and Electronics Engineers, International
Standard, ANSI/IEEE Std 1278-1993, Standard for Information Technology, Protocols for Distributed Interactive
Simulation, March 1993.
[Isler et. Al. 96] Veysi Isler, Rynson W.H. Lau, Mark Green Real-time. Multi-Resolution for Complex Virtual Environments.1996.
[Kobbelt, Kahler et al. 00] Leif Kobbelt, Kolja Kahler et. al. Processing Complex Polygonal Meshes 2000.
[Looman00] Jeff Looman. Develop a Client/Server Application on Windows and Linux.
[Macedonia95] Michael R. Macedonia, Michael J. Zyda, David R. Pratt, Paul T. Barham and Steven Zeswitz. “NPSNET: A Network Software Architecture for Large Scale Virtual Environments, 1995.
[O’Connell97] Karl O’Connell. System Support for Distributed Multi-User Virtual Worlds, Ph.D. 1997.
[Peter98] Communication cost optimisation and analysis in Distributed Virtual Environment, 1998.
[Planet 9 Studios] Contents Copyright © Planet 9 Studios, 1995-2001 http://www.planet9.com/
[Pope89] Pope, Arthur, BBN Report No. 7102, The SIMNET Network and Protocols, BBN Systems and Technologies, Cambridge,
Massachusetts, July 1989.
[Pratt 93] David R Pratt. A Software Achitecture for the Construction and Management of Real Time Virtual Worlds. June 1993 pp 22-28
[Smith et. al] Andy Smith, Martin Dodge, Simon Doyle. Visual Communication in Urban Planning and Urban Design.
[Thorpe 1987] Thorpe Jack A. The New Technology of Large Scale Simulator Networking: Implications for Mastering the Art of Warfighting” Proceedings of the Ninth Interservice Industry Training Systems Conference, Novembr 1997.
[Virtual Brighton & Hove] http://www.brighton.co.uk/
[Virtual Bologna] http://www.nettuno.it/bologna/MappaWelcome.html
[Walkthrough Project] http://www.cs.unc.edu/~walk/overview
[Zyda and Pratt 1991] Zyda, Micael J. and Pratt, David,
NPSNET: A 3D Visual Simulator for Virtual World Exploration and Experimentation, 1991 SID International Symposium Digest of Technical Papers May 1991 pp 361-364