TeAM
YYePG
YYePG
DN: cn=TeAM YYePG, c=US, o=TeAM YYePG, ou=TeAM YYePG, email=yyepg@msn. com
Chemical Process Safety
Learning from Case Histories
3rdEdition
200 Wheeler Road, Burlington, MA 01803, USA Linacre House, Jordan Hill, Oxford OX2 8DP, UK
Copyright © 2005, Elsevier Inc. All rights reserved.
No part of this publication may be reproduced, stored in a retrieval system, or transmitted in any form or by any means, electronic, mechanical, photocopying, recording, or otherwise, without the prior written permission of the publisher.
Permissions may be sought directly from Elsevier’s Science & Technology Rights Department in Oxford, UK: phone: (+44) 1865 843830, fax: (+44) 1865 853333, e-mail:
[email protected]. You may also complete your request on-line via the Elsevier home-page (http://elsevier.com), by selecting “Customer Support” and then “Obtaining Permissions.”
Recognizing the importance of preserving what has been written, Elsevier prints its books on acid-free paper whenever possible.
Library of Congress Cataloging-in-Publication Data Application submitted.
British Library Cataloguing-in-Publication Data
A catalogue record for this book is available from the British Library.
ISBN: 0-7506-7749-X
For information on all Elsevier Butterworth–Heinemann publications visit our Web site at www.books.elsevier.com
04 05 06 07 08 09 10 10 9 8 7 6 5 4 3 2 1
Printed in the United States of America
Contents
ACKNOWLEDGMENTS
PREFACE
1. Perspective, Perspective, Perspective 1
Introduction 1
The Media Rarely Focuses on the Benefits of the Chemical Industry 1 A Glance at the History of Chemical Manufacturing before the Industrial
Revolution 2
The Modern Industrial Chemical Industry Modifies Our Way of Living 3 Risks Are Not Necessarily How They Are Perceived 4
Plant Employee Safety versus Life-style Choices 8 The Chemical Industry’s Excellent Safety Record 8
Who Has the Most Dangerous Jobs? 9
Just How Dangerous Is It to Work in a U.S. Chemical Plant? 15 Just How Dangerous Is It to Work in a Chemical Plant in the United
Kingdom? 16
Fatal Risks Data for Various Activities in the United Kingdom 17
How Are the Chemical and Refinery Industries Doing when It Comes to Major
Losses? 17
2. Good Intentions 23
Modifications Made with Good Intentions 23
A Tank Truck Catastrophically Fails 23 Afterthoughts on the Destroyed Tank Truck 27
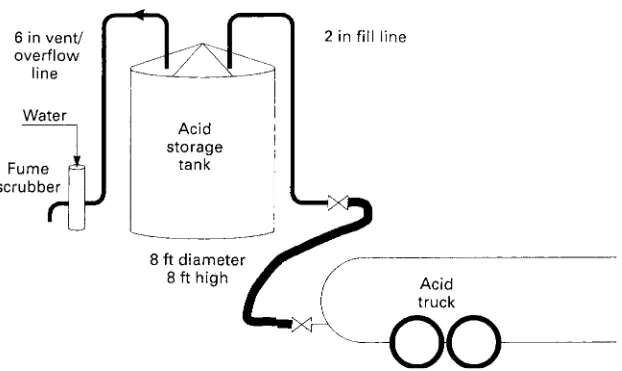
Siphoning Destroys a Tender Tank 27
Afterthoughts on the Acid Tank 27
A Well-Intended Change Yields a Storage Tank Collapse 30 Afterthoughts on a Storage Tank Collapse 34
A Water Drain Line Is Altered and a Reactor Explodes 36 Afterthoughts on the Steam Explosion 38
An Air System Is Improved and a Vessel Blows Up 39 Afterthoughts on Air System 40
A New Air System Improved Economics, but Jeopardized Safety 41
Another Incident with Nitrogen Backup for a Compressed Air Supply 42
Afterthoughts on Incident with Nitrogen Backup for a Compressed Air Supply 43
The Hazards of Nitrogen Asphyxiation 44
Concerns for Safety on a Refrigerated Ethylene Tank 45
Afterthoughts on the Ethylene Tank 47
Beware of Impurities, Stabilizers, or Substitute Chemicals 47 Afterthoughts on Impurities, Stabilizers, or Substitute Chemicals 48 Good Intentions on Certain New Protection Systems Lead to Troubles 48 A Gas Compressor Is Protected from Dirt, But the Plant Catches Fire 49 Afterthoughts on Plant Fire 49
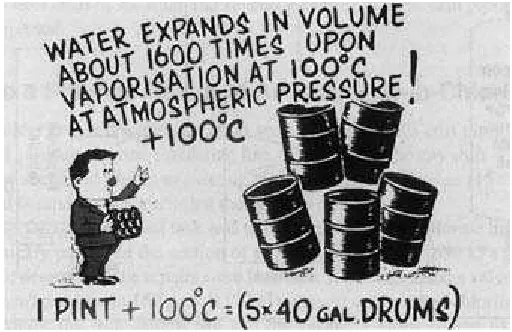
The Lighter Side 49
A Review of Good Intentions 55
3. Focusing on Water and Steam—The Ever-Present and Sometimes Evil Twins 57
A Hydrotest Goes Awry 58
Afterthoughts on Hydrotest Incident 62
A Flooded Column Collapses as Water Is Being Drained from the System 62
Water Reacting with Strong Chemicals 64
Afterthoughts on Water Wash of a Caustic Soda Tank 66
Easy-to-Use Steam Heat Can Push Equipment beyond Safe Design Limits 66
Heating Water in a Confined System 67
Steam Condenses and a Mega-Vessel Is Destroyed during Commissioning 69
Afterthoughts on Mega-Vessel Destroyed during Commissioning 72
A Tragedy Develops When Hot Oil Is Pumped upon a Layer of Water 72
Afterthoughts on Steam Explosions 74
4. Preparation for Maintenance 77
Some Problems When Preparing for Maintenance 77
A Tank Vent Is Routed to a Water-Filled Drum to “Avoid” Problems 77 Afterthoughts on the Strength of Storage Tanks 78
Preparing to Paint Large Tanks 79
Preparing a Brine Sludge Dissolving System for Maintenance 79
What Happened in the Brine System? 80
A Violent Eruption from a Tank Being Prepared for Maintenance 82 Afterthoughts on the Violent Eruption 82
An Explosion While Preparing to Replace a Valve in an Ice Cream Plant 83 Afterthoughts of Heating a Liquid-full Pipeline 83
A Chemical Cleaning Operation Kills Sparrows, But Improves Procedures 86 Other Cleaning, Washing, Steaming, and Purging Operations 87
A Tragedy When Preparing for Valve Maintenance 87
Afterthoughts on Piping Systems 88
A Review of Changes Made to Prepare for Maintenance 89
5. Maintenance-Induced Accidents and Process Piping Problems 91
Planning and Communication 92
Repairs to a Pipeline Result in Another Iron-in-Chlorine Fire 92 Repaired Reboiler Passes the Hydrotest and Later Creates a Fire 93
A Tank Explodes during Welding Repairs after Passing a Flammable Gas Test 94 Catastrophic Failures of Storage Tanks as Reported by the Environmental Protection
Agency 96
Repair Activity to a Piping Spool Result in a Massive Leak from a Sphere 97 The Phillips 66 Incident: Tragedy in Pasadena, Texas 98
A Massive Fire, BLEVE’s, and $5 Million Damages after a Mechanic Improperly
Removes a Valve Actuator 102
Afterthoughts on Massive Fire and BLEVE’s in Latin American 106
Misdirected Precautions on a Reactor System Isolation Plug Valve Results in a Vapor
Cloud Explosion 106
Afterthoughts on Precautions to a Reactor System 107
A Breathing Air System on a Compressed Air Main Is Repaired 107 A Hidden Blind Surprises the Operators 108
Other Reported Incidents in Which Failure to Remove Blinds Created
Troubles 109
Afterthoughts on the Use of Blinds 111
Poor Judgment by Mechanics Allowed a Bad Steam Leak to Result in a Minor
Explosion 112
The Flixborough Disaster and the Lessons We Should Never Forget 113 Do Piping Systems Contribute to Major Accidents? 115
Specific Piping System Problems Reported as Major Incidents 117
OSHA Citations 118
Categories of OSHA Violations and Associated Fines 118
Challenge an OSHA Citation? 118
Four Case Histories of Catastrophic Pipe Failures 119 Afterthoughts on Piping Problems
6. The One-Minute Modifier: Small Quick Changes in a Plant Can Create Bad
Memories 125
Explosion Occurs after an Analyzer Is “Repaired” 125 Just a Little of the Wrong Lubricant 125
When Cooling Methods Were Changed, a Tragedy Occurred 126
Instrument Air Backup Is Disconnected 126
An Operator Modifies the Instrumentation to Handle an Aggravating Alarm 127 A Furnace Temperature Safeguard Is Altered 127
The Wrong Gasket Material Creates Icicles in the Summer 131
Another Costly Gasket Error 131
As Compressed Asbestos Gaskets Are Phased Out, Other Leaks Will Occur 134 Other Piping Gasket Substitution Problems 135
New Stud Bolts Fail Unexpectedly 136
Hurricane Procedures Are Improperly Applied to a Tank Conservation
Vent Lid 136
Afterthoughts on Damages to the Tank 137
Pipefitters Can Create Troubles When Reinstalling Relief Valves 138 Another Pipefitter’s Error 139
A Cooling Water System Is Safeguarded and an Explosion Occurs Some Months
Later 141
Lack of Respect for an Open Vent as a Vacuum-Relieving Device Results in a Partial
Tank Collapse 142
Lack of Respect for an Open Vent as a Pressure-Relief Device Costs Two
Lives 144
Afterthoughts on Tank Vents via Open Nozzles 146
The Misuse of Hoses Can Quickly Create Problems Afterthoughts on “One-Minute” Modifications
7. Accidents Involving Compressors, Hoses, and Pumps 147
Reciprocating Compressors 147
A Piece of Compressor Water Jacket is Launched 148
Compressor System Details 148
Compressor Start-Up Details 148
Root Causes of the Compressor Incident 149
The Misuse of Hoses Can Quickly Create Problems 150
Some of the Many Unpublished Errors Created with Hoses 151
The Water Hose at the Flixborough Disaster 152
Hoses Used to Warm Equipment 153
Three-Mile Island Incident Involved a Hose 153 The Bhopal Tragedy Was Initiated by Use of a Hose 153
Improper Purge Hose Set Up for Maintenance Creates Major Problems 154
To Make Matters Worse . . . 154
Impact and Conclusions of Improper Purging 155
Recommendations for this Improper Purging Incident 156
High-Pressure Hydrogen Inadvertently Backs Into the Nitrogen System and an
Explosion Occurs 157
A Nitric Acid Delivery to the Wrong Tank Makes Front-Page News 158
How Do You Prevent Such an Incident? 158
Other Truck Delivery Incidents 159
An Operator Averts a Sulfuric Acid Unloading Tragedy 159
Hoses Cannot Take Excessive Abuse 159
Hose Selection Guidelines 160
Maintaining Hose Integrity 160
Centrifugal Pumps 162
River Water Pump Piping Explodes 162
River Water System Details 162
What was the Fuel? 164
Why Was the Presence of Flammable Gas Not Detected? 165
Corrective Actions 167
A Severe Pump Explosion Surprises Employees 168
A Large Condensate Pump Explodes 170
8. Failure to Use, Consult, or Understand Specifications 173 Failure to Provide Operating Instructions Cost $100,000 in Property
Damages 173
Other Thoughts on Furnaces 176
Low-Pressure Tank Fabrication Specifications Were NotFollowed 176 Explosion Relief for Low-Pressure Tanks 176
Tinkering with Pressured Vessel Closure Bolts Ends with a Harmless Bang 178
Afterthoughts on a Cheap Lesson 180
Piping Specifications Were Not Utilized 181
Pump Repairs Potentially Endanger the Plant—But Are Corrected in Time to
Prevent Newspaper Headlines 185
Plastic Pumps Installed to Pump Flammable Liquids 187
Weak Walls Wanted—But Alternate Attachments Contributed to the Damage 187
An Explosion Could Have Been Avoided If Gasket Specifications Were
Utilized 188
Surprises within Packaged Units 189
Afterthoughts 189
9. “Imagine If ” Modifications and Practical Problem Solving 191
“Imagine If ” Modifications—Let Us Not Overexaggerate the Dangers as We Perform Safety Studies 191
New Fire-Fighting Agent Meets Opposition—”Could Kill Men as Well as
Fires” 191
A Process Safety Management Quiz 192
New Fiber Production Methods Questioned 194
Practical Problem Solving 195
The Physics Student and His Mischievous Methods 196
10. The Role of Mechanical Integrity in Chemical Process Safety 199 “Mechanical Integrity” in a Chemical Plant 199
A Regulatory View of Mechanical Integrity 200
Mechanical Integrity Programs Must Be Tailored to the Specific Site 201 Mechanical Integrity in Design and Installation 201
Equipment Covered by Mechanical Integrity 201
Regulatory Enforcement of Mechanical Integrity 203 An Industry View of Mechanical Integrity 203
Written Procedures and Training 204
Classification of Equipment by Hazard Potential 204
Mechanical Integrity Programs for Pumps/Compressors 205
Thermography Techniques for Rotating and Stationary Equipment 212
Mechanical Integrity Programs for Piping, Pressure Vessels, Storage Tanks,
and Process Piping 213
Inspecting Pressure Vessels, Storage Tanks, and Piping 216 Inspection of Pressure Vessels and Storage Tanks 216
Inspection of Above-Ground Piping 227
The Critical Role of Safety Relief Valves 229 “In-House” Testing Safety Relief Valves 230
Mechanical Integrity Program for Process Safety Interlocks and Alarms 238 Protective Process Safety Interlocks at a DuPont Plant 238
Another Company—A Different Emphasis on Safety Critical Instrument
Systems 239
Another Approach—Prooftesting at a Louisiana Plant 240 Additional Information on Mechanical Integrity 248
11. Effectively Managing Change within the Chemical Industry 251
Introduction 251
Preliminary Thoughts on Managing Change 251
Are Management of Change (MOC) Systems Like Snowflakes? 252
A Reality Check Provided by Previous Chapters 253
Keeping MOC Systems Simple 253
Losing Tribal Knowledge 254
Some Historical Approaches to Plant Changes 254
The U.S. OSHA Process Safety Management Standard Addresses “Management
of Change” 254
Principles of an Effective Management of Change System That Prevents
Uncontrolled Change and Satisfies OSHA 256
An Overall Process Description to Create or Improve a Management of Change
System 257
Clear Definitions Are Imperative 258
Key Steps for an Effective Management of Change System for a Medium or Large
Organization 260
Key Steps for an Effective Management of Change System for a Small
Company 268
Multidisciplined Committee Can Provide an In-Depth Look When Identifying
Hazards 270
Variances, Exceptions, and Special Cases of Change 272
Management of Change Approvals, Documentation, and Auditing 277
Closing Thoughts on a Management of Change Policy 278
Appendix A 279
Some Historical Approaches to Plant Changes 279
How Are Chemical Plants Addressing Plant Modifications during the 1980s
and Beyond? 280
The Center for Chemical Process Safety 282
New Recommendations and New Regulations 282
Appendix B 284
How Should Potential Hazards Be Identified and Evaluated? 284
12. Investigating and Sharing Near Misses and Unfortunate Incidents 289
Introduction 289
More Guidelines on the Culture of Incident Reporting 292
An OSHA Program Coordinator’s View 294
Layers of Incident Causes 294
A Furnace Tube Failure Case History is Revisited Process Safety Incident Investigation Techniques 296
Applying Root Cause Analysis 297
Some Chemical Manufacturers’ Approaches to Incident Investigation 297
What Is a Root Cause? 299
Some Thoughts on Process Safety Incident Investigation Techniques 299
Complying with the OSHA Element on Incident Investigation 299
Report Approval, Report Distribution, Sharing the Findings, Corrective Action Tracking, and Report Retention 303
Conclusions 304
Appendix A Interviewing Tips 305
13. Sources of Helpful Information for Chemical Process Safety 307
The Best Seven Books in Chemical Process Safety—From a Process Engineer’s
Viewpoint 309
General Chemical Process Safety Books 311
Practical Information on Safety Critical Instruments and Pressure Vessels, Tanks,
and Piping 313
Internet Resources
Other Helpful Resources 314
Preface
Look around the bookshelves. There are many good recent books and articles on Chemical Process Safety theory and procedures. These texts offer sound advice on identifying chem-ical process hazard analysis, training, audits, and guidelines books addressing the elements of OSHA’s Process Safety Management Law. However, only a few people such as Trevor A. Kletz offer many authentic case histories that provide opportunities to learn fundamentals in process safety.
Trevor Kletz encouraged me to write a book on plant modifications in 1989. At that time, we were working together teaching an American Institute of Chemical Engineers Continuing Education Course entitled “Chemical Plant Accidents—A Workshop on Causes and Preventions.” I hope that my books in some way mimic Trevor Kletz’s style of presenting clear, interesting anecdotes that illustrate process safety concepts. Hopefully, my recorded case histories can be shared with chemical process operators, operations supervisor, university professors studying chemical process safety, chemical plant pipefit-ters, welders, and maintenance supervisors.
The first book was successful and this is a sequel. It contains two new chapters, many new incidents, and plenty of vivid photos.
In February 1992, the U.S. Department of Labor’s Occupational Safety and Health Administration (OSHA) issued “Process Safety Management of Highly Hazardous Chemicals: Final Rule.” In this book I attempt to interpret three sections of the standard that deal with “Mechanical Integrity,” “Management of Change,” and “Incident Investigation” based upon nearly a quarter century of experience in Process Safety prac-tice, significant literature studies, consulting with associates at other plants, and from regulators. An OSHA Representative may or may not agree with each suggested specific procedure. OSHA Representatives may chose additional approval steps or additional documentation.
The reader should be aware that all my experiences were within a major chemical plant with about $2 billion replacement cost, 1,650 employees, and over 250 acres of chemical plant. There are toxic gases, flammable gases, flashing flammable liquids, com-bustible liquids, and caustic materials, but there were no significant problems with combustible dusts and no significant problems with static electricity.
The information in this book came from a number of sources including: stories from my experiences in the now defunct Louisiana Loss Prevention Association; students in the AIChE’s “Chemical Plant Accidents” course; members of the Lake Area Industries— McNeese State University Engineering Department’s OSHA Support meetings; cowork-ers, friends, and the literature. I believe the case history stories are true, but some are hearsay and are not supported with any documentation. The approaches and
Acknowledgments
Third Edition
I am appreciative of all the support I received to make this third edition a reality. I am grateful that my family and close friends understood that I had to make a few sacrifices and miss some activities to get this third edition completed.
Without the editor’s support by Christine Kloiber and Phil Carmical of Elsevier Science, no words would have been written. But, once the words are written I continue to rely on the guidance and keenly developed proofreading skills, and candid critiques of Selina Cascio to convert my blemished sentences into free flowing, easily understood thoughts. Selina has helped me with nearly all of my technical writings over the past 20 years and her input has really made a positive impact.
I am grateful for the additional material that appears in this third edition courtesy of David Chung of the US Environmental Protection Agency, from Douglas S. Giles and Peter N. Lodal of Eastman Chemical Company, from Dr. Trevor A. Kletz , from Nir Keren of the Mary Kay O’Connor Process Safety Center, from Catherine Vickers of PPG and countless others who are referenced throughout the text. I was also lucky to get talented drafting help from Manuel David. Manuel created easy-to-understand illustra-tions to support the narratives of the incidents.
I would be also be remiss if I did not thank the PPG Professionals in Monroeville, Pennsylvania for their technical and legal review. The Monroeville supporters include, Jeff Solomon, David McKeough, and Maria Revetta.
Second Edition
I am grateful for Michael Forster of Butterworth–Heinemann for encouraging a second edition of this book. He has been a steady support for this challenge for several years. Without his energy and support this second edition would not have happened.
The professional proofreading skills of my daughter Laura Sanders and her husband Morgan Grether have be instrumental in adding life and clarity to about one-half of the chapters. And the project could not be finished without the guidance, keenly developed proofreading skills, and candid critiques of Selina Cascio. I would be also be remiss if I did not thank the PPG Professionals in Monroeville, Pennsylvania for their technical review. The Monroeville supporters include David McKeough, Maria Revetta, and Irwin Stein.
I am grateful to Dr. Mark Smith, of the Institution of Chemical Engineers, for extend-ing the permission granted in the first edition to use a few sketches and photos to enhance several case histories.
Also a note of thanks to Manuel David and Warren Schindler, talented drafters, who provided several excellent sketches to add visual images to clarify important concepts. Naturally, I am very grateful and appreciate the continuing support of Dr. Trevor A. Kletz. He has never been too busy to provide guidance.
To my wife, Jill, and to Julie and Lisa, my two daughters who live with me, thanks for understanding. When you have a full-time job, a project like this requires sacrifice. I appre-ciate their patience as I had to avoid some family activities for over a year while I whittled away on this project.
First Edition
A number of people deserve thanks for encouraging me and helping me with this chal-lenge. As an engineer within a chemical manufacturing facility, opportunities to write arti-cles did not seem realistic to me. In the early 1980s after submitting a rather primitive pro-posed technical paper, Bill Bradford encouraged me to draft a manuscript. My first technical paper was on the subject of Plant Modifications and it was presented to the AIChE in 1982.
In 1983, Trevor A. Kletz asked me to help him teach an American Institute of Chemical Engineers Continuing Education Course. I was shocked and elated to be considered. It was such a great opportunity to learn from this living legend in Loss Prevention. It has been educational and enjoyable ever since; he has become my teacher, my coach, and my friend. I assisted Trevor Kletz in teaching a two-day course entitled “Chemical Plant Accidents—A Workshop on Causes and Preventions.” We periodically taught the course for six years, and then he encouraged me to consider writing this book on Plant Modifications. Jayne Holder, formerly of Butterworth, was extremely supportive with all my concerns and questions.
Before I got started, I was searching for help and William E. Cleary, Jack M. Jarnagin, Selina C. Cascio, and Trevor A. Kletz volunteered to support the project. Then the hard part came. Again, Trevor Kletz and Jayne Holder encouraged me to get started.
I am grateful to Bill Cleary for his technical and grammatical critique, and to Selina Cascio for her skill in manuscript preparation including endless suggestions on style and punctuation. Jack Jarnagin’s drafting assistance provided the clear illustrations throughout the text, and to Trevor for his continuous support.
CHAPTER 1
Perspective, Perspective,
Perspective
Introduction
Perspective, perspective, perspective—chemical manufacturing industries are often the tar-gets of misperceptions. In this opening chapter, be prepared to see a more accurate repre-sentation of the U.S. chemical industry, including its value to humanity, its history, and its high degree of safety. The first section is a brief review of the countless benefits of the chem-ical industries that surround us, increase our life span, and enhance our enjoyment of life. The second section is a glimpse of the history of the vital chemical manufacturing indus-try. However, the concept of comparative risks is the main emphasis of this chapter. The perceived risks of the chemical industry and its occupations are often misunderstood.
Working in the chemical industry is safer than most individuals realize. We shall provide a perspective of the risks of working within this industry by comparing that risk with actual statistical dangers encountered with other well-understood occupations, commonplace activities, and life-styles. Later chapters will focus on costly errors in the chemical industry along with practices and procedures to reduce the occurrence and severity of such incidents. Viewed in isolation, case histories alone could easily lead to the inaccurate picture that the chemical industry is dangerous. In fact, the chemical industry has an impressive safety record that is considerably better than most occupations. The news media does not often speak of the safety of the chemical plants because these passive truths lack news-selling sizzle.
The Media Rarely Focuses on the Benefits of the Chemical
Industry
Chemical manufacturing and petroleum refining have enriched our lives. Few individuals in the developed world stop to realize how the chemical industry has improved every minute of their day. The benefits of the industries are apparent from the time our plastic alarm clock tells us to wake up from a pleasant sleep on our polyester sheets and our polyurethane foam mattresses. As our feet touch the nylon carpet, we walk a few steps to turn on a phenolic light switch that allows electrical current to safely pass through polyvinyl chloride insulated wires. At the bathroom sink, we wash our face in chemically sanitized water using a chemically produced soap.
We enter the kitchen and open the plastic-lined refrigerator cooled by fluorochlorohy-drocarbon chemicals and reach for the orange juice, which came from chemically fertilized orange groves. Many of us bring in the morning newspaper and take a quick look at the news without thinking that the printing inks and the paper itself are chemical products. Likewise, other individuals choose to turn on the morning news and do not think twice that practically every component within the television or radio was made of products pro-duced by the chemical industry. In short, we just do not think we are surrounded by the benefits created from chemicals and fail to recognize how the industries have enriched our lives.
A recent publication distributed by the American Chemical Society states:
The chemical industry is more diverse than virtually any other U.S. industry. Its products are omnipresent. Chemicals are the building blocks for products that meet our most fun-damental needs for food, shelter, and health, as well as products vital to the high technol-ogy world of computing, telecommunications, and biotechnoltechnol-ogy. Chemicals are a keystone of U.S. manufacturing, essential to the entire range of industries, such as pharmaceuticals, automobiles, textiles, furniture, paint, paper, electronics, agriculture, construction, appli-ances and services. It is difficult to fully enumerate the uses of chemical products and processes. . . . A world without the chemical industry would lack modern medicine, trans-portation, communications, and consumer products. [1]
A Glance at the History of Chemical Manufacturing before
the Industrial Revolution
Humanity has always been devising ways of trying to make life a little better or easier. In the broad sense, prehistoric people practiced chemistry beginning with the use of fire to produce chemical changes like burning wood, cooking food, and firing pottery and bricks. Clay was shaped into useful utensils and baked to form water-resistive hard forms as crude jars, pitchers, and pots at least as far back as 5000 B.C. [2]
The oldest of the major industrial chemicals in use today is soda ash. It seems to date back to 3000 to 4000 B.C. because beads and other ornaments of glass, presumably made
with soda ash, were found in Egyptian tombs. It seems a natural soda ash was used as an article of trade in ancient Lower Egypt. [3]
From what we know today, even the earliest civilized man was aware of the practical use of alcoholic fermentation. The Egyptians and Sumerians made a type of ale before 3000
B.C., and the practice may have originated much earlier. Wine was also made in ancient
Egypt before 3000 B.C. by treading the grapes, squeezing the juice of the crushed grapes,
and allowing the juice to ferment in jars. In addition to the ale and grape-wine, the ancients drank date-wine, palm-wine, and cider. [4]
be noted that stale urine was used for cleaning clothes from Roman times up to the nine-teenth century, when it was still in use on sailing ships. [5]
During the 900s, Europeans only lived for about 30 years, and life was a matter of much toil for very little rewards. Food was scarce, monotonous, often stale or spoiled. Homes offered minimal protection from the elements and clothing was coarse and rough. War, dis-ease, famine, and a low birth rate were ever present. Fewer than 20 percent of the Europeans during the Middle Ages ever traveled more than 10 miles (16 km) from the place they were born. The age that followed these bleak years brought forth a burst of inventiveness as mankind began to understand how science could take over some of their burdens. [6, 7]
In Europe, the harvesting and burning of various seaweeds and vegetation along the seashore to create a type of soda ash product is one of the earliest examples of recorded industrial chemical manufacturing. No one is sure when this type of chemical processing began, but it was fairly widespread before modern recorded history. In fact, the Arabic name for soda, al kali,comes from the word kali, which is one of the types of plants har-vested for this early industrial chemical producing activity. The desired product of this burned vegetation was extracted with hot water to form brown colored lye. The process yielded primarily sodium carbonate (or by its common name, soda ash), which was used to manufacture soap and glass. Soda ash is by far the oldest of the major industrial chem-icals used today. [3]
During the 1600s and 1700s, scientists laid the foundations for the modern chemical industry. Germany, France, and England initially manufactured inorganic chemicals to pre-serve meat and other foods, make gunpowder, dye fabrics, and produce soap. In 1635, the first American chemical plant started up in Boston to make saltpeter for gunpowder and for the tanning of hides. [8]
The chemical industry was being formed as the Industrial Revolution began, but as late as 1700, only 14 elements had been identified. The early chemical manufacturing process development can be accredited to Nicolas LeBlanc, a physician to the Duke of Orleans, who outlined a method of making soda ash starting with common table salt. The Duke of Orleans gave Dr. LeBlanc sufficient funds to build such a plant not far from Paris in the 1790s. [9] Other soda plants sprang up in France, England, Scotland, Austria, and Germany. [10]
The LeBlanc Process was the first large-scale industrial chemical process. The process produced large quantities of gaseous hydrochloric acid as a by-product that released into the air and caused what was probably the first large-scale industrial pollution. It was later found that this waste gas could be captured and reacted with manganese dioxide to pro-duce gaseous chlorine. The LeBlanc Process was used until about 1861, after which it began to be replaced by the more efficient Solvay Process. [7]
The Modern Industrial Chemical Industry Modifies Our Way
of Living
and fuels. [8] The 1930s witnessed the production of neoprene (1930), polyethylene (1933), nylon (1937), and fiberglass (1938), which signaled the beginning of an era that would see plastics replace natural materials. These “plastics” would radically influence how things were designed, constructed, and packaged. [11]
After the Second World War, the expansion of the petroleum refining and chemical process industries far outstripped that of the rest of the manufacturing industries. The chemical industry also was different than the older established industries due to the nature of toxic and flammable liquids and gases. [12] Naturally, the handling and storage of haz-ardous materials presented a potential peril that was often far greater than those posed by the traditional industries.
By the 1950s and 1960s chemical processing became more and more sophisticated, with larger inventories of corrosive, toxic, and flammable chemicals, higher temperatures, and higher pressures. It became no longer acceptable for a single well-meaning individual to quickly change the design or operation of a chemical or petrochemical plant without reviewing the side effects of these modifications. Many case histories of significant process accidents vividly show examples of narrowly focused, resourceful individuals who cleverly solved a specific, troubling problem without examining other possible undesired conse-quences. [13–21]
This book will focus on a large number of near misses, damaging fires, explosions, leaks, physical injuries, and bruised egos. A flawed “plant modification,” improper maintenance, poor operating practice, or failure to follow procedures was determined to be at least a con-tributory cause in many case histories cited in the chapters that follow. Strangers to the chemical industry might be tempted to think that it is one of the most hazardous of indus-tries; the opposite is true. The U.S. Chemical Industries (and most European Chemical Industries) are among the safest of all industries. The facts show that it requires a high degree of discipline to handle large quantities of flammable, combustible, toxic, or other-wise hazardous materials.
The chemical industry generally handles business so well that it is difficult to find large numbers of recent incidents for examples. Many of the featured case histories in this book occurred over 20 years ago; however, the lessons that can be learned will be appropriate into the twenty-first century. Tanks can fail from the effects of overpressure and underpressure in 2010 just as well as they failed in the 1980s. Incompatible chemicals are incompatible in any decade and humans can be forgetful at any time. Before we review a single case his-tory, it is time to boast about the safety record of the chemical industry.
Risks Are Not Necessarily How They Are Perceived
True risks are often different than perceived risks. Due to human curiosity, the desire to sell news, 24-hour-a-day news blitz, and current trends, some folks have a distorted sense of risks. Most often, people fear the lesser or trivial risks and fail to respect the significant dan-gers faced every day.
The Introduction to Risk—A Practical Guide. . . starts with these words:
We live in a dangerous world. Yet it is also a world safer in many ways than it has ever been. Life expectancy is up. Infant mortality is down. Diseases that only recently were mass killers have been all but eradicated. Advances in public health, medicine, environmental regulation, food safety, and worker protection have dramatically reduced many of the major risks we faced just a few decades ago. [22]
The introduction continues with this powerful paragraph:
Risk issues are often emotional. They are contentious. Disagreement is often deep and fierce. This is not surprising, given that how we perceive and respond to risk is, at its core, noth-ing less than survival. The perception of and response to danger is a powerful and funda-mental driver of human behavior, thought, and emotion. [22]
A number of thoughts on risk and the perception of risk are provided by a variety of authors. [22–29]
Splashy and Dreadful versus the Ordinary
In his 1995 article, John F. Ross states the public tends to overestimate the probability of splashy and dreadful deaths and underestimates common but far more deadly risks. [23] The Smithsonianarticle says that individuals tend to overestimate the risk of death by tornado but underestimate the much more widespread probability of stroke and heart attack. Ross further states that the general public ranks disease and accidents on an equal footing, although disease takes about 15 times more lives. About 400,000 individuals perish each year from smoking-related deaths. Another 40,000 people per year die on American highways, yet a single airline crash with 300 deaths draws far more attention over a long period of time. Spectacular deaths make the front page; many ordinary deaths are mentioned only on the obituary page.
The authors of Risk—A Practical Guide. . . reinforce that fear pattern with this quote in the introduction, “Most people are more afraid of risks that can kill them in particularly awful ways, like being eaten by a shark, than they are of the risk of dying in less awful ways, like heart disease—the leading killer in America.” [22] The appendix of this guide contains lots of sup-porting data. It reads that in 2001, two U.S. citizens died from shark attacks, and 934,110 cit-izens (1999) died of heart disease. Which one generally appears as a headline news article?
A tragic story of a 3-year-old boy in Florida (1997) illustrates this point. This young boy was in knee-deep water picking water lilies when he was attacked and killed by an 11-foot alligator. The heart-wrenching story was covered on television and in many newspa-pers around the nation. The Florida Game Commission has kept records of alligator attacks since 1948, and this was only the seventh fatality.
Voluntary versus Involuntary
When people feel they are not given choices, they become angry. When communities feel coerced into accepting risks, they feel furious about the coercion, not necessarily the risk. Ultimately the risk is then viewed as a serious hazard. To exemplify the distinction, Martin Siegel [26] writes that to drag someone to a mountain and tie boards to his feet and push him downhill would be considered unacceptably outrageous. Invite that same individual to a ski trip and the picture could change drastically.
Some individuals don’t understand comparative risks. They can accept the risk of a life-time of smoking (a voluntary action), which is gravely serious act, and driving a motorcy-cle (one of the most dangerous forms of transportation), butthey insist in protesting a nuclear power plant that, according to risk experts, has a negligible risk.
Moral versus Immoral
Professor Trevor Kletz points out that far more people are killed by motor vehicles than are murdered, but murder is still less acceptable. Mr. Kletz argues the public would be outraged if the police were reassigned from trying to catch murderers, or child abusers and instead just looked for dangerous drivers. He claims the public would not accept this concept even if more lives would be saved going after the bad drivers. [27]
Detectable Risks versus Undetectable Risks
It is normal for people to fear what they cannot detect. An experienced war correspondent said of the accident at Three Mile Island, “At least in a war you know you haven’t been hit yet.” Similarly, risks that may take years to show up are more likely to be feared. [26]
In contrast, Professor Kletz documented that more people have been killed by the col-lapse of dams than by any other peacetime artifact. [28] He explains that in August 1979, a dam collapsed in India killing a large number of people. Various reports gave various counts of fatalities, between 1,400 and 25,000. This collapse could be responsible for more deaths than the dreaded Bhopal Tragedy. Kletz asked the question why people were more concerned about chemical engineering disasters than civil engineering disasters. It could be that water is a familiar chemical and pesticides or radioactive menaces are both poorly understood and not detectable by the man on the street.
Natural versus Man-made
poisoning is an insignificant threat to Americans, when compared to cancer caused by sun worship. [22]
Agricultural pesticides, air pollution, and related chemicals (often substances bearing unfamiliar or unpronounceable names) have worried a number of people. Bruce Ames, a respected and renowned professor of molecular and cellular biology at the University of California at Berkeley, contends it is a waste of time to worry about man-made pesticides and air pollution. He argues:
Every plant has 40 to 50 pesticides it makes to kill off predators and fungi. They couldn’t survive if they were not filled with toxic chemicals. They don’t have teeth and claws, and they can’t run away. So throughout evolution they’ve been making newer and nastier pes-ticides. They’re better chemists than Dow and Monsanto. [29]
Dr. Ames also indicates that almost every plant product in the supermarket is likely to contain natural carcinogens. He estimates the typical American eats about ten thousand times more natural pesticides than the residue of man-made agricultural pesticides ingested. Thus about 99.99 percent of the pesticides we take in each day are “natural” and only 0.01 percent are man-made. (The referenced article provides a detailed discussion focusing on the fact the human body is a marvelous machine, designed to survive and prosper in a hostile world. A major section of the article describes the work of the enzymes that successfully deal with carcinogen chemical damage to our DNA.)
Bruce Ames proposes Americans should recognize all risks in their lives and develop an approach to controlling them. He states we should not worry about minor (and perhaps even nonexistent) risk, but consider eliminating major causes of cancer. Ames lists the risks: “First, of course, is smoking. Then there is the lack of fruits and vegetables in the diet. And, finally chronic infections.”
Are We Scaring Ourselves to Death?
Several years ago, ABC News aired a special report entitled, “Are We Scaring Ourselves to Death?” In this powerful piece, John Stossel reviews risks in plain talk and corrects a num-ber of improperly perceived risks. Individuals who play a role in defending the chemical industry from a barrage of bias and emotional criticism should consider the purchase of this reference. [25]
Mr. Stossel provides the background to determine the real factors that can adversely affect your life span. He interviews numerous experts, and concludes the media is gener-ally focuses on the bizarre, the mysterious, and the speculative—in sum, their attention is usually directed to relatively small risks. The program corrects misperceptions about the potential problems of asbestos in schools, pesticide residue on foods, and some Superfund Sites. The video is very effective due to the many excellent examples of risks.
The ABC News Special provides a Risk Ranking table that displays relative risks an indi-vidual living in the United States faces based on various exposures. The study measures anticipated loss of days, weeks, or years of life when exposed to risks of plane crashes, crime, driving, and air pollution.
of the economic scale. Poverty kills when people cannot affordgood nutrition, top-notch medical care, proper hygiene or safe, well-maintained cars. In addition, poverty-stricken people sometimes also consume more alcohol and tobacco than the general population.
ABC News experts developed a Risk Ranking table (see Table 1−1) based upon three years of research with risk management experts. The assumption is that each of these activ-ities are measured as independent variables and each has a detrimental effect on your life span.
Plant Employee Safety versus Life-style Choices
The Chemical Manufacturers Association, CMA, publishes a 57-page booklet entitled Risk Communication, Risk Statistics, and Risk Comparisons: A Manual For Plant Managers. [30] It is a practical guide that effectively explains information on chemical risks. The booklet provides concrete examples of risk comparisons and offers two pages of warnings on use of such data. “Warning notes” within the publication suggest that the accuracy of the data cannot be guaranteed, and some of the data could be outdated. Additional “warning notes” state that the typical risk data is a hodgepodge of information or risks characterized by dif-ferent levels of uncertainty. However, this booklet offers 13 tables or charts of very inter-esting comparisons, as many of the factors that are hyped as dangerous are low in these tables. The data in Table 1–2 is part of the CMA’s booklet and it was adapted from “A Catalog of Risks.” [31] Table 1–2 only lists 16 of the 48 causes.
The Chemical Industry’s Excellent Safety Record
Many individuals who depend on television and radio for information probably believe that working in a chemical plant is a hazardous occupation. This myth is exposed by facts from the Bureau of Labor Statistics: chemical plant employees enjoy one of the safest occu-pations. With all the federal pressures on the chemical industry to reduce injuries even fur-ther, it is astonishing that the second leading cause of death for the entire U.S. workplace was homicide in 1995.
Yes, according to the 1995 U.S. Bureau of Labor Statistics, 16 percent of the deaths in the workplace were homicides. [32] The leading cause of deaths in the workplace were highway traffic vehicle-related accidents, which accounted for 21 percent of the 6,210 deaths in the workplace.
TABLE1–1 Potential Risks and the Estimated Loss of Life Expectancy
Airplane Travel 1 Day
Hazardous Waste 4 Days
House Fires 18 Days
Pesticides (an Extreme Position) 27 Days
Air Pollution 61 Days
Crime Threats (Murder) 113 Days
Driving 182 Days
Smoking (the Effects on the Smoker) 51⁄ 2Years
A serious knowledge gap looms between informed individuals and many of the skeptics. Risks and perceptions of risks of the presence of chemical plants are often misunderstood. Note this quotation on perceptions (author unknown):
We are measured not by what we are, but by the perception of what we seem to be; not what we say, but how we are heard,
and not what we do, but how we appear to do it.
The chemical industry is typically held to much higher standards and viewed with sus-picion of their risks by the public at large. This is due to the experience of plants in coun-tries like India and Mexico following reports of casualties among hundreds of innocent people living in the shadow of a plant, refinery, or terminal that released a poisonous gas or experienced a massive fire. This is not the experience of the American and British chem-ical plants in the United States and the United Kingdom, who have handled their business much better. In a recent article in Chemical Engineering,Isodore (Irv) Rosenthal, a Senior Research Fellow of the Warton School’s Risk Management and Decision Processes Center (Philadelphia), states that no person has been killed outside the fence-line of a U.S. plant during an accident over the past 50 years. [33] Trevor Kletz has reported that no person has been killed outside of a British plant during an accident in over 100 years. However, there have been individuals killed from chemicals released during transportation accidents.
Who Has the Most Dangerous Jobs?
You might be surprised who has the most dangerous jobs. They are not the employees you first think about. The U.S. Bureau of Labor Statistics (BLS) provides an interesting insight to the safety of workers. The Census of Fatal Occupational Injuries administered by the BLS, in conjunction with participating state agencies, compiles comprehensive and timely information on fatal work injuries occurring in the 50 states and the District of Columbia.
TABLE1–2 Estimated Loss of Life Expectancy by Life-style and Other Causes
Cigarette Smoking (Males) 2250 Days Being 30 Percent Overweight 1300 Days
Being a Coal Miner 1100 Days
Being 20 Percent Overweight 900 Days Cigarette Smoking (Female) 800 Days
Cigar Smoking 330 Days
Dangerous Jobs (Accidents) 300 Days Motor Vehicle Accidents 207 Days Alcohol (U.S. average) 130 Days Being Murdered (Homicide) 90 Days Average Jobs (Accidents) 74 Days
Drowning 41 Days
Falls 39 Days
Safest Jobs (Accidents) 30 Days
Coffee 6 Days
Guy Toscano, an economist in the Office of Safety, Health and Working Conditions, Bureau of Labor Statistics provides this easy-to-understand, thought-provoking article. It is quoted verbatim with his permission. [32]
Dangerous Jobs
What is the most dangerous occupation in the United States? Is it truck driver, fisher, or elephant trainer? The public frequently asks this question, as do the news media and safety and health professionals. To answer it, BLS used data from its Census of Fatal Occupational Injuries (CFOI) and Survey of Occupational Injuries and Illnesses (SOII).1
How to Identify Dangerous Jobs
There are a number of ways to identify hazardous occupations. And depending on the method used, different occupations are identified as most hazardous. One method counts the number of job-related fatalities in a given occupation or other group of workers. This generates a fatal-ity frequency count for the employment group, which safety and health professionals often use to indicate the magnitude of the safety and health problem. For example, truck drivers have the largest number of fatalities and accounted for about 12 percent of all the job-related fatal-ities in 1995 (see Table 1–3). But this number is influenced not only by the risk workers face in that occupation, but also by the total number of workers in the occupation.
The second method, fatality rates, takes into account the differing total numbers among occupations. It is calculated by dividing the number of job-related fatalities for a group of workers during a given period by the average number of workers during that period.2This
1Data on fatal work injuries are from the Bureau of Labor Statistics’ Census of Fatal Occupational Injuries
(CFOI), 1995. This program, which has collected occupational fatality data nationwide since 1992, uses diverse data sources to identify, verify, and profile fatal work injuries. Information about each workplace fatality (occu-pation and other worker characteristics, equipment being used, and circumstances of the event) is obtained by cross-referencing source documents, such as death certificates, workers’ compensation records, and reports to Federal and State agencies. This method assures counts are as complete and accurate as possible.
The Survey of Occupational Injuries and Illnesses (SOII) collects information from a random sample of about 250,000 establishments representing most of private industry. Worker characteristics are collected only for those workers sustaining injuries and illnesses that require days away from work to recuperate.
Because the scope and methodology of CFOI and SOII are slightly different, comparison of the fatal and non-fatal data is problematic.
For more information on either CFOI or SOII, access the World Wide Web at http://stats.bls.gov/osh-home.htm or e-mail ([email protected]).
2There is more than one method to calculate fatality rates that measure the incidence of fatal work injuries for
groups of workers. An hours-based rate measures the risk of fatality per standardized length of exposure; an employment-based rate measures the risk for those employed during a given period of time.
rate depicts a worker’s risk of incurring a fatal work injury within the employment group and is expressed as the number of fatalities per a standard measure. For example, the fatality rate for truck drivers is 26.2 deaths per 100,000 workers (see Table 1–3). When occupations are ranked by fatality rates, truck drivers become the ninth most dangerous occupation.
The fatality rates in Table 1–3 relate the total number of job-related deaths in 1995 to the annual average number of workers facing that risk for various groups. These measures
TABLE1–3 Guy A. Toscano’s Compilation of Occupations with the Largest Number of
Fatalities, Rates, Relative Risk, and Leading Causes during 1995
Index of Leading Fatal Fatality Employment Fatality Relative Event Occupation Count (in thousands) Ratea Risk (in percent)
TOTAL 6,210 126,248 4.9 1.0
Truck Driver 749 2,861 26.2 5.3 Highway crashes (68) Farm Occupations 579 2,282 25.3 5.1 Vehicular (50)
Construction 309 780 39.5 8.1 Vehicular
Laborers (28); Falls (27)
Supervisors, 212 4,480 4.7 1.0 Homicide (63)
Proprietors, Sales
Nonconstruction 212 1,337 15.8 3.2 Vehicular (36) Laborers
Police, Detectives, 174 1,051 16.6 3.4 Homicide (47);
and Supervisors Highway (28)
Electricians 117 736 15.9 3.2 Electrocutions (59)
Cashiers 116 2,727 4.3 .9 Homicide (92)
Airplane Pilots 111 114 97.4 19.9 Airplane crashes (98)
Guards 101 899 11.2 2.3 Homicide (58)
Taxicab Drivers 99 213 46.5 9.5 Homicide (70)
Timber Cutters 98 97 101.0 20.6 Struck by object (81)
Carpenters 96 1,255 7.6 1.6 Falls (43)
Groundkeepers 77 832 9.3 1.9 Vehicular (31)
and Gardeners
Welders and 72 604 12.0 2.4 Falls (22); Fires (18) Cutters
Roofers 60 205 29.3 5.9 Falls (75)
Fishers 48 45 104.4 21.3 Drowning (81)
Auto Mechanics 47 819 5.7 1.1 Highway (21);
Homicide (13)
Structural Metal 38 59 64.4 13.1 Falls (66)
Workers
Electric Power 35 126 27.8 5.7 Electrocutions (60) Install/Repairers
aExcludes fatalities involving workers under 16 years of age because they are not covered by CPS.
Rate = (Fatal work injuries ÷ Employment ×100,000 workers). Employment is based on 1995 CPS.
Index of Relative Risk = Fatality rate for a given group ÷ Fatality rate for all workers.
are considered experimental because they do not reflect the movement of persons into and out of the labor force, the length of their work week or work year, or the effect of holding multiple jobs.
Another method of expressing risk is an index of relative risk. This measure is calculated for a group of workers as the ratio of the rate for that group to the rate for all workers.3The
index of relative risk compares the fatality risk of a group of workers with all workers. For example, the relative risk for truck drivers in Table 1–3 is 5.3, which means that they are roughly five times as likely to have a fatal work injury as the average worker.
Analysis of dangerous jobs is not complete, however, unless data on nonfatal job-related injuries and illnesses are examined.
Table 1–4 shows those occupations with the largest number of nonfatal injuries and ill-nesses, along with days away from work to recuperate. This table shows that truck drivers also lead the list for the occupations with the largest number of nonfatal injuries and ill-nesses. It also shows the chance of incurring an occupational injury or illness which is expressed as the total number of workers in the employment group compared with the number of workers injured in that group. For example, the chance of a truck driver having a serious injury is 1 in 15, meaning that for every 15 truck drivers one will have a serious injury during the year. But laborers and nursing aides and orderlies have a greater chance of injury or illness than truck drivers (see Table 1–4).
Median days away from work to recuperate is yet another measure that can be used to evaluate dangerous jobs. (Median days is an average such that half of those injured take more than the median days to recuperate while the other half require fewer days.) The median days to recuperate from an injury for the 10 occupations listed are highest for truck drivers and carpenters, each showing a median of 8 days to recuperate, compared to all workers who had a median of 5 days.
Based on the index of relative risk in the chart, truck driver is not the most dangerous occupation. This distinction belongs to fishers. Commercial fishers are about four times as likely as truck drivers to be killed by a fatal work incident (21.3 and 5.3, respectively).
Using this method of analysis, one could in fact identify even more dangerous occupa-tions like elephant trainers who in some years have had two work fatalities. Based on employment figures of about 600 known elephant trainers in the United States, this would produce a fatality rate of 333 per 100,000 workers and a relative risk that is 68 times greater than for the typical worker. Clearly, in this analysis an elephant trainer has the highest risk of a fatal work injury even though the frequency is low or nonexistent in some years. The purpose of this example is to illustrate the importance of viewing frequency counts, fatal-ity rates, and indexes of relative risk to discern dangerous jobs.
The occupations identified by the frequency risk techniques and a chance of injury can be used to target prevention efforts and may reduce both the number and rates of fatalities and injuries for those workers at highest risk.
Characteristic of Dangerous Jobs
Today, the jobs that have the highest fatality rates and frequency counts are found in out-door occupations or occupations where workers are not in an office or factory. These
include truck drivers, farmers, construction laborers, and airplane pilots. Most of these workers have one thing in common: they are affected by severe weather conditions, while driving on highways, flying airplanes, performing farm chores, or working on construction sites. Highway crashes are the primary cause of trucker fatalities, falls are the leading cause of death for construction laborers, and tractor rollovers account for one of every three farm-worker fatalities.
Homicide is another serious concern in some job settings. In 1995, homicide accounted for 16 percent of job-related fatalities. Workers most at risk are those who work late at night, work alone, and handle money. Taxicab drivers are the most susceptible and have a relative risk about 10 times higher than the typical worker. Other occupations that have a high relative risk of homicide include police and guards.
For jobs with high numbers of nonfatal injuries and illnesses, overexertion is the leading event. These injuries result from lifting objects or, in the case of nursing aides and order-lies, patients. Injuries from overexertion accounted for about one third of all the nonfatal injuries in 1994; it took a median of five days for those injured to recuperate.
Two occupations appear on both the fatal and nonfatal lists: truck drivers and construc-tion laborers. But the leading event for fatal and nonfatal incidents for each occupaconstruc-tion is
TABLE1–4 Guy A. Toscano’s Compilation of Occupations with the Largest Number of
Injuries and Illnesses with Days Away from Work to Recuperate during 1994
Total Median Leading
Nonfatal Days Chance Nonfatal
Cases (in Employment to of Event (in Occupation thousands) (in thousands) Recuperate Injury percent)
All Occupations 2,252.6 92,973 5 1:41
Occupations Listed 726.5 14,636 6 1:20 Overexertion (27)
Truck Drivers 163.8 2,438 8 1:15 Overexertion (29)
Nonconstruction 147.3 1,137 5 1:08 Contact with
Laborers object (35)
Nursing Aides 101.8 1,359 5 1:13 Overexertion (59)
and Orderlies
Janitors and 60.6 1,407 6 1:23 Overexertion (27)
Cleaners
Construction 55.7 674 6 1:12 Contact with
Laborers object (39)
Assemblers 53.0 1,167 6 1:22 Contact with
object (31)
Carpenters 37.4 869 8 1:23 Contact with
object (38)
Stock Handlers 37.2 1,121 5 1:30 Overexertion (37)
and Baggers
Cooks 36.3 1,838 5 1:51 Contact with
object (33)
Cashiers 35.6 2,626 6 1:74 Overexertion (27)
different. For truck drivers, 68 percent of the job-related fatalities are from highway crashes, whereas overexertion is the leading nonfatal event, accounting for 29 percent of the incidents. For construction laborers, the leading fatal events are falls and vehicular-related incidents such as being struck by a backhoe. For nonfatal incidents, the leading event is contact with objects, primarily equipment and tools used on construction sites.
This difference between the leading cause of a fatal and nonfatal injury for truck drivers is important because it suggests different kinds of prevention efforts. For example, to reduce highway crashes, driver training and proper maintenance of trucks is essential, whereas, to reduce the incidence of overexertion, proper lifting techniques must be taught along with proper use of lifting equipment. For construction laborers, prevention programs for fatal events require awareness of the hazards of falling off buildings, ladders, scaffold-ings, and other structures while for serious nonfatal injuries, prevention would focus on the proper use of tools.
Relative Risks Compared to the Chemical Industry Jobs
Mr. Toscano’s Relative Risk Table (see Figure 1–1) is very revealing. The typical man on the street in southwestern Louisiana (a region rich in fishing, timber, rice farming, and petro-leum refineries and chemical plants, as well as anti-industry news reporters and overeager attorneys) would be puzzled with the facts. Over the years the media has shepherded the average person into believing that the chemical industry is very dangerous. This is partially enforced by a very few isolated disastrous worldwide incidents and the associated painful suffering.
The news media reinforcement is subtle in misconceptions on risk of chemical plants. They provide selected news coverage. No doubt there are many poor unfortunates in
south-All Occupations
Farm Occupations
Truck Drivers
Electric Power Installers
Roofers
Construction Laborers
Taxicab Drivers
Structural Metal Workers
Airplane Pilots Timber Cutters Fishers 1.0 5.1 5.3 5.7 5.9 8.1 9.5 13.1 19.9 20.6 21.3
0 5 10 15 20 25
FIGURE1–1 Guy A. Toscano’s compilation of occupations with the largest number of injuries and illnesses with days away from work to recuperate during 1994.
western Louisiana who die harvesting shrimp, oysters, blue crabs, pogy fish, and edible fish. Their demise is not a top story. No news reporter takes a photo of the water or the boat that steals the hard worker’s life. Or in the case of the timber cutter that perished, no one takes a photo of the tree that struck the deceased or a photo of the chain saw that was involved in the tragic accident. These incidents usually appear in the back of the paper, or only the worker’s name, age, next of kin, and personal information get published on the obituary page. However, if a chemical plant has a small fire or a small release that slightly injures or hos-pitalizes two or three individuals, intense media coverage usually follows. A television reporter will often arrive just outside the front gate and broadcast with the company logo in the back-ground. In the case of the print media, it will be a front-page story.
The chemical industry is held to a higher standard of safety. Those of us in industry must accept that burden of responsibility and strive even harder to reach the goal of an accident-free environment.
Just How Dangerous Is It to Work in a U.S. Chemical Plant?
Mr. Toscano provides some 1995 relative risk fatality statistics which compare several indus-tries relative risk with the occupations described above in his “Dangerous Jobs” article. These numbers are specific to 1995 and involve fatalities, not major injuries. On a typical day about 17 workers in the United States are killed on the job. Thank goodness that job-related fatalities are relatively infrequent for specific standard industry classifications (SIC code), but a large incident in any industry may skew the information from year to year.
The statistics about truck driving show that job to be relatively dangerous. However, if trucking is considered as an industry the risk numbers are diluted since the employees of that industry include not only the drivers (a dangerous job) but also the clerical, sales, dis-patching, repair, and other support groups, which have significantly lower exposures.
Given the above disclaimers, Mr. Toscano provided the following: The Chemical and Allied Products classification (SIC Code 28) experienced 38 deaths out of a reported 1,289,000 employees (in 1995). This is a relative risk of 0.6, lower than relative risk of the average job (1.0). The 1995 statistics for the Petroleum Refining classification (SIC Code 291) include 13 fatalities out of a listed 151,000 employees. The relative risk is 1.8.
Contrast these relative risk numbers to the Trucking and Warehousing classification (SIC 42) of 4.1 and the relatively safe Finance, Insurance and Real Estate group, which was 0.4 (see Table 1–5).
TABLE1–5 1995 Relative Risks of Fatal Accidents in the Workplace Using
Mr. Toscano’s Relative Risk Index
Fishers (an occupation) 21.3
Timber Cutters (an occupation) 20.6
Taxicab Drivers (an occupation) 9.5
Trucking and Warehousing Industry (an industry) 4.1
Petroleum Refining 1.8
Average Job 1.0
2001 Update on the Relative Risk of Working in a Chemical Plant
Mr. Toscano’s method of relative risk fatality statistics was applied to the latest Bureau of Labor Statistics data (2001). Note that fishers, timber cutters, and airline pilots were the riskiest jobs in 1995 and the most deadly in 2001. The data also show that the rate of accidental deaths (2001) in a chemical plant is lower than that of working in a grocery store. [34]
Just How Dangerous is it to Work in a Chemical Plant in the
United Kingdom?
The British have published risk statistics associated with different jobs for several decades. Dr. Frank Lees’s epic three-volume masterpiece, Loss Prevention in the Process Industries,is without a doubt the premier source of practical and statistical process safety reference mate-rial. Within the 3,962 pages of valuable facts, Dr. Lees has published fatal accident rates (FAR). [35]
The FAR was developed to avoid the use of confusing, small fractions. The FAR is the number of deaths from industrial injury expected by a group of 1,000 employees during a 50-year working career with the employee working 40 hours a week for 50 weeks a year (or the number of deaths expected per 100,000,000 employee working hours). FAR data are fatal accident rates or the probability of death in 108hours of exposure and they are
com-piled by the British Health and Safety Executive. The Health and Safety Executive has many responsibilities comparable to the U.S. Department of Labor’s Occupational Safety and Health Administration. The U.K. statistics appear somewhat similar to the U.S. num-bers in that the fishing, construction, and agriculture industries have significantly higher fatal accidents than the chemical industry does.
TABLE1–6 2001 Relative Risks of Fatal Accidents in the Workplace of Selected
Occupationsa
Using a Relative Risk Index
Fishers (as an Occupation) 35.1
Timber Cutters (as an Occupation) 29.7
Airplane Pilots (as an Occupation) 14.9
Garbage Collectors 12.9
Roofers 8.4
Taxi Drivers 8.2
Farm Occupations 6.5
Protective Services (Fire Fighters, Police Guards, etc.) 2.7
“Average Job” 1.0
Grocery Store Employees 0.91
Chemical and Allied Products 0.81
Finance, Insurance and Real Estate 0.23
aThis data excludes a total of 2,866 work-related deaths due to the September 11 terrorist attacks.
Fatal Risks Data for Various Activities in the United
Kingdom
Some British authors from the chemical industry began discussing risks to employees using a concept of “Fatal Accident Rates” (FAR), as they were called in the early 1970s. There were widely published articles explaining the risks of the 1960s and 1970s.
In 1992, Dr. Edmund Hambly provided more current Fatal Accident Rate information on the United Kingdom in the article, “Preventing Disasters.” [36] Dr. Hambly covered 27 individual activities, including such diverse risks as the “Plague in London in 1665” (with a FAR of 15,000) to a present-day fatality by a “Terrorist Bomb in the London Area” (with a FAR of 0.01). Table 1–8 provides his numbers on risks of six different activities. In addi-tion, I have compared Dr. Frank Lees’s numbers for the last two risk figures. [35]
How Are the Chemical and Refinery Industries Doing When
It Comes to Major Losses?
This first chapter stresses the general safety and low risk rates of employees in the chemi-cal and petroleum-refining industries. It also appears to some observers that World-Class
TABLE1–7 1987–90 Fatal Accident Rate (FAR) in Different Industries and Jobs in the
United Kingdom
Industry or Activity Fatal Accident Rate
Offshore Oil and Gas 62
Deep Sea Fishing 42
Construction 5
Agriculture 3.7
Chemical and Allied 1.2
All Manufacturing Industries 1.2
Clothing Manufacture 0.05
TABLE1–8 Risks of Death of Various Activities in the United Kingdom
Fatal Accident Frequency Ratesa
Travel by Car 30
Average Man (aged 30–40) from accidents 8 Average Man (aged 30–40) from diseases 8
Factory Work (average) 4
Accidents at Home (all ages) 4
Accidents at Home (able-bodied) 1
All Manufacturing Industriesb 1.2
Chemical and Allied Industriesb 1.2
aThis compilation compares the relative order of safety of the chemical industry to other industries, such as
construction and transportation, using up-to-date FAR. This relative safety must be kept in mind as we review the case histories in the rest of this book.
Plants have placed the OSHA Process Safety Management Activities into the hands of the right people with the right motivation, the correct training, and sufficient resources to get the job done. Therefore, it would be easy to conclude that major losses are drastically declining since the 1992 Process Safety Management Regulation has been promulgated and the United States Chemical Safety Board has become active.
Despite excellent efforts in the field of process safety, there are some serious questions challenging whether enough is being done to reduce major losses. It is disappointing to note that one reputable, highly published source declares that property damage losses in U.S. refineries and U.S. chemical plants have not dramatically decreased in the past decade. In February 2003, Marsh’s Risk Consulting published The 100 Largest Losses 1972–2001, documenting significant increases in losses in their last 5-year interval. This publication is based upon 5,400 records over a 30-year period, so there is depth to this study. The reports consider financial losses and generally do not include human fatalities and misery. [37]
Page 1 of The 100 Largest Losses 1972–2001states:
Losses in the refinery industry have continued to increase over the last few years, and the causes highlight the aging facilities in this category. A significant number of larger losses (over $10,000,000) have been caused by piping failures or piping leaks leading to fires and/or explosions. Several large losses due to piping failures were due to corrosion issues or using the wrong metallurgy. [37]
The Marsh Risk pamphlet continues on page 23 with comments on losses in petro-chemical plants:
As with losses in the refinery category, the number of losses in the petrochemical industry have also continued to increase over the last few years, with the exception of facilities located outside the United States. Outside the U.S., the number of losses in recent years has actually declined. Losses in recent years have been attributed to piping failures and man-agement system failures.
Refinery Losses in 5-Year Intervals U.S.
148 132 98
0 20 40 60 80 100 120 140 160
1997-01 1992-96 1987-91
FIGURE1–2 Courtesy of Marsh’s Risk Consulting Practice.
[image:35.488.71.418.408.576.2]A closer look at Figures 1-2 and 1-3 show signs that process safety principles are arrest-ing the rate of increase in the United States and providarrest-ing a sharp decline in high dollar-value losses outside the United States.
Recent loss history (from the preceeding graphs) suggests that our work is far from done. This states that we must continue to provide resources and increase our energy expended on effectively practicing chemical process safety.
Petrochemical Losses in 5-Year Intervals U.S.
103 98 58
0 20 40 60 80 100 120
1997-01 1992-96 1987-91
FIGURE1–3 Courtesy of Marsh’s Risk Consulting Practices.
Petrochemical Losses in 5-Year Intervals Outside U.S.
226
317 140
0 50 100 150 200 250 300 350
1997-01 1992-96 1987-91