Further Reading
Albert K (1997) SupercriticalSuid chromatography}proton magnetic resonance spectroscopy coupling. Journal of Chromatography A785: 65.
Berg BE, Hegna DR, Orlien N and Geibrokk T (1992) Preliminary study of speciRc migration of polymer addi-tives from polypropylene to an acid-based food simu-lent.Journal of High Resolution Chromatography15: 837.
Berger TA (1995) Packed Column SFC. London: Royal Society of Chemistry.
Carrot MJ, Jones DC and Davidson G (1998) Identi-Rcation and analysis of polymer additives using packed-column supercritical Suid chromatography with APCI mass spectrometric detection.Analyst 123: 1827.
Combs MT, Ashraf-Khorassani M and Taylor LT (1997) Packed column supercritical Suid chromatography} mass spectroscopy: a review.Journal of Chromatogra-phy A785: 85
GaKchter R and MuKller H (1990)Plastics Additives Hand-book. Munich: Hanser.
Geibrokk T, Berg BE, Hoffman Set al. (1990) Characterisa-tion of polymer additives by capillary supercriticalSuid chromatography and by liquid chromatography.Journal of Chromatography505: 283.
Handley A (1993) Polymer Characterisation, Glasgow: Blackie.
Kithinji JP, Bartle KD, Raynor MW and Clifford AA (1990) Rapid analysis of polyoleRn antioxidants and light stabilisers by supercriticalSuid chromatography. Ana-lyst115: 125.
MacKay GA and Smith RM (1993) SupercriticalSuid ex-traction and chromatography}mass spectroscopy of Same retardants from polyurethane foams.Analyst118: 741.
Moulder R, Kithinji JP, Raynor MW et al. (1989) Analysis of chemical additives in polypropylene Rlms using capillary supercritical Suid chromato-graphy. Journal of High Resolution Chromatography 12: 688.
Raynor MW, Bartle KD, Williams Aet al. (1988) Polymer additive characterisation by capillary supercriticalSuid chromatography/fourier transform infrared microspec-trometry.Analytical Chemistry60: 427.
Ryan TW, Yocklovich SG, Watkins JC and Levy EJ (1990) Quantitative analysis of additives in polymers using supercritical Suid extraction}supercritical Suid chromatography. Journal of Chromatography 505: 273.
Smith RM (1988) Supercritical Fluid Chromatography. London: Royal Society of Chemistry.
Wieboldt RC, Kempfert KD and Dalrymple DL (1990) Analysis of polyethylene using supercriticalSuid extrac-tion/supercriticalSuid chromatography and infrared de-tection.Applied Spectroscopy44: 1028.
POLYMERS
Field Flow Fractionation
M. E. Schimpf, Boise State University, Boise, ID, USA
Copyright^ 2000 Academic Press
Introduction
Two subtechniques of the Reld-Sow fractionation (FFF) family are used to separate polymers with high resolution on an analytical scale; these are thermal FFF (ThFFF) and Sow FFF (FlFFF). For lipophilic polymers, ThFFF excels in the analysis of high-molecular-weight-polymers (M'106g mol\1) and gel-containing polymers. ThFFF can also separate polymer blends and copolymers according to chem-ical composition. For hydrophilic polymers, FlFFF compares well with size-exclusion chromatography (SEC) for the analysis of polymers with M'103g mol\1, and like ThFFF, excels when
M'106g mol\1. By varying factors that control re-tention, each FFF application can be optimized, and programming such factors allows highly polydisperse samples to be analysed with unparalleled precision in a single run. FFF channels are more expensive than SEC columns, but with proper maintenance, channel lifetimes are virtually unlimited.
Figure 1 Illustration of the separation mechanism in FFF. The field compresses larger material into a thinner layer against the accumulation wall, where they move more slowly.
Figure 2 Schematic diagram of the FFF instrument.
A computer is used to control the appliedReld and to store the detector signal. Samples are injected with a microsyringe, either directly or via an injection valve.
One of the greatest strengths of FFF is its ability to directly measure physicochemical parameters on analyte components using well-deRned models of retention. In FlFFF, for example, the diffusion coefR c-ient (D) can be calculated directly from a
[image:2.568.110.447.520.698.2]of ThFFF is that band broadening is well deRned, allowing for the determination of highly precise mo-lecular-weight determinations.
Besides its placid nature and theoretical tractabil-ity, another attractive feature of FFF is its applicabil-ity to a wide variety of materials and situations. For example, FlFFF has been used to separate materials ranging in size from 103 to 1018g mol\1. However, Sexibility comes with a price, and the user must understand the separation mechanism in order to apply FFF to new and different samples with efR cien-cy. Outlined below are the more common applica-tions of both ThFFF and FlFFF for polymer analysis with comparisons, when appropriate, to SEC.
Principles and Theory of Retention
The FFF channel has the shape of a ribbon (Figure 1), with a length of typically 30}50 cm, a breadth of 1}3 cm, and a typical thickness of 0.05}0.25 mm. A stream of carrier liquid is introduced at one end of the channel and exits at the other end. Since the channel has a high aspect ratio, the Sow of carrier liquid is laminar, with a parabolic velocity proRle across the thin dimension. AReld is applied across the thin dimension, and a mixture to be separated is injected at the inlet end of the channel. As the mixture is transported by carrier liquid to the outlet, interac-tions with theReld compress the sample against one wall, where slower streamlines exist. The concentra-tion of sample at the accumulaconcentra-tion wall is opposed by diffusion, and the result is a sample cloud with a con-centration that decreases exponentially with distance from the wall. Components that interact differently with theReld will form zones of different thickness at the accumulation wall. The dependence of zone thicknesslon the forceFof the interaction with the Reld is:l"kT/F [1]
where k is Boltzmann’s constant and T is temper-ature. The thickness of the zone determines the extent to which its migration through the channel is re-duced.
The extent to which an analyte is retained in FFF can be speciRed, as in chromatography, by its reten-tion ratioR:
R"t3/tr"V3/Vr [2]
where tr and Vr are the time and volume of carrier liquid, respectively, required to Sush a component through the channel; the void timet3and void volume V3 are the analogous parameters for a component
that does not interact with theReld. The dependence of retention ratioRon zone thicknesslis:
R"6l
w
coth 1 2l/w!2l
w
[3]The ratiol/wis given the symbol, and is referred to as the retention parameter, since it alone describes the relative migration of a component zone. As P0,RP0, and the analyte does not move through the channel. As PR,RP1, and the analyte moves at the average velocity of the carrier liquid. As is reduced, the bracketed term in eqn [3] approaches unity, so that for many applications the relationship betweenRandis described by the following simple equation:
R"6 [4]
The retention ratio of an eluting component can be determined experimentally through eqn [2] and trans-lated into avalue using eqn [3]. Values of, in turn, can be related to physicochemical properties of the analyte, as discussed below.
The properties that governF(or ) vary with the nature of the appliedReld, i.e. with the FFF subtech-nique. In all sub-techniques, however, retention va-ries directly with the magnitude of the appliedReld. This relationship facilitates tuning theReld in order to optimize each application, so that routine analyses can be performed with maximum efRciency. For high-ly pohigh-lydisperse samples, the magnitude of the Reld can even be programmed in order to reduce the separ-ation time of such samples. Field programming is analogous to temperature programming in gas chromatography and gradient elution in liquid chromatography.Figure 3 illustrates the ThFFF sep-aration of seven polymer standards ranging in Mfrom 9000 to 5.5;106g mol\1 in a single run.
Thermal FFF
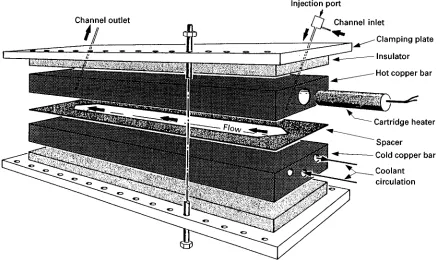
In ThFFF, the appliedReld is a temperature gradient formed by heating and cooling, respectively, the two walls that deRne the thin dimension of the channel. A schematic of the ThFFF channel is illustrated in Figure 4. When placed in a temperature gradient, polymers migrate toward the lower temperature. This effect, which in known as thermal diffusion, governs the retention parameter () in the following way:
Th" D DTT
[5]
Figure 3 Separation of a seven-component mixture by ThFFF with field programming. Values above peaks are molecular weights expressed as;103g mol\1. Reprinted with permission from J. C. Giddings, V. Kumar, P. S. Williams and M. N. Myers (1990). In: Craver D and Provder T (eds)Polymer Characteriza-tion by Interdisciplinary Methods, ACS Advances in Chemistry Series No. 227, C. Washington, D.C.: ACS Publications.
Figure 4 Basic design of the ThFFF channel, which is formed by a spacer sandwiched between two nickel-coated copper bars. One of the bars is heated while the other is cooled.
the temperature drop across the channel. Equation [5] is actually an approximation because of an as-sumption that the temperature gradient is constant; this is not strictly true because solvent thermal con-ductivity changes with temperature across the chan-nel. In fact, eqn [3] is also an approximation for ThFFF because of the temperature dependence of the solvent viscosity, which leads to a skewed velocity
proRle. Various approaches have been used to reRne eqns [3] and [5] in order to account for such temper-ature effects (see Martin, 1998), but for routine poly-mer analysis such reRnements are not necessary.
The dependence ofThonD/DTmeans that neither D norDT can be computed by itself, only the ratio D/DT. Fortunately, DT is independent of molecular weight and branching conRguration for a given poly-mer}solvent system, at least for random-coil homopolymers. As a result,This a linear function of Dfor a given system whenTis held constant. Thus, onceDT is determined for a given system, values of D can be calculated directly from measurements of Thin that system.
SinceDTis independent of molecular weightM, the separation of polymers by ThFFF is rooted, like SEC, in the dependence of D on M; that dependence is given by the following expression:
D"kT 60
10NA 3M[]
1/3
[6]
[image:4.568.64.504.423.683.2]Figure 5 Basic design of the flow FFF channel. In the symmet-rical channel (top), the channel spacer is sandwiched between two frits, which allow carrier liquid to flow across the thin dimen-sion of the channel. In the asymmetrical channel (bottom), a solid plate replaces the upper frit, which is transparent in order to see inside the channel during operation.
Flow FFF
In FlFFF, the appliedReld is a Sow of carrier liquid across the thin dimension of the channel. This cross-Sow is made possible by constructing one or both channel walls with a fritted material that is permeable to the carrier liquid (Figure 5). As a result, theS ow-ing liquid has two perpendicular vectors. The axial-Sow vector lies along the length of the channel, has a parabolic velocity proRle across the thin dimension, and carries sample through the channel as in other FFF subtechniques. The cross-Sow vector is directed across the channel, has a relativelySat velocity pro-Rle, and serves as the appliedReld by physically trans-porting material to the accumulation wall. A semipermeable membrane placed against the accu-mulation wall prevents analyte from penetrating the wall, while allowing the carrier liquid to pass through.
FlFFF employs one of two channel designs. E In the symmetric design (SyFlFFF), both the
accu-mulation wall and the (opposite) depletion wall are
porous, and the axialSow and crossSow are con-trolled independently with separate pumps. E In the asymmetric design (AsFlFFF), the depletion
wall is replaced with a glass plate so that a single inlet stream serves as the source for both axialSow and crossSow.
The relative magnitudes of the twoSow vectors are controlled by adjusting the relative amount of back-pressure applied at the axial outlet versus the cross-Sow outlet. In contrast to the symmetric design, the axial velocity diminishes along the length of an asym-metric channel asSuid is lost through the accumula-tion wall. To compensate for this effect, the width of the asymmetric channel is tapered from inlet to out-let. However, except for a speciRc ratio of cross-to-axialSow rates, the axial velocity will still vary along the length of the channel. Therefore, for AsFlFFF, eqn [3] is not valid and must be replaced with:
R"t3 tr
"w6
w
e(\x/l)B(x)xdx!1 w
w
e(\x/l)B(x)x2dx
w
e(\x/l)B(x)dx
[7a]
Herexis the distance from the accumulation wall:
B(x)"1!x 2
w2# x3
2w3 [7b]
and:
t3"V3 VC
ln
1#VC Vout1!
w
boz!(bo!bL)(z)2
2L !y
V3
[7c]
where VCand Vout are the volumetric rates of Sow thorough the cross-Sow and axial-Sow outlets, re-spectively. Parametersbo andbLare the breadths of the channel at the sample inlet and outlet, respective-ly,zis the distance between the carrier inlet and the focusing position (discussed below), andyis the area reduction of the accumulation wall due to the tapered inlet (seeFigure 5).
symmetric design are: (1) the axial Sow and cross Sow can be controlled independently, and (2) the equations relatingRtoare simpler.
In both FlFFF channel designs, the cross Sow pushes all components with the same velocity (U) toward the accumulation wall. As a result, only the opposing motion of diffusion governs retention:
F" D Uw"
DV3 VCw2
[8]
Like ThFFF, the well-established inverse dependence of on Reld strength impartsSexibility and allows Reld programming, so that the most efRcient possible method can be developed for each application.
Application to Polymer
Within the FFF family, the choice between thermal andSow FFF is a simple one for polymer analysis. In general, FlFFF is used for hydrophilic polymers, while ThFFF is best suited to lipophilic polymers. In either case, an advantage that FFF has over SEC is its greater peak capacity. In principle, Vr is unlimited in FFF, although 20 channel volumes represent a practical limit. In SEC, Vr is limited at the high end by the permeation volume (equal to one column volume), and at the low end by the exclusion volume.
Lipophilic Polymers
For lipophilic polymers with M(104g mol\1, ThFFF suffers from a lack of resolution, therefore SEC is almost mandatory, and certainly preferred. However, above 104g mol\1, the resolving power of ThFFF increases rapidly, and exceeds that of SEC for M'105g mol\1. For ultra-high molecular-weight polymers (M'106), SEC becomes increasingly lim-ited by shear-induced fragmentation of the chains as they travel through the packed bed under high pres-sure, and ThFFF is clearly superior.
Between 104 and 106g mol\1, neither SEC nor ThFFF has an overwhelming advantage for the analy-sis of many polymers. In general, ThFFF is more difRcult to implement than SEC because there are more factors under the control of the user that inS u-ence retention. While this adds Sexibility, only by understanding the separation mechanism and govern-ing equations can one avoid certain pitfalls in choos-ing the proper parameters for each application.
For analysing certain types of lipophilic polymers, ThFFF has some rather unique advantages. The ab-sence of shear forces, which make ThFFF especially suited to ultra-high molecular-weight polymers, was mentioned above. Using re-injection techniques, and
the absolute measurement of M by light scattering, the integrity of ThFFF analyses on high molecular-weight polymers that degrade in SEC columns has been clearly demonstrated. The open ThFFF channel is also amenable to gel-containing polymers. Since sample Rltration is not required, microgels are not lost in the analysis, and an estimate of the gel content can even be obtained. ThFFF is also well suited to polyoleRns, which are difRcult to separate by SEC because high temperatures ('1303C) are required for their dissolution. At these temperatures, column packings used in SEC tend to degrade at an elevated rate, while the ThFFF channel is more robust.
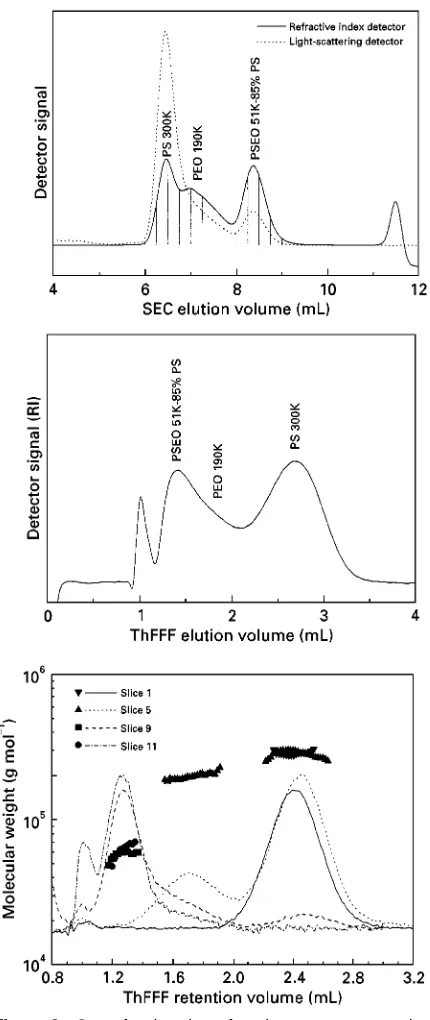
Figure 6 Cross-fractionation of a three-component polymer mixture by SEC and ThFFF. The mixture could not be suffi-ciently resolved for characterization by either SEC (top) or ThFFF (middle) alone. Cross-fractionation of SEC elution slices (bottom) provided enough resolution to determine the molar mass of each component with a multi-angle light-scattering detector (Dawn DSP, Wyatt Technology, Santa Barbara, CA). The composition of the components were determined fromD and DTvalues calculated from SEC and ThFFF retention volumes, respectively.
SEC nor ThFFF alone can separate. By cross-fraction-ing the mixture, the three components were sufR -ciently resolved to determine both the molecular weight and composition of each component.
Highly precise information on the polydispersity of lipophilic polymers can be obtained with ThFFF be-cause column dispersion is well modelled, and its effect on the elution proRle can therefore be removed. For example, plots of plate heightHversusSow rate are linear. Such plots can be extrapolated to zeroSow rate to yield an intercept term from which the sample polydispersity can be calculated. This method is used to obtain highly precise measurements of the polydis-persity ((1.005) of polymers prepared by anionic polymerization. By comparison, the precision of SEC for such measurements is reduced by an order of magnitude because of uncertainties in the con-tribution of column dispersion to plate height. For a more detailed analysis, a well-deRned band-broadening function can be mathematically re-moved from the elution proRle to obtain highly pre-cise molecular-weight distributions. With more polydisperse polymers ((1.005), column disper-sion is nearly negligible in ThFFF when typicalSow rates are used, so that elution proRles can be con-verted directly into accurate molecular-weight distri-butions.
Hydrophilic Polymers
For analysing hydrophilic polymers, FlFFF shares many of the advantages and limitations of ThFFF when compared to SEC. A notable difference is that FlFFF can be extended to lower molecular weights (103g mol\1). Another difference is that the effects of column dispersion cannot be completely removed from a FlFFF elution proRle because of factors asso-ciated with the accumulation wall membrane.
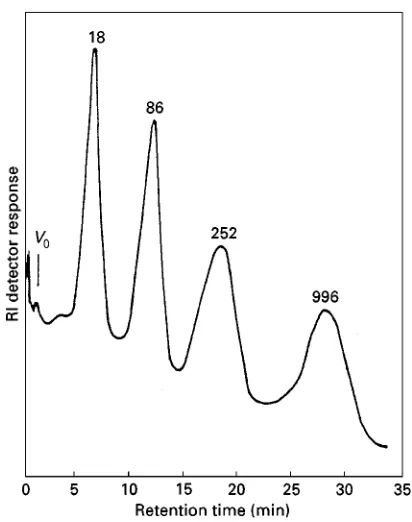
Figure 7 Separation of poly(ethylene oxide) standards by FlFFF. The cross-flow field was programmed to exponentially decay (decay-time constant 8 min) from an initial value of 5.9 mL min\1. Values above peaks are molecular weights ex-pressed as;103g mol\1. Reprinted with permission from Kirk-land JJ, Dilks CH Jr and Rementer SW (1992) Molecular weight distribution of water-soluble polymers by flow field-flow fractiona-tion. Analytical Chemistry 64: 1295}1303. Copyright 1992 American Chemical Society.
FlFFF has been applied to a wide variety of hy-drophilic polymers.Figure 7illustrates the separation of poly(ethylene oxide) standards with an asymmetri-cal FlFFF channel using a programmed Reld. By decaying theReld over time, four components ranging inMfrom 18 000 to 996 000 g mol\1were resolved in 30 min.
Combined with a multi-angle light scattering (MALS) detector, FlFFF is being used to study the conformational dynamics of hydrophilic polymers in solution. Besides its ability to work within a wider range of solvent conditions, its broad size range is responsible for the unique ability of FlFFF}MALS to characterize the structural properties of such poly-mers in a partially aggregated state.
FlFFF is also being used to study copolymers. For example, the viscometric and aggregation properties of hydrophilic graft copolymers have been studied, as well as the micelle-forming behaviour of such copolymers. FlFFF has also been used to characterize the size and molecular weight of humic and fulvic acids, as well as to study changes in their conforma-tion and aggregaconforma-tion properties as they occur over time upon alterations in solution properties.
Polysaccharides are another class of polymers that have proven difRcult to separate by SEC. These ma-terials have a wide range of industrial applications, from coating and packaging to plasma additives and blood substitutes. The physical, biological, and clini-cal properties of these materials vary with their mo-lecular-weight distribution, which is generally quite broad. It is difRcult to prepare robust SEC packings that are capable of analysing these fragile macro-molecules without complications of sample adsorp-tion, shear degradation and clogging of the column. FFF has been used to fractionate a wide variety of polysaccharides according to their molecular weight. FlFFF is used to separate ultra-high molecular-weight polymers, as well as aggregates of lower mo-lecular-weight polymers. For example, SEC fails to completely separate many dextran samples because of the exclusion boundary. The size and molecular weight of such samples are routinely characterized by FlFFF with MALS detection.
Determination of Molecular-Weight
Distributions by FFF
The simplest calibration plots in thermal and Sow FFF take the following form:
log (Vr)"A#SmlogM [9]
whereAandSmare calibration constants for a given polymer}solvent system. ParameterSmis termed the mass-based selectivity. However, at low levels of re-tention (R'0.2),Sm changes with R. An alternate form of eqn [9] allows for the use of low levels of retention without losing linearity in the calibration plot:
log (Vr!V3)"A#SmlogM [10]
Equation [10] allows retention to be calibrated over a wide range in molecular weight for a given poly-mer}solvent system without requiring the calculation of retention parameter. The problem remains, how-ever, that neither eqn [9] nor eqn [10] allows for an adjustment inReld strength, which is one of the great beneRts of FFF, as it allows theReld to be optimized for each individual sample. In order to have as single calibration equation for differentReld strengths, one must incorporate theReld strengthS:
logS"B#blogM [11]
Figure 8 Plot of logTT versus log M for polystyrene samples, illustrating the validity of the calibration model expressed by eqn [11]. The cold wall temperature was 153C andT ranged from 8 to 813C. The carrier liquids included tetrahydrofuran and ethylben-zene. A single plot can be used for both solvents because they yield a similar dependence ofD/DTonM for polystyrene. Rep-rinted with permission from Gao YS, Caldwell KD, Myers MN and Giddings JC (1985) Extension of thermal field}flow fractionation of ultra-high molecular weight polystyrenes.Macromolecules 18: 1272. Copyright1985 American Chemical Society.
rate of crossSow (VC) in FlFFF. By calibrating FFF channels in terms of logS versus logM, the Reld strength can be changed to optimize the separation of a given sample without the need for re-calibration. Figure 8 illustrates calibration plots in the form of eqn [11] for ThFFF.
Compared to SEC, universal calibration equations in FFF have the potential for being much broader in scope. In SEC, a given column can be ‘universally’ calibrated and applied to several types of polymers of similar conformation, provided the intrinsic viscosity is also measured on all standards and samples. In FlFFF, the same concept can be applied, but D is measured directly, so that calibration is not required at all if viscosity is measured independently. In ThFFF, each polymer}solvent system requires a set of different calibration constants, but once such con-stants are determined, they are applicable to all ThFFF channels in the ‘universe’. Of course, the tem-perature can affect calibration constants, as it does in SEC. Therefore, in ThFFF, the cold wall temperature must be the same in all channels that use a given set of calibration constants.
Trends
FFF will continue to be utilized primarily for the characterization of ultra-high molecular-weight poly-mers, which are difRcult to characterize by SEC. One of the fastest-growing areas for FlFFF is the study of hydrophilic systems that undergo complex
interac-tions. Such interactions are often the key to under-standing biological activity in protein and nucleic acid complexes, as well as the complex rheological behaviour of polysaccharides. Regarding the application of ThFFF to industrial polymers, two applications will continue to expand. The Rrst of these is the application to copolymers. As our under-standing of thermal diffusion increases, the ability to extract compositional information from fractionated copolymer samples will grow. A growing number of scientists are researching this promising aspect of ThFFF technology.
The second area of growth is the application of ThFFF to the separation of colloidal materials. While this type of sample has been historically considered the domain of Sow and sedimentation FFF, the unique ability of ThFFF to separate these materials by composition in both organic and aqueous carrier liquids is gaining the attention of several groups in both industry and academia.
The characterization of polymers will continue to beneRt from the combination of FFF with informative detectors such as MALS, dynamic light scattering, intrinsic viscosity, and infrared detectors. For the last thirty years, the characterization of materials by FFF has relied on calibration with standards or the use of retention theory to extract analytical information. Calibration is limited by the availability of polymer standards, and while FFF has the unique ability to produce physicochemical parameters directly from retention theory (i.e. without calibration), this too has limitations. Absolute molecular-weight detectors produce molecular-weight values without the need for calibration curves. When a complex sample is Rrst separated by FFF, a light-scattering detector produces a molecular weight value for hun-dreds or even thousands of relatively monodisperse components of the sample. The result is a highly accurate determination of the entire molecular-weight distribution of the sample. The combination of FFF}MALS has been particularly popular, as evid-enced by the fact that greater than 20% of the papers presented at a recent FFF symposium involved MALS detection.
See also: II/Chromatograhy: Liquid: Mechanisms: Size Exclusion Chromatography. Particle Size Separation: Theory and Instrumentation of Field Flow Fractionation. Field Flow Fractionation: Thermal.
Further Reading
Jeon SJ and Schimpf ME (1999) Cross-fractionation of copolymers using SEC and thermal FFF for determina-tion of molecular weight and composidetermina-tion. In: Provder T (ed.),Chromatography of Polymers:Hyphenated and Multi-Dimensional Techniques,ACS Symposium Series 731, ch. 10, pp. 141}161. Washington, D.C.: ACS Pub-lications.
Kirkland JJ, Dilks CH and Rementer SW (1992) Molecular weight distributions of water-soluble polymers bySow Reld-Sow fractionation. Analytical Chemistry 64: 1295}1303.
Lee S Determination of molecular weight and size of ultra-high molecular weight polymers using thermalReld-Sow fractionation and light scattering. In: Provder T, Barth HG and Urban MW (eds),Chromatographic Character-ization of Polymers:Hyphenated and Multidimensional Techniques (Advances in Chemistry Series 247). 93}107. Washington, DC: American Chemical Society. Lee S and Molnar A (1995) Determination of molecular weight and gel content of natural rubber using thermal Reld-Sow fractionation.Macromolecules28: 6354}6356. Lou J, Myers MN and Giddings JC (1994) Separation of polysaccharides by thermal Reld-Sow fractionation. Journal of Liquid Chromatography17: 3239}3260.
Martin M (1998) Theory of Reld-Sow fractionation. Advances in Chromatography39: 1}138.
Pasti L, Roccasalvo S, Dondi F and Reschiglian P (1995) High temperature thermal Reld-Sow fraction-ation of polyethylene and polystyrene. Journal of Polymer Science B: Polymer Physics 33: 1225}1234.
Schimpf ME, Myers MN and Giddings JC (1987) Deter-mination of polydispersity of ultra-narrow polymer frac-tions by thermal FFF. Journal of Applied Polymer Science31(1): 117}135.
Schimpf ME, Caldwell KD and Giddings JC (eds) (2000) FFF Handbook, New York: John Wiley.
Thielking H and Kulicke W-M (1996) Online coupling of Sow Reld-Sow fractionation and multiangle laser light scattering for the characterization of macro-molecules in aqueous solution as illustrated by sul-fonated polystyrene samples.Analytical Chemistry68: 1169}1173.
Wittgren B, Wahlund KG, Derand H and Wesslen B (1996) Size characterization of a charged amphiphilic copolymer in solutions of different salts and salt concen-trations usingSow Reld-Sow fractionation. Langmuir 12: 5999}6005.
Supercritical Fluid Extraction
H. J. Vandenburg, Express Separations, Roecliffe, North Yorkshire, UK
Copyright^ 2000 Academic Press
Introduction
Plastics are a mixture of the polymer itself and many small molecules. Some, such as antioxidants and plas-ticizers, are added to the polymer to alter the proper-ties. Others, such as residual monomers, processing aids and feedstock contamination are present inad-vertently. The levels of these compounds must be accurately known by manufacturers and regulators in order to assess whether the plastic is Rt for its in-tended purpose. There are usually many compounds present in the plastic, which makes analysis of their levels whilst still in the plastic very difRcult. Usually, therefore, the compounds must be separated from the bulk polymer before analysis. Conventional methods include liquid/solid extraction and dissolution fol-lowed by reprecipitation of the polymer. Conven-tional solvent extraction methods tend to be very slow, e.g. Soxhlet extraction may require 24 hours to complete, and the dissolution/reprecipitation methods may result in extracts contaminated by oligomeric ‘waxes’, requiring further clean up before
analysis. Methods producing clean, fast extracts are therefore very useful. The techniques of supercritical Suid extraction (SFE), pressurized Suid extraction (PFE) and microwave assisted extraction (MAE) have been shown to decrease extraction times, with lower use of solvents than conventional methods.


![Figure 8Plot of logillustrating the validity of the calibration model expressed by eqn[11]](https://thumb-us.123doks.com/thumbv2/123dok_us/944257.607453/9.568.51.261.54.210/figure-plot-logillustrating-validity-calibration-model-expressed-eqn.webp)