M.G. Babechuk, M. Widdowson, M. Murphy, B.S. Kamber
PII: S0009-2541(14)00593-2
DOI: doi:10.1016/j.chemgeo.2014.12.017
Reference: CHEMGE 17442
To appear in: Chemical Geology
Received date: 20 June 2014 Revised date: 15 December 2014 Accepted date: 17 December 2014
Please cite this article as: Babechuk, M.G., Widdowson, M., Murphy, M., Kamber, B.S., A combined Y/Ho, high field strength element (HFSE) and Nd isotope per-spective on basalt weathering, Deccan Traps, India, Chemical Geology (2014), doi:
10.1016/j.chemgeo.2014.12.017
ACCEPTED MANUSCRIPT
A combined Y/Ho, high field strength element (HFSE) and Nd isotope perspective on
basalt weathering, Deccan Traps, India
Babechuk, M.G.a,*, Widdowson, M.b, Murphy, M.c, and Kamber, B.Sa.
a. Department of Geology, Trinity College Dublin, Dublin 2, Ireland.
b. Department of Environment, Earth and Ecosystems, The Open University, Milton Keynes,
MK7 6AA, UK
c. School of Geological Sciences, University College Dublin, Belfield, Dublin 4, Ireland
*Corresponding author contact information:
Phone: +353 (0)1 896 2675
Fax: +353 (0)1 6711199
ACCEPTED MANUSCRIPT
AbstractHigh-precision high field strength element (HFSE: Zr, Hf, Nb, Ta, Th, U, W, Mo), Y/Ho, and
Nd isotope chemostratigraphy of two contrasting Deccan Traps weathering profiles – an
ancient, deeply weathered laterite, and a younger, more moderately weathered saprolite – is
used to reconstruct different aspects of basalt weathering. Precision of the HFSE analyses is
demonstrated through a report of the long-term concentrations and ratios determined in
United States Geological Survey (USGS) and Geological Survey of Japan (GSJ) basalt rock
standards (BHVO-1, BHVO-2, BIR-1, BCR-2, JB-2).
The oxyanion-forming members (U, Mo, W) are the most mobile of the considered HFSE
group. Extreme loss of W, far exceeding those of U and Mo during certain stages of basalt
alteration, is first reported here. The ability to strongly fractionate Mo and W during
weathering may contribute to solving the unresolved mass imbalance between the crustal and
marine inventories of W. By contrast, Zr, Hf, Nb, and Ta preserve the ratios of the parent
basalt in the profiles due to their limited mobility; these are therefore of great potential value
in reconstructing basalt flow stratigraphy and correlating lava flows in weathered flood basalt
provinces. Of the HFSE, Th is not a good choice as a conservative element because it is
strongly susceptible to addition of aeolian dust; this is evidenced by strong excursions in
Th/Nb that are correlatable with alkali element enrichment and less radiogenic 143Nd/144Nd
ratios.
The chemical fingerprints of dust were identified in a paleo-flow top of the saprolite profile,
suggesting that dust accumulation occurred during periods of quiescence between basaltic
eruptions. During protracted exposure and laterite development, the magnitude to which dust
overprints the basalt chemistry increases substantially as evident from much less radiogenic
ACCEPTED MANUSCRIPT
Attempts at quantifying the magnitude of dust accumulation in the laterite based on Th
enrichment indicate a mass fraction of greater than 0.5 when the dust is assumed to have the
chemistry of average upper continental crust. Although mixing models between the basalt
and assumed dust composition cannot unambiguously constrain the dust source, the Nd
isotope mixture preserved in the laterite points to a relatively young crustal dust source (e.g.,
similar to loess in composition) rather than the Precambrian shield rocks in the vicinity of the
Deccan Traps. The contrasting topologies of dust-derived Nd and dust-derived Th in the
laterite appears to record both physical transport of dust (Th) through permeable laterite
horizons as well as transport by chemical dissolution and precipitation (Nd) at an inferred
paleo-water table and in deep saprolite zones.
Yttrium and Ho fractionate substantially during all observed stages of weathering, with Y/Ho
ratios ranging from 26.5 to 21.9 in the moderately weathered saprolite profile and from 30.2
to 14.7 in the laterite profile. The single strongly superchondritic Y/Ho ratio of 30.2 in the
laterite is restricted to a sample at depth, and appears to fingerprint the deposition of REE
derived from dissolution higher in the profile. Decrease in the Y/Ho ratio relative to the
protolith basalt (24.4-24.7) in both profiles inversely correlates with chemical weathering
indices, and suggests that Y/Ho ratios have significant potential as a silicate weathering
proxy. Consequently, suspended vs. dissolved river loads may record the differing behaviour
of these elements during weathering.
ACCEPTED MANUSCRIPT
1. IntroductionWeathering of large continental flood basalt provinces (CFBPs) represents a major sink of
atmospheric carbon dioxide (Louvat and Allègre, 1997, 1998), and their long-term
weathering plays an important part of the geochemical cycle of many other elements (e.g.,
Dessert et al., 2001, 2003). The contribution of basaltic rocks to the continental weathering
flux is known to have fundamentally affected ocean chemistry because the geologically rapid
(~1–4 Myr) emplacement and associated sub-aerial alteration and erosion of CFBPs such as
the Deccan Traps (67–64 Ma) can be readily identified in the marine Sr and Os isotope record
(e.g., Vonhof and Smit, 1997; Ravizza and Peucker-Ehrenbrink, 2003). However, such
well-documented signatures serve to highlight a need to better constrain the proportion of elements
delivered from these basaltic terrains, and to determine the relative contributions of the
processes that release them.
Detailed geochemical investigation is crucial to understanding the modern and ancient
development and evolution of the ‘critical zone’ – the complex, near surface environment in
which rock, soil, water, air, and living organisms interact (e.g., Brantley and Lebedeva,
2011). One of the major, yet still poorly understood, processes in the geochemical evolution
of the critical zone, is the accumulation and downward migration of aeolian dust. The
strongest evidence for this comes from the presence of “foreign” minerals (e.g., Rex et al.,
1969; Jackson et al., 1972; Kurtz et al., 2001) in the profile and isotopic compositions (e.g.,
Nd, Hf, Sr, or Li isotopes) that are outside the limits achievable from simple alteration of the
parent rock (Borg and Banner, 1996; Kurtz et al., 2001; Kisakürek et al., 2004; Viers and
Wasserburg, 2004; Pett-Ridge et al., 2009; Liu et al., 2013). Although this allochthonous
input introduces an obvious complication to chemical mass balance determinations, it is
becoming increasingly apparent that dust plays an important role in the long-term evolution
ACCEPTED MANUSCRIPT
the weathering flux. Assessing the dust contribution in weathering profiles thus has the
potential to help reconstruct the exposure history of landmasses and provide insight into
certain paleoclimatic conditions (e.g., Brimhall et al., 1988; Chadwick et al., 1999; Vitousek,
2004).
It is generally accepted that the isotopic ratios of elements with relatively high atomic
numbers, such as those of Hf and Nd (e.g. 143Nd/144Nd) are not significantly fractionated by
incongruent weathering (cf. Ma et al., 2010). It is for this reason that radiogenic isotope ratio
variations can be used to quantify, through end-member mixing models, the mass balance
between indigenous material and foreign matter such as dust in weathering profiles if they
differ in chemical composition (e.g., Borg and Banner, 1996; Kurtz et al., 2001; Viers and
Wasserburg, 2004). In this regard, the strongly contrasting chemistry of depleted
mantle-derived basalt from that of the average upper continental crust, a typical approximation of
dust, makes basalt weathering profiles an ideal substrate to fingerprint aeolian dust
accumulation.
In this study, a selection of the high field strength elements (HFSE; Nb, Ta, Zr, Hf, Th, U, W,
Mo, Y, Ho), those with a high charge to mass ratio, is combined with Nd isotopes to address
different aspects of basalt weathering profile evolution. Analysis is performed on two profiles
from the Deccan Traps, India: the deep, Paleogene Bidar laterite and a sub-Recent profile
near Chhindwara that spans incipient to intermediate stages of weathering. The geology and
preparatory geochemical studies of the profiles have been reported previously (Kisakürek et
al., 2004; Wimpenny et al., 2008; Babechuk et al., 2014). The aim of the study is to address
three central topics related to the critical zone:
1) The first pre-requisite in geochemical studies of weathering is identifying the least mobile
ACCEPTED MANUSCRIPT
hosted in weathering-resistant minerals (e.g., Fe-Ti oxides) and exhibit generally limited
solubility, apart from those that can form more soluble oxyanions (U, W, Mo). For this
reason, the HFSE are often assumed to be immobile, yet this is not always the case, and they
may additionally be modified by dust (e.g., Kurtz et al., 2000). In this study, ratios of the
HFSE in the basalt profiles are used to assess which elements are least mobile and least
influenced by dust. These elements are then used to investigate certain aspects of the
pre-weathering characteristics of the basalt protolith, including fingerprinting variations in HFSE
chemistry of adjacent flows and the use of HFSE in correlating flow units in lateritised
regions. Next, since little is known about bedrock weathering of W and Mo, the comparative
mobility of U, Mo, and W is considered. The importance of constraining their weathering
behaviour is discussed in the context of their flux from the crust, both at present and in deep
geological time, since both elements have importance serving a bioessential function as metal
cofactors.
2) Previous studies of the Bidar laterite presented tentative geochemical evidence for dust
addition to the Deccan Traps region (Mason et al., 2000; Kisakürek et al., 2004; Wimpenny
et al., 2008), which is further explored in this study with more sensitive and conclusive
geochemical fingerprints in the form of Nd isotopes and element Th-U-Nb-Nd systematics of
the profile. An attempt is made to further resolve the magnitude of dust accumulation and the
post-addition redistribution of the dust-derived components during protracted evolution of the
weathering profile, which is of relevance to reconstructing the exposure and uplift history of
the Deccan Volcanic Province. New evidence for dust addition during the periods of
quiescence between volcanic eruptions during Deccan Traps emplacement, prior to the
extended period of lateritisation, is also provided. This has significance when assessing total
ACCEPTED MANUSCRIPT
3) The final aim of this study is to explore the weathering-related fractionation of the
geochemical twin elements Y and Ho (Babechuk et al., 2012; Thompson et al., 2013). The
contrasting alteration history of the geochemically similar parent basalt of the two profiles
allows an evaluation of the degree of Y/Ho fractionation across a wide range of weathering
conditions, and this preliminary work indicates that the this ratio has potential as a novel
tracer of weathering intensity. Weathering-induced changes of Y/Ho from parent rock ratios
are predicted to result in observable fractionation in derived sediments and riverine waters;
this is briefly explored using a pre-existing data set of dissolved rare earth elements and
yttrium (REE+Y) from rivers in eastern Australia (Lawrence et al., 2006a,b).
From a broader perspective, this study contributes to the understanding of the geochemical
evolution of basaltic weathering profiles, which is relevant to reconstructing how basalt
weathering has influenced ancient Earth systems. More broadly still, it may also provide a
context for better understanding basalt alteration behaviour on the Martian surface (Morris et
al., 2006). Further, this study also adds to mounting evidence that dust addition to weathering
profiles, although most easily fingerprinted in basaltic environments, is a fundamental
process in shaping the geochemistry of the critical zone and is thus of essential consideration
with regards to modelling mass balance and nutrient availability.
2. Methods
2.1 High-precision trace element analysis
Trace element analysis was performed at Laurentian University, Canada, via solution
quadrupole ICP-MS (SQ-ICP-MS) measurement with an XSeriesII as described below and in
ACCEPTED MANUSCRIPT
Savillex® beakers into which a HF-HNO3 (4:1) mixture was added. The beakers were left
sealed on a hotplate at 160°C for 72 hrs and agitated at least once every 24 hrs. The residue
was evaporated and the resulting fluorides were attacked with 6 N HCl (twice using 0.5 mL)
and converted to nitrates using concentrated HNO3 (twice using 1 mL) with evaporation to
dryness between and following each step. The ensuing nitrate residue was dissolved in a final
10 g 20% HNO3 stock solution. Inspection revealed no undissolved material after these steps.
A calibration standard [United States Geological Survey (USGS) W-2a] and quality control
standards [typically USGS and Geological Survey of Japan (GSJ) rock standards] were
prepared following a similar procedure (omitting the addition of HCl after first step of
digestion) and were analysed along with batches of sample unknowns. The ICP-MS analyses
followed the experimental design of Eggins et al. (1997) with the modifications described in
Kamber et al. (2003) and Babechuk et al. (2010), as per the following description. For
analysis, an aliquot of stock solution was diluted to produce a 2% HNO3 solution with an
elemental and enriched isotope internal standard mixture containing 6Li, Rh, Re, Bi, and 235U
in order to correct for the effects of matrix-related signal suppression and instrument drift.
Immediately prior to running each batch of unknowns, two preparatory experiments were
performed using the daily tuning conditions: a determination of the 235U/238U and 6Li/7Li
ratios in the GSJ standard JA-3 or USGS standard AGV-2 to determine the natural
contribution of the enriched isotope in the sample dilution mixture of unknowns; and, a series
of pure element solutions containing Ba+Nd, Dy, and Zr to monitor the production rate of
oxides with common isobaric interferences on the analytes of interest. Further details of these
two steps are reported in Ulrich et al. (2010). Analyses of samples (n=15-25) were also
preceded by procedural blanks, two or more separate W-2a solutions for calibration, and
quality control standards. After the procedural blanks, standards and unknowns were
ACCEPTED MANUSCRIPT
instrument drift remaining after internal standard correction. Following blank subtraction and
internal standard, interference, and drift monitor correction, intensities were quantified as
concentrations using the laboratory’s preferred values for the USGS standard W-2a, as
reported in Table 1 for the HFSE and for the other analytes as reported in Kamber et al.
(2003) and Babechuk et al. (2010).
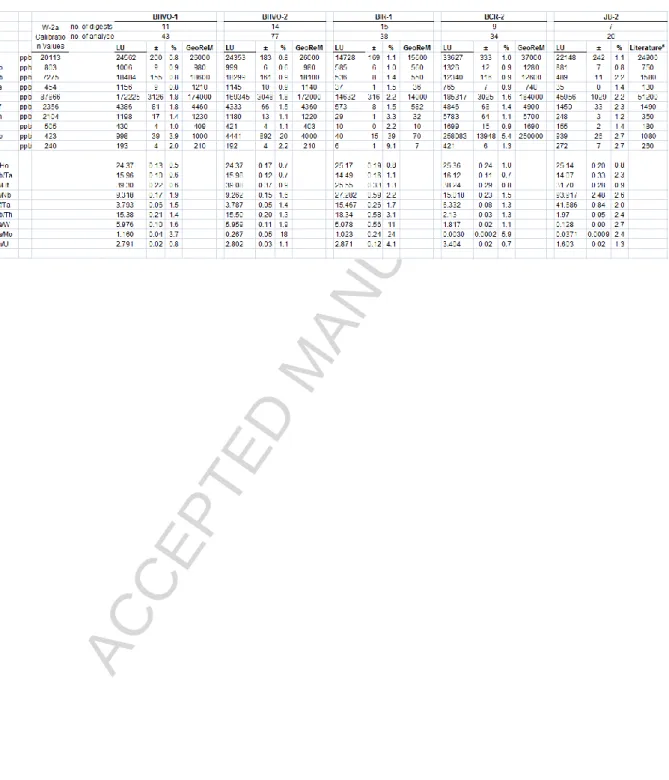
Method reproducibility and accuracy was assessed using the long-term average of USGS and
GSJ standards run as unknowns (e.g., see Babechuk and Kamber, 2011 for Sm/Nd ratios).
Table 1 reports the reproducibility of element (Y, Ho, Nb, Ta, Zr, Hf, Mo, W, Th, U)
concentrations and ratios of relevance to the present study for mafic standards routinely
analysed at Laurentian University (BHVO-1, BHVO-2, BIR-1, BCR-2, JB-2). Apart from
Mo, the concentrations of the HFSE reproduce at 2% RSD (1 sigma) or better in the
standards, with exception of BIR-1 which returns slightly higher RSD values due to very low
concentrations. The long-term reproducibility of HFSE ratios is generally even better due to
the cancelling of weigh-in and dilution errors that only affect absolute concentrations.
Overall, the high level of precision indicates that: i) procedural blank levels were consistently
low; ii) these elements are relatively homogeneously distributed in the powders digested at
Laurentian University; and iii) that laboratory and experimental parameters such as sample
dilution, instrument wash-out, and drift correction are suitable for HFSE determination even
at very low concentrations (e.g., see Babechuk et al., 2010 for a discussion of factors which
influence W determination). A comparison of the long-term mean concentration with
literature values (Table 1) suggests that the applied W-2a concentrations used for calibration
are accurate; in the event that consensus regarding the concentration of any element in W-2a
evolves, all calibrated data can be recalculated relative to the presently preferred values
ACCEPTED MANUSCRIPT
By contrast to the other HFSE, Mo exhibits a poorer precision in each of the USGS standards.
Several lines of evidence point towards this being related to a more heterogeneous
distribution (i.e., ‘nugget effect’) within individual aliquots of some standards in addition to
variable levels of contamination during the production of the original USGS powders (e.g.,
Weis et al., 2005, 2006; Lin et al., 2000), as opposed to analytical factors such as instrument
memory or a higher blank/sample ratio. Firstly, very similar HFSE concentrations (not
differing by more than 2%) and ratios are measured in both BHVO-1 and BHVO-2 apart
from Mo which reproduces to a much lower precision and Mo concentration differs by 127%
where BHVO-2>BHVO-1 (Table 1). This was discussed in Weis et al. (2005, 2006) and was
attributed to the use of hardened steel during powder production that resulted in greater
contamination in the second generation standard. Comparison of our long-term mean values
with those of Weis et al. (2005) suggests that the degree of Mo contamination within each
standard is relatively consistent (Table 1). However, a comparison of Mo values for separate
BHVO-2 aliquots reported in Kamber (2009) suggests that some, although minimal,
variability remains between different BHVO-2 powder stocks. Secondly, an unexpectedly
high Mo concentration is evident in BCR-2 (258,080±13950 ppb) that suggests a far more
severe contamination during the production of this standard, as also noted by Weis et al.
(2006). Heterogeneity of Mo in the W-2a calibration standard could also cause additional
inaccuracy and imprecision. However, it is worth noting that a standard addition experiment
by Baldwin et al. (2012) yielded a Mo concentration in W-2a of 424±2 ppb, identical to the
laboratory’s preferred calibration value (423 ppb). Furthermore, Mo data obtained with the
present technique compared very favourably with Mo concentrations determined by isotope
dilution of a separate aliquot (Baldwin et al., 2013).
These observations illustrate the limitations of using second generation USGS rock standards
ACCEPTED MANUSCRIPT
these standards do not accurately represent the achievable level of the method’s analytical
reproducibility. By contrast to these USGS standards, the GSJ standard JB-2 has a much
more reproducible Mo concentration (RSD<3%) at low concentrations and suggests that
these standards may not possess the same ‘nugget effect’, despite showing evidence for W
contamination in some cases (e.g., Babechuk et al., 2010). Therefore, the reproducibility of
Mo in the JB-2 standard is adopted to estimate the precision of Mo measurements in
unknowns.
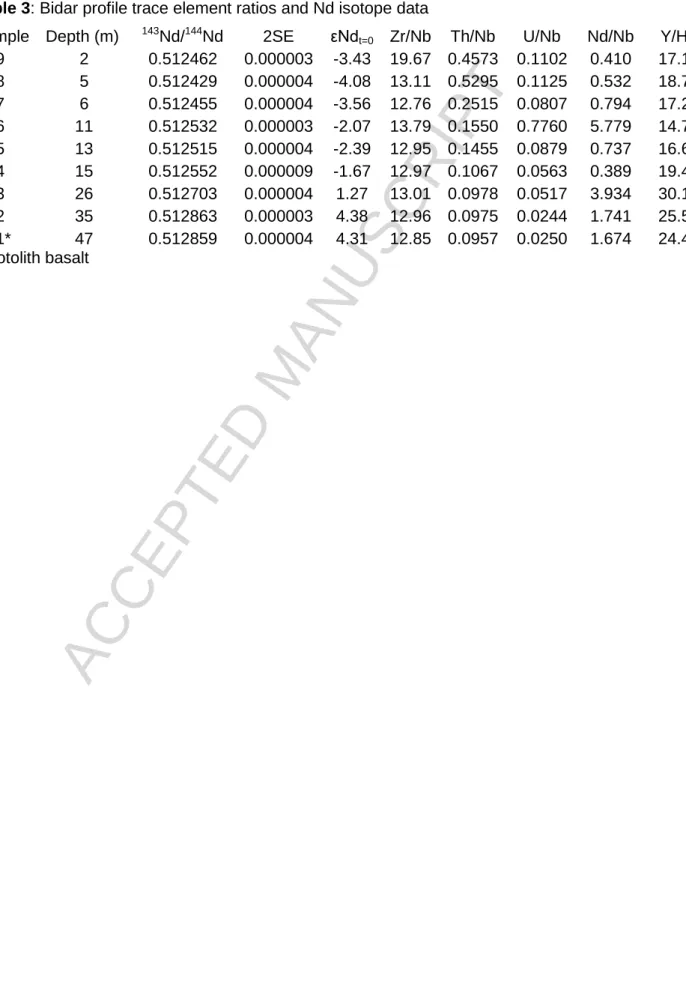
The HFSE data for the weathering profiles in this study are reported in Table 2 (Chhindwara)
and Table 3 (Bidar), whereas the full trace element data set is reported in the Supplementary
Material. Babechuk et al. (2014) previously reported and discussed a more limited suite of
these trace element data (i.e., alkali, alkaline earth, rare earth elements, and Nb). It is noted
that Ta, W, and Mo data are not reported for the Bidar samples since the powders were
originally prepared using a tungsten carbide swing mill.
2.2 Nd isotope analysis
Chromatography and neodymium isotope analyses were conducted at the Department of
Geology at University College Dublin (UCD) using a 100 mg aliquot of the sample powders
and digested and converted with concentrated HNO3 following the same procedure as
described for the trace element analysis (Section 2.1; Babechuk et al., 2014). Following
conversion, the residue was dissolved in 2 mL 1 N HNO3 for use in chromatography. The
chromatographic procedure followed the methods of Pin et al. (1994) and Pin and Zalduegui
(1997), whereby the solution was passed over TRU Spec resin to separate the REE and then
flushed directly onto LN Spec resin to purify the Nd.
Accuracy and external precision were monitored by repeated analysis of the La Jolla
ACCEPTED MANUSCRIPT
experiments that is identical to the long term laboratory average with an external
reproducibility of 10 ppm (2σ S.D., n=25) and consistent with previous high-precision work
(e.g., Thirlwall, 1991). All Nd isotope data were normalised to a 146Nd/144Nd ratio of 0.7219.
The 143Nd/144Nd ratio along with the in-run precision (2σ S.E.) are reported in Table 2 and
Table 3. Neodymium and strontium isotope data were previously collected on the Bidar
profile sample suite in an unpublished project (Mason, 1999; Mason et al., 2000). These new
data are consistent with these previous analyses but offer improved internal precision.
2.3 Data presentation
Throughout the remaining text, all element ratios are calculated on a mass basis. Mean values
are reported with one standard deviation (1σ SD) unless otherwise stated. Element mass
balance calculations for each sample are calculated as the percent change (e.g., Kisakürek et
al., 2004; Kurtz et al., 2000; Brimhall and Dietrich, 1987) of an element relative to the
least-weathered parent rock (hereafter referred to as protolith), after normalisation to an immobile
or least-mobile element from the following equation (1):
Eq.1:
where R is the mass ratio of an element pair with the immobile element in the denominator
(here taken as Nb or Ta based on the analysis in Section 4.1) and the protolith ratios are those
from samples ChQB12 or BB1 for the Chhindwara and Bidar profiles, respectively. Chemical
weathering indices are calculated on a molar (chemical index of alteration) or mass (index of
lateritisation) basis using the major element data reported in Babechuk et al. (2014) and
Kisakürek et al. (2004) that are available in the Supplementary Materials. Epsilon Nd isotope
ACCEPTED MANUSCRIPT
143Nd/144Nd value of 0.512638 (Jacobsen and Wasserburg, 1980), calculated from the
following equation εNd = [(143Nd/144Nd)sample/(143Nd/144Nd)CHUR – 1] x 10000.
3. Overview of Weathering Profiles
In situ weathering profiles should display an uninterrupted continuum of ‘alteration horizons’
progressing from unaltered basal bedrock, through to saprolite (e.g., Chhindwara profile) and,
in the case of lateritic profiles, upward through a ‘mottled zone’ of oxyhydroxide
accumulations, to highly indurated iron-rich duricrust capping (e.g., Bidar profile). The
horizons are separated by interface zones made evident in outcrop from observable changes
in colour, mineralogy and texture.
More precisely, the weathering front at the base of the profile is the junction between the
unaltered bedrock (protolith) and overlying chemically weathered materials; this transition
can occur over a narrow vertical interval (i.e. < 1m). Above the weathering front, a horizon
containing a mixture of weathered material and unweathered ‘corestones’ occurs. This
passes upward into a saprolitic zone in which structures and crystal pseudomorphs from the
parent protolith may still be recognised. With further alteration, a microaggregated texture
develops, known as the ‘mottled zone’, consisting of kaolinite particles along with crystals of
Fe oxyhydroxides. With further maturation of the profile these develop in to nodules; this
texture promotes good vertical drainage and further accelerates the alteration process. Under
alternating dry and wet conditions, this zone becomes characterised by a strong accumulation
of iron oxides. Upward, the nodular accumulations coalesce and interlock culminating in an
indurated ‘vermiform’ or ‘tubular’ laterite comprising a massive, interlocking fretwork of Fe-
(and Al-) oxides and hydroxides at the top of the profile.
ACCEPTED MANUSCRIPT
This Quaternary weathering profile spans two identifiable basalt flows in the Deccan Traps,
exposed in a quarry east of Chhindwara (22° 04.213′ N, 79° 01.393′ E). Its structure and
chemical composition is described in detail by Babechuk et al. (2014). The upper flow
(ChQB) is fully exposed and capped with a thin (~20 cm) topsoil, whereas only the upper 215
cm of the lower flow (ChQA) is exposed. Fifteen samples were taken from the upper flow
(ChQB1-ChQB12), including four samples that transect a corestone at a depth of 90 cm
(ChQB9a-ChQB9d), and twelve samples from the lower flow (ChQA1-ChQA12) as
summarised in Figure 2. Overall, this essentially saprolitic profile has progressed to an
intermediate weathering intensity, with chemical index of alteration (CIA) values of 36-80
and oxidative mafic index of alteration values [MIA(O)] values of 38-71 (Babechuk et al.,
2014).The sample ChQB12 from a depth of 140 cm into the upper flow, and extracted using a
coring drill, is adopted as the profile protolith based on position/relationship with the profile,
its mineralogy (primary basaltic minerals), lowest chemical weathering index values (e.g.,
CIA: 36), and highest Fe(II)/Fe(III) ratio (Babechuk et al., 2014).
3.2. Bidar profile
Laterite is widespread in the Bidar region of the Deccan and, due to the resistant lateritic
upper levels of the profile, forms a series of elevated mesa-like topographic features. The
Bidar site is worthy of investigation since it has an important historical precedent: it was near
here that Newbold (1846) first suggested that laterite developed as in situ (i.e. autochthonous)
chemical residuum through the segregation and subsequent rearrangement of the minerals
and elements originally comprising the parent rock (i.e., protolith). The investigated lateritic
weathering profile is well exposed at the edge of a hillside near Bidar (1754.87’N,
ACCEPTED MANUSCRIPT
within two or three flows of the chemically uniform Ambenali Formation (Widdowson et al.,
2000).
The Bidar profile is part of the high-level duricrust (Widdowson, 1997) that is interpreted to
be the upper remnant of the lava pile that was subjected to a long period of intense
weathering that post-dated volcanism (ca. 65 Ma), but dwindled following uplift associated
with the Himalayan orogeny (ca. 50 Ma). After this point, changes in climate and hydrology
resulted in the water table dropping, valley incision, and the duricrust being ‘fossilised’. This
presents a protracted interval of exposure (ca. 65 Ma to present) during which dust influenced
the area during or after lateritisation (Mason et al., 2000; Kisakürek et al., 2004; Wimpenny
et al., 2008), although the timing of dust addition and its source, as well as its fate in the
profile are still poorly understood.
A total of 9 samples (BB1-BB9) were collected as part of detailed field logging of the Bidar
profile; each sample was chosen to represent horizons at which there was an observable
change in mineralogy or texture. This lateritic profile has progressed to an extreme
end-member of weathering intensity, with chemical index of alteration (CIA) values of 37-100
and oxidative mafic index of alteration values [MIA(O)] values of 36-99 (Babechuk et al.,
2014). The sample BB1 from a depth of 50 m where the basalt shows no signs of alteration is
adopted as the profile protolith; it contains similar chemical features as described above for
ChQB12, including a primary basaltic mineralogy (pyroxene and plagioclase) and the lowest
chemical weathering index values (e.g., CIA: ~37). Additional information on the Bidar
profile samples is reported in the Supplementary Materials.
ACCEPTED MANUSCRIPT
Results and discussion are grouped into three separate themes. Firstly, the relative mobility of
the HFSE during weathering of the Deccan Traps basalt is investigated (Section 4.1),
followed by the use of the least-mobile HFSE as potential chemostratigraphic ‘fingerprints’
for determining pre-weathering basalt stratigraphy and mass balance, and a separate
discussion of comparatively more mobile HFSE (U, Mo, W). Secondly, the Th-U-Nb-REE
and Nd isotope systematics are used to evaluate the dust accumulation and downward
migration during weathering, and as a possible proxy for evaluating surface exposure
duration; for instance, periods of repose between the arrival of successive lava flows, and
longer-term exposure resulting in lateritisation (Section 4.2). Thirdly, the mobility of Y and
the fractionation of Y/Ho are considered with respect to their importance in the chemical
cycling of these elements within the hydrosphere and the potentiality of using Y/Ho as a
proxy for oxidative weathering (Section 4.3).
4.1 High field strength elements
4.1.1 Zr, Hf, Nb, Ta, Th
The Chhindwara weathering profile is developed across two individual lava flows; the upper
one (~4 m thick) is fully exposed whilst only a 2.15 m section of the lower flow is exposed.
This succession was described by Babechuk et al. (2014), where it was shown that an offset
in ‘immobile’ element concentrations (Al and Ti) and an abrupt change in the Al/Ti ratio
marked the transition between the flows, highlighting a small difference in the original lava
chemistries. The high-precision trace element data of this study permit a more detailed
evaluation of the protolith HFSE characteristics and their behaviour during the early stages of
basalt weathering.
In general, the concentration of the HFSE (Zr, Hf, Nb, Ta, Th) increases with increasing
ACCEPTED MANUSCRIPT
within each of the flows. Superimposed on this, however, is an offset towards higher
concentrations in the lower flow (ChQA) relative to the upper flow (ChQB), comparable to
that observed for Ti (Babechuk et al., 2014). While these HFSE concentration offsets appear
to also detect the variation in the two flow chemistries, we focus on ratios of these elements
since they are more revealing in this regard by eliminating effects of weathering-related
density or dilution/enrichment changes on the concentrations and have the additional benefit
of reflecting relative mobility.
The isovalent geochemical twins (Zr-Hf and Nb-Ta) exhibit constant ratios
(Zr/Hf=37.60±0.37; Nb/Ta=15.41±0.12) in all samples of the Chhindwara profile (Figure
1a,b). Relative to the inferred protolith (ChQB12), the Nb/Ta and Zr/Hf ratios do not deviate
by more than 3% in all samples despite the general increase in element concentration that
occurs with increasing chemical weathering intensity. This indicates that these elements
exhibit near-equal extent of immobility in the profile (Kurtz et al., 2000), and, further, that
these geochemical twin ratios are incapable of discriminating between the two lava flows.
The latter feature is most likely because the isovalent elements are hosted in the same
minerals making them less sensitive to primary magmatic differentiation processes. By
contrast, when ratios of the HFSE elements with non-equal valence and different ionic radius
(e.g., Hf/Ta, Zr/Nb, and Th/Nb) are inspected, a discrete ratio offset is evident between the
two flows (Figure 1c) similar to Al/Ti (Babechuk et al., 2014) that also illustrates, but with
greater resolution, the parental HFSE chemistry. Apart from this primary compositional
offset, excursions from the constant ratio that characterises each flow are present in the three
uppermost samples of the lower flow (ChQA10-ChQA12), and the uppermost sample of the
top flow (ChQB11). This is most evident in the Th/Nb and Zr/Nb ratios. Our hypothesis that
these samples have been modified by incorporation of dust will be discussed in Section 4.2.
ACCEPTED MANUSCRIPT
intra-flow variability. The Th/Nb ratio distinguishes the lower (ChQA, n=9) from the upper
(ChQB, n=14) flows with mean values of 0.209±0.003 and 0.177±0.003, respectively
(corresponding to a ~20% offset in ratio). The Hf/Ta ratio ratios of 6.74±0.03 and 6.28±0.06
(corresponding to a ~7% offset in ratio) also separate the two flows. Finally, the Zr/Nb ratio
is also characteristic for each flow (Figure 1c), but there is more variability within the lower
flow (ChQA) compared to the upper flow (ChQB). This could indicate increased mobility of
Zr (and Hf) over Nb at greater weathering intensity (Widdowson and Cox, 1996). High
precision HFSE data can fingerprint individual lava flows due to the very limited mobility of
these elements, but flows need to be sampled at reasonable density to achieve statistical
significance.
In the more profoundly altered Bidar profile, the concentrations of Zr, Hf, and Nb are highly
correlated and exhibit near-constant ratios, with the exception of the uppermost sample
(BB9). For instance, Zr and Nb correlate particularly well, yielding an r2 value of 0.999 and
an average Zr/Nb of 13.05±0.32 (excluding BB9). Similarly, Zr/Hf and Hf/Nb in samples
BB1 to BB8 are near-constant at 37.81±0.58 and 0.345±0.009, respectively, with a significant
deviation present only in BB9 (Zr/Hf: 42.40; Hf/Nb: 0.464). The uppermost sample BB9 may
have been subjected to mineral sorting, heavy mineral addition, or greater mobility of Nb
over Zr and Hf in the most intensely weathered horizon of the laterite. Regardless of sample
BB9, it is evident that Zr, Nb, and Hf are highly immobile, both relative to each other and
during different stages of weathering, including the intense stages of lateritisation. By
contrast to these elements, however, Th displays a very different behaviour that indicates
selective enrichment; this is interpreted to be due to aeolian dust accumulation within the
profile, as discussed in Section 4.2.
Although a clear offset in the Al/Ti ratio related to the flow transition in the Chhindwara
ACCEPTED MANUSCRIPT
by comparison with the trace HFSE (Zr-Hf-Nb-Ta-Th) ratios. The concentrations of the latter
elements correlates more significantly with Ti than Al in the profile, and suggests that Al may
be more susceptible to physical translocation of clay minerals or preferential leaching by
comparison. In other words, it appears that Ti and the trace HFSE are less mobile and more
suitable for assessing variation in the protolith chemistry.
The near equal Zr-Hf-Nb-Ta immobility in the basalt profiles in this study contrast with
findings of Kurtz et al. (2000) who found more intense Zr leaching and reprecipitation at
depth during the tropical weathering of Hawaiian basalt exposed to high levels of rainfall.
Regardless of this difference, we agree with Kurtz et al. (2000) in promoting the use of Nb or
Ta as the least-mobile elements for mass balance calculations. The limitation of mass balance
calculations in profiles developed across flows of variable parental chemistry remains and is
exposed with the high precision data of this study. For example, in the absence of geological
evidence for a separate flow, the offset could be interpreted as preferential leaching and
deposition of the HFSE in different soil horizons of a uniform protolith composition. In the
case of the Chhindwara profile, the lack of a sufficiently unweathered protolith sample in the
lower flow precludes a separate mass balance analysis and necessitates assumptions
regarding the parental chemical composition of the mobile elements in order to calculate full
profile mass gains or losses relative to the least-weathered sample (Babechuk et al., 2014).
4.1.2 Implications for flood basalt stratigraphy
The comparative Zr-Hf-Nb behaviour of the Bidar and Chhindwara profiles has important
implications for the basalt lava eruption history. Although the thick (~50 metres) Bidar
profile is likely to have developed across several lava flows (i.e., 2–3 units), the HFSE ratios
imply that there was little inter-flow chemical variability compared to the Chhindwara
ACCEPTED MANUSCRIPT
between eruptions, consistent with the compositional uniformity exhibited by the thick (c.
500 m), uncontaminated MORB-like Ambenali Formation, which is widespread across the
Main Deccan Province (MDP; Jay and Widdowson, 2008). By contrast, the Chhindwara area
was peripheral to the MDP, possibly more distal from the eruptive source, and accordingly
received flows only from the largest, most voluminous outpourings; this episodic arrival of
lavas would allow for a greater degree of magmatic evolution and contamination between
successive eruptions. This interpretation is further supported by the more juvenile
143
Nd/144Nd ratios of the protolith of the Bidar profile (εNd=4.3) compared to the apparently
non-dust influenced Chhindwara flow centre (εNd=0.2 to 0.4).
These results are consistent with those of Widdowson and Cox (1996), who demonstrated
that Zr/Nb ratios could be used to map basalt stratigraphy over long distances, even when the
substrate was lateritised. By extension, the ability to fingerprint variations in the stratigraphy
of mafic lava flows using other HFSE is of benefit in localities where flow contacts are not
necessarily identifiable, such as in ancient, metamorphosed paleosols or drill-hole samples
(e.g., Millet et al., 2014). It is important to stress that in such circumstances chemical
stratigraphies can only be produced from those elements from the primary magmatic
inventory that are demonstrably immobile and not added to the profile from an external
source during or after weathering.
4.1.3 U
By contrast with the HFSE already discussed (Zr-Hf-Nb-Ta), U commonly exhibits enhanced
mobility in oxygenated environments through the formation of the uranyl ion [UO22-]
following the oxidation of U(IV) to U(VI). Within the Chhindwara profile, U mobility greater
than that of the other HFSE is evident through the scatter and U loss expressed by the U/Nb
ACCEPTED MANUSCRIPT
(Figure 2b); relative to the U/Nb in the parent basalt (ChQB12: 0.0474), U loss dominates
relative to Nb (lower U/Nb) within the individual flows apart from the enrichment evident
within the centre of the corestone at a depth of 90 cm (ChQ9d). In addition to redistribution
or loss of U originally hosted in the basalt, some U may have been introduced to the profile
along with Th at the lava-flow tops and subsequently mobilised within the profile, but this is
impossible to quantify at present. The U/Nb topology of the Bidar profile differs substantially
from that of Chhindwara due to the far more complex and protracted evolution of the former
that includes dust accumulation and fluctuating water table deposition, as discussed in
Section 4.2.
4.1.4 Mo and W
Continental weathering is the most important means of delivering bioessential trace elements
to the oceans. Secular changes in the flux of these elements from land have been linked with
key events in early Earth history, such as the onset of sulphide weathering (e.g., Scott et al.,
2008; Large et al., 2014). Continental fluxes are also affected by the dominant type of rock
exposed to weathering at the Earth’s surface. For example, a decrease in the Ni supply to
oceans occurred after the near-complete disappearance of newly erupted very high-Mg
(Ni-rich) komatiites in the Neoarchean. In addition to affecting the oceanic Ni/Fe ratio,
Konhauser et al. (2009) postulated that this acted to ‘starve’ the methanogens, who depend on
Ni for respiration, and may have helped trigger an ecological niche transition that facilitated
the Great Oxidation Event (GOE). However, little is known about the behaviour of Ni during
weathering throughout Earth history. Examples such as this underscore the necessity to better
constrain the weathering behaviour of key bioessential elements in order to quantify their flux
ACCEPTED MANUSCRIPT
Like U, W and Mo form soluble oxyanions, namely tungstate [WO42-] and molybdate
[MoO42-], respectively, in natural waters. In contrast to U, however, these elements serve a
biological function as metal cofactors in enzymes (e.g., Kletzin and Adams, 1996; Hille,
2002; Anbar, 2004; Andreesen and Makdessi, 2008; Wang, 2013). It is therefore possible that
changes in their oceanic supplies and/or sinks may have exerted a limiting control on the
evolution of oceanic biota and their respiration mechanisms. This motivated a more detailed
analysis of W and Mo behaviour in the Chhindwara profile. It is worth noting, that although
W behaviour in soils has been studied due to its potential for bioaccumulation and toxicity,
especially in areas of anthropogenic and natural contamination (e.g., Bednar et al., 2009;
Kennedy et al., 2012), little has been reported on its behaviour in saprolite (C horizon)
profiles.
The W/Ta ratio vs. depth in the Chhindwara profile is illustrated in Figure 4a. The protolith
W/Ta ratio (ChQB12: 0.168) is similar to that of modern MORB-type basalts (König et al.,
2011; Babechuk et al., 2010). Throughout the upper flow, the W/Ta ratio ranges from 0.109
to 0.300, corresponding to up to 36% depletion and 79% enrichment relative to the protolith
sample. Enrichment of W is restricted to three samples: the uppermost topsoil sample
(ChQB11: 79%) and the two samples lowest in the flow (ChQB1/B2: 55-69%). In all
remaining samples, which represent the main stratigraphic thickness of the flow, loss of W
relative to Ta (decrease in W/Ta from the protolith) dominates. Within the lower flow, a
much wider range of W/Ta ratios (0.021-0.909) is present. Although an offset in W/Ta at the
flow boundary is expected, the magnitude is more difficult to assess as a result of the greater
mobility exhibited by W relative to the other HFSE (Zr-Nb-Hf-Th). Nevertheless, the
independent W/Ta topology of the lower flow reveals factors influencing the chemistry of W
in the profile. Firstly, W enrichment is clearly evident in the samples at the paleo flow-top
ACCEPTED MANUSCRIPT
allochthonous component with trace element enriched characteristics closer to that of
continental crust (Section 3.2), a parallel argument can be made for W enrichment in these
horizons. Since the upper continental crust contains significantly higher W concentrations
(e.g., ~1 ppm; Kamber et al., 2005) than the basalt (ChQB12: 92 ppb), the increase in W/Ta
is not surprising. Secondly, a distinct trend of downwardly decreasing W/Ta ratios is evident,
starting from samples ChQA8-ChQA9 (0.199-0.126; those below the dust-influenced
flow-top) towards the lowest exposed samples of the flow (0.064 to 0.021 in ChQA1-ChQA3). If
the original W/Ta ratio of the unweathered basalt in the lower flow was the same as in the
upper flow (ChQB12: 0.168), the W/Ta ratios near the base of the flow would correspond to a
W loss of ~60-90%. This suggests conditions that significantly enhanced the W mobility in
the lower flow compared to the upper flow. In general, the downward decreasing
concentration of Mg and abundance of zeolite minerals (due to increasing primary
vesicularity towards the top of the lava flow) in the lower flow matches the topology of the
W/Ta stratigraphy, suggesting these may be related to or directly influence the behaviour of
W (e.g., loss of W from the breakdown of mafic minerals).
It is clear from a plot of W vs. W/Ta (Figure 4c), as well as the previously discussed Nb-Ta
systematics, that the W/Ta ratio is controlled almost entirely by W mobility in the profile.
The exact processes controlling the loss and retention of W, however, cannot be assessed
from the elemental data alone. Nevertheless, it is likely that W was mobilised through the
formation of tungstate or polytungstate species. Certain phyllosilicates, or Mn-Fe
oxyhydroxides have been demonstrated to exert a primary control on the concentration of W
in natural waters through pH-dependent adsorption or co-precipitation (e.g., Kunzendorf and
Glasby, 1992; Johannesson et al., 2000; Gustafsson, 2003; Seiler et al., 2005; Bednar et al.,
2009), which could also account for areas of W enrichment other than in the flow-tops. For
ACCEPTED MANUSCRIPT
the upper flow that shows a sharp increase in Fe3+/Fe2+ relative to the more massive flow
centre (Babechuk et al., 2014). Overall, the W geochemistry of the Chhindwara profile
indicates, through the extensive loss of W in the saprolite, that W mobility may not be
restricted to soil horizons and that certain stages of weathering and/or mineral phases may
promote its preferential release.
The Mo/Ta ratio for the Chhindwara profile is shown in Figure 4b. The Mo/Ta ratio within
the upper flow is relatively constant (0.790 ± 0.07), but similar to W, indicates loss of Mo
relative to Ta with percent ratio change from the protolith of -22 to 5. Lower Mo/Ta ratios are
present in the underlying flow, ranging from 0.747 to 0.500. The change in ratio within the
lower flow is internally less variable and appears to indicate a lower degree of Mo mobility
relative to W, suggesting that it is either hosted in more weathering-resistant minerals (e.g.,
Fe-Ti oxides; Arnόrsson and Óskarsson, 2007) rather than sulphides/sulphide inclusions in
the basalt (Voegelin et al., 2012) which are highly susceptible to oxidative weathering.
Furthermore, although molybdate is highly soluble, it is similar to tungstate in that it is
scavenged by Mn-Fe oxyhydroxides (Anbar and Rouxel, 2007; Arnόrsson and Óskarsson,
2007; Kashiwabara et al., 2013), which could limit its flux from the profile. The Mo-W-Ta
systematics of the Chhindwara profile could suggest that Mo is scavenged more readily than
W in this case. The results of King et al. (2014) indicate that organic matter (OM) is also an
important factor in binding Mo in soils, although complexing of Mo with OM outside of the
topsoil and deeper within the saprolite is unlikely to outweigh the effects of primary mineral
budget and influence of oxyhydroxides. A final factor that is also important with regards to
Mo in the weathering profile is the potential for addition from allochthonous material (i.e.,
dust). By contrast to W, however, the samples at the flow-tops do not display Mo
enrichments, suggesting that either any Mo received at the flow-tops was redistributed in
ACCEPTED MANUSCRIPT
budget of the profile, but it is difficult based on the elemental data to fully address these
possibilities.
It is clear that more detailed investigations of Mo geochemistry, both elemental and isotopic,
of weathering profiles developed on different lithologies and across geological time are
needed. The critical zone processes that control the retention or release of Mo are of
particular interest to understanding the stable isotope systematics of Mo in the hydrosphere.
For instance, at present, it is known that river waters are variably enriched in the heavier
isotopes of Mo relative to igneous rocks and at least some of this fractionation is caused by
preferential retention of lighter Mo isotopes in soils, in tandem with catchment geology
variation and riverine Mo removal (Archer and Vance, 2008; Pearce et al., 2010; Neubert et
al., 2011; Voegelin et al., 2012).
The results of the present study are limited in scope by only providing bulk elemental Mo and
W concentrations. Taken at face value, however, it appears that a greater mobility and flux of
W over Mo occurs during weathering of the Deccan Traps basalt. This finding may relate to
the absence of easily weathered sulphides, but awaits a detailed micro-mineralogical
investigation. It is worth noting that Arnόrsson and Óskarsson (2007) showed that while
Fe-Ti oxides likely host the majority of W and Mo in Icelandic basalt, the main supply of these
elements to fresh waters is linked to the dissolution of plagioclase, pyroxene, and volcanic
glass. Regardless, the findings of this study emphasise a major mass balance problem with
respect to the Mo/W ratios in the hydrosphere. Because W and Mo have similar
concentrations in the average upper continental crust (~1 ppm; e.g., Rudnick and Gao, 2003;
Konig et al., 2011) and display conservative marine behaviour, it is predicted that they would
have similar oceanic inventories. However, the observed concentration of Mo in seawater
(~100 nmol kg-1) is significantly higher than that of W (~50 pmol kg-1) with an average molar
ACCEPTED MANUSCRIPT
if W is preferentially removed over Mo from the ocean or by invoking a greater retention of
W on land. Previous studies have supported the former explanation by demonstrating the
greater adsorption potential of W over Mo on some Mn-Fe oxyhydroxides and clay minerals
(e.g., Sohrin et al., 1987; Kashiwabara et al., 2013; Gustafsson, 2003). However, Firdaus et
al. (2008) noted that Mo/W ratios tend to increase at all stages in the crust-to-ocean pathway
of the elements. Therefore, on a global scale, weathering on land must preferentially release
Mo over W and that W must behave less conservatively than Mo at certain and currently
unconstrained stages of aqueous transport prior to reaching the oceans. The former could, in
part, be explained by the flux of both elements from land being dominated by release from
substrates with a high Mo/W, such as basalt, even if the loss of W exceeds that of Mo as in
the case of the Chhindwara weathering profile.
In deep geological time, the marine Mo inventory was drastically different from today’s and
it has been reasoned that Mo flux from land only became significant after the rise of
atmospheric oxygen at the GOE, due primarily to continental sulphide weathering, such that
the supply was able to exceed its withdrawal into marine sediment (Anbar et al., 2007; Scott
et al., 2008; Large et al., 2014). By contrast to Mo, however, very little is known about the
oceanic W supply and oceanic removal in deep time, although some modern constraints may
be relevant. For instance, W flux from mid-ocean ridge hydrothermal activity seems to far
exceed that of Mo (Kishida et al., 2004). If W supply, whether from hydrothermal activity or
increased subaerial exposure of mafic-ultramafic rocks, had coincided with a greater W
solubility, the Precambrian oceans may have had a much lower Mo/W ratio than at present.
This could be supported by the observation that W-containing enzymes are a more ancient
biological innovation (being present only in prokaryotes) than the comparatively more
prolific Mo-containing enzymes (e.g., Andreesen and Makdessi, 2008). Thus, in order to fully
ACCEPTED MANUSCRIPT
only after a more complete picture of the aqueous geochemical cycles of Mo and W in the
modern environment has emerged.
4.2 Nd isotopes and Th as fingerprints of aeolian dust in weathering profiles
Immobile element and isotope ratios of weathering profiles have been used to calculate the
mass of dust in weathering profiles under the assumption that the composition of the profile
represents a mixture of the end-member composition of dust and the protolith (e.g., Chadwick
et al., 1999; Kurtz et al., 2001). However, Ma et al. (2010) proposed incongruent release of
radiogenic over non-radiogenic isotopes (143Nd>144Nd and 176Hf>177Hf) during intense basalt
weathering which would invalidate the previous two-component mixing assumption. This
proposal was based on deviations in the respective isotopic ratios and mass balance
considerations that used Th as the immobile index element. Closer inspection of the data,
however, reveals that samples nearest the soil surface exhibit excursions in Th/Nb and Th/Zr
ratios that inversely correlate with the 176Hf/177Hf ratio. Thus, the proposal of preferential
release of radiogenic Nd and Hf rests with the validity of Th immobility and mass
conservation.
In our view, the change in Th/Nb and Th/Zr ratios is more likely caused by the addition of an
extraneous component with higher Th and a lower 176Hf/177Hf ratio (both general
characteristics of the average upper continental crust) and redistribution of this component
within the profile. Therefore, the data presented by Ma et al. (2010) can be explained without
incongruent fractionation of Hf isotopes. This likely extends to the Nd isotope values as well,
although the greater mobility of Nd complicates direct correlations. This example emphasises
the importance of carefully evaluating the HFSE characteristics of weathering profiles and
ACCEPTED MANUSCRIPT
immobility for Th and Nd and a lack of 143Nd/144Nd fractionation during incongruent
weathering is assumed, such that correlated Th/Nb and Nd isotope excursions from basaltic
protolith values are indicative of aeolian dust contamination in the basalt profiles.
4.2.1 Chhindwara profile
Apart from the HFSE ratio variation between the adjacent flows (Section 3.1.1), there are two
subtle, but horizon-specific deviations in the Th/Nb ratio in the Chhindwara profile that were
alluded to in previous discussion. The first is at the modern soil surface (ChQB11), where the
Th/Nb ratio is higher at 0.216 when compared to the mean ratio of the remaining flow
(0.178±0.003; Figure 2). The second is present in the three uppermost samples of the lower
flow (ChQA10-ChQA12), where the Th/Nb ratio in ranges from 0.220-0.233 compared to the
mean of 0.209±0.003 in the remaining 9 samples below. Due to the low solubility of both Th
and Nb, these deviations are most plausibly explained by Th enrichment from the addition of
an extraneous (allochthonous) material with a higher Th/Nb ratio. The higher Th/Nb ratios
are accompanied in most samples by deviations towards lower Zr/Nb, higher W/Ta, and
extreme alkali element enrichment (Babechuk et al., 2014). It was previously proposed in
Babechuk et al. (2014) that the origin of the flow-top alkali element enrichment was the
addition of aeolian dust. To test this hypothesis, the samples at the top of the lower flow
were analysed for their Nd isotope composition. The data reveal an excursion towards
slightly less radiogenic 143Nd/144Nd values, especially in sample ChQA12 nearest the paleo
flow-top, relative to samples deeper in the flow (Figure 2). The isotopic deviation is subtle,
but is outside of the error of the 143Nd/144Nd ratio measurement. Although alkali element
enrichment can also be achieved through fluid-rock interaction, the HFSE and Nd isotope
data presented here appear to eliminate this possibility, and instead provide strong support for
an aeolian origin. By extension, this may argue against a metasomatic origin for alkali
ACCEPTED MANUSCRIPT
that high-precision Nd isotope and HFSE data may also explain the ambiguous origin of
alkali element enrichment in other weathering profiles (e.g., Sheldon, 2003). Although the
exact nature of the added dust is unknown, all of the chemical features are consistent with a
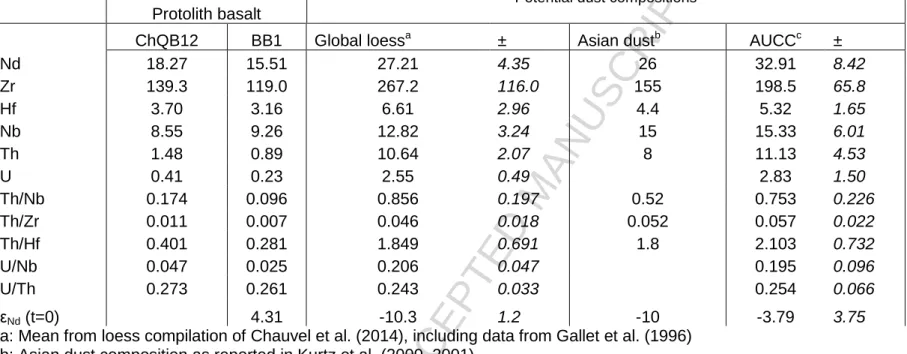
composition similar to average upper continental crust (Table 4).
The constancy of the ratios of the least-mobile HFSE (Zr-Hf-Nb-Ta-Th) below the paleo
flow-top of the lower flow (ChQA) and in the overlying upper flow (ChQB) indicates that
contamination by dust at the paleo flow-top preceded the emplacement of the upper flow.
Addition of dust (e.g., ash and other atmospheric particles) could have been achieved in two
possible ways: it may have been introduced at the time of flow emplacement and mixed with
the lava at the surface; or, it may have settled into the flow top after cooling and then
percolated in the profile as far down as the base of the porous flow top breccia and associated
vesiculation. Given that these flows are of the inflation pahoehoe type, rather than those
characterised by surface disruption, and were emplaced remote from exposed basement
lithologies, a post-eruption period of aeolian dust accumulation seems the more plausible
explanation. Crucially, although the observed shift in the Nd isotope ratio is quite subtle, it
nevertheless highlights the sensitivity of the basalt to overprinting and opens the possibility
that such signatures may be a useful paleoclimatic fingerprint between basaltic eruptions.
Further study may reveal that isotopic and trace element fingerprinting of Deccan bole beds
can contribute to estimating exposure time, degree of aeolian contamination, and the history
of potentially evolving dust sources.
4.2.2 Bidar profile
The depth variation of isotope ratios previously demonstrated the overprinting of the Bidar
profile chemistry by dust (Mason et al., 2000; Kisakürek et al., 2004; Wimpenny et al., 2008),
ACCEPTED MANUSCRIPT
The Th/Nb ratio of the incipiently- to intermediately-altered saprolite (BB2-BB3:
0.0975-0.0978) is similar to that of the protolith (BB1: 0.0957), but increases significantly upwards
from BB4 to BB9 reaching values as high as 0.530 (BB8). This upward change parallels the
increasingly open and porous structure of the upper parts of the lateritic weathering profile.
Assuming near-equivalent immobility of the two elements during chemical weathering
(similar to the Chhindwara profile), increases in the Th/Nb ratio indicate selective Th
enrichment. The magnitude of Th enrichment can be expressed more quantitatively using a
percent change in Th/Nb ratio relative to the protolith; if Nb is assumed to have been
immobile and the change in Th/Nb is attributed purely to Th addition, the most contaminated
samples have experienced a 400% increase in Th relative to the protolith (Figure 3b). This is
consistent with the addition of a significantly more trace element enriched source. Whereas it
is likely that some Nb was also contributed from dust, the relatively low Nb content of upper
continental crust and the constant Zr/Nb ratio in the Bidar laterite indicate that, in this system,
it has been negligible by comparison to Th (Kurtz et al., 2001). Similar to Th/Nb, the U/Nb
ratio increases progressively upwards to a value of 0.113-0.110 in BB8-BB9, with a distinct
excursion in sample BB6 with U/Nb ratio of 0.776. Trends towards higher U/Nb ratios are
not predicted based on the greater mobility of U relative to Nb, indicating that the U
chemistry is highly influenced by dust and more complex internal cycling and deposition. In
addition to the Th-U-Nb trends, significant variation with depth is expressed in the Nd
isotope ratios, where the εNd is identical in the protolith and incipient saprolite (BB1-BB2:
4.31-4.38), but decreases upwards towards significantly less radiogenic values from BB3 to
BB9, following a more linear upward trend (Figure 3c). These isotope and trace element
fingerprints of dust are similar to those observed in the Chhindwara flow tops and other
basalt profiles (Kurtz et al., 2000, 2001), although indicate a substantially greater magnitude
ACCEPTED MANUSCRIPT
Quantitative assessment of the amount of dust added to a weathering profile requires
reasonable knowledge of the dust composition. Outside of examples of young soil
chronosequences with constrainable exposure histories (e.g., Chadwick et al., 1999; Kurtz et
al., 2001), linking the fingerprint of dust in older weathering profiles to a specific source and
unravelling the timing of dust addition are inherently more complicated. Nevertheless, based
on the current location of the Bidar profile and the paleogeographic context of the Indian
plate, two source areas of dust delivered to the Deccan Traps are deemed plausible: the
exposed Archean-Proterozoic terrain outcropping to the south and east of the Deccan
Volcanic Province; or, areas known to be prominent dust sources at present day (i.e.,
Sahara/Arabia or from the central Asia region; Grousset and Biscaye, 2005), as visualised in
Figure 5.
Previous studies have determined the mass fraction of a dust-derived element in a sample
(Chadwick et al., 1999; Kurtz et al., 2001) from isotope or trace element ratios, as shown for
Nd and Th using equations 2 or 3, respectively, under the assumption that the ratios in both
equations change from that of the basalt in the weathering profile only or primarily as a
function of the added dust:
Eq. 2:
Eq. 3:
where X is an immobile trace element (e.g., Nb, Ta, Zr, Hf) that is less influenced by dust
input than Th.
Based on the known or assumed trace element concentration of the dust source, i.e., [Y]dust,
ACCEPTED MANUSCRIPT
dust ( ) can be calculated from the value and the ‘bulk’ concentration of the
element in the sample [Y]sample from equation 4:
Eq. 4:
The mass of a dust-derived element (mg cm-2) can be determined from the sample density (ρ)
and extrapolated to horizons of defined thickness (h) in the profile using equation 5:
Eq. 5:
The mass of each element in a horizon can then be divided by the concentration of the
element in the dust source [Y]dust and summed for each horizon to determine the total mass of
dust accreted (g dust cm-2) in the profile as described in Kurtz et al. (2001).
In the Bidar profile, horizons are divided by assuming that the measurements of the first
sample (BB1) represent the interval between its sample depth and that of the overlying
sample (h=1200 cm) and so on to the uppermost horizon represented by BB9 and extending
to the surface (h=200 cm). To apply the mixing model equations to the Bidar laterite, which
is contaminated by dust from an unconstrained source, assumptions have to be made
regarding the dust composition. First it is assumed that the dust had a similar elemental
composition to the average upper continental crust as represented by a global loess
compilation (Chauvel et al., 2014; Gallet et al., 1996), with a Th and Nd concentration of
10.64 and 27.21 ppm, respectively, and Th/Nb, Th/Zr, Th/Hf ratios of 0.856, 0.046, and
1.850, respectively (Table 4). These values all contrast substantially with those of the parent
basalt (BB1) and are similar to the Asian dust values estimated for the allochthonous
component in Hawaiian basalt (Kurtz et al., 2000, 2001; Table 4). This initial assumption is
reasonable because most Th/X ratios in upper continental crust proxies agree quite well (e.g.,
ACCEPTED MANUSCRIPT
crustal composites have the high Th concentration in the allochthonous end-member required
to alter the Th/X ratios of the profile. Based on Th/Nb, Th/Zr, Th/Hf ratios, the calculated
mass fraction of dust-derived Th increases upwards in the Bidar profile (see Figure 3e for
mass fraction based on Th/Nb values) with similar overall dust accretion masses of 580, 760,
and 740 g dust cm-2, respectively (differences generated primarily by the variation of the
Th/X ratios in BB8 and BB9). By comparison with the much thinner and younger basalt soils
from Hawaii (Kurtz et al., 2001), the total amount of accreted dust added to the Bidar profile
is substantially larger with a mass fraction ( ) reaching greater than 0.5 in the
uppermost parts of the profile, and is due to the highly protracted development and exposure
history of the laterite.
By contrast to similarity in elemental composition and Th/X ratios of potential dust sources,
the Nd isotope characteristics can be more divergent. The global loess compilation has an
approximate εNd of -10 (Table 4) whereas the antiquity of the Archean-Proterozoic shield
results in substantially less radiogenic Nd isotope values in trace element rich rocks (e.g.,
mean εNd of -34±6 for Neoarchean granitoids and rhyolites of the Dharwar Craton; Mohan et
al., 2013). With the same Nd concentration of 27.21 ppm, the effect of the less radiogenic
(older) Nd dust source relative to that similar to that of the UCC would be a significantly
lower dust-derived Nd input and mass fraction of dust in each sample (Figure 3e). The total
mass of accreted dust calculated from a source with εNd of -34 is 630 g dust cm-2, whereas a
dust source with εNd of -10 results in a mass of 1650 g dust cm-2. The dust calculations based
on Nd, however, are much more highly influenced by uncertainties resulting from depletion
of Nd in the basalt prior to dust accumulation, the prolonged and intense weathering history
that redistributes Nd, and the unknown isotopic composition of the source. At present, we
suggest that the closer agreement between the fraction of dust-derived Th ( ) and
dust-derived Nd ( ) from a source with ε
ACCEPTED MANUSCRIPT
laterite, is more consistent with the dust source being from a younger or a more diversely
mixed end-member. However, it is clear that the Nd isotopes are incapable of unambiguously
resolving the dust end-member at present and we propose that better constraints could be
made from Hf isotope systematics due to the near-equal immobility of Hf, Zr, and Nb in the
profile (Section 4.1.1).
4.2.3 The fate of dust during lateritisation
More robust estimates of dust addition (based on either Th or Nd) are principally limited by
the relatively coarse sampling density throughout the Bidar profile. Rather than placing too
much emphasis on the assumption that thick horizons of laterite are accurately represented by
the chemistry of 9 samples, we instead focus on the qualitative chemostratigraphic trends of
the dust-derived elements, which are independent of the assumed isotope composition of the
dust and provide insight into the fate of dust-derived elements after addition to the profile. If
the dust-derived Nd and Th had been brought in together and not separated chemically after
accretion, a correlation between the and
in each sample would be expected (i.e.,
the dust-derived Th and Nd originally had the same distribution in the profile). Instead, the
diverging topology with depth in the profile for and
(and the mass fraction of dust
calculated from each; Figure 3e) as well as the percent change in Nd/Nb and Th/Nb (Figure
3d) suggests a contrasting chemical mobility of the two dust-derived elements.
The Th/Nb ratios and associated Th-based dust estimates increase only minimally in the
saprolite horizons of the profile (BB2-BB4) from the protolith (BB1), but increase
substantially towards the surface within the laterite horizons (BB5-BB9; Figure 3). This
chemical distribution is proposed to reflect the changing morphology of the laterite profile
and is consistent with dust trapping at the surface and winnowing downwards until the
ACCEPTED MANUSCRIPT
the dust is retained in the upper horizons and the reduction in pore size filters the dust as it
percolates down through the profile to the point that only the finest dust fraction can
penetrate into the saprolite zones. In other words, the Th chemistry is interpreted to reflect
primarily physical translocation of the dust in the laterite.
The Nd/Nb ratios and Nd-based dust estimates indicate a greater solubility and more complex
redistribution of the REE in the laterite (Figure 3). The majority of the profile is highly
depleted in Nd relative to the protolith, apart from samples BB3 (depth of 2600 cm) and BB6
(depth of 1100 cm). The isotopic composition of all samples from BB3 to BB9 indicate that
they contain dust-derived Nd. Apart from the uppermost samples BB8 and BB9 it is also
evident that the and mass fraction of dust calculated from Nd is higher in all samples
deeper in the profile by contrast to the same parameters calculated using Th/Nb ratios (Figure
3e). These observations implicate remobilisation of the REE in the profile through dissolution
and precipitation, including dust-derived Nd. The enrichment of the REE (and many other
trace elements) in sample BB6 was previously inferred to represent accumulation at a
paleo-water table zone (Kisakürek et al., 2004), whereas the REE enrichment in sample BB3 is
interpreted to represent precipitation of secondary phosphates at a pH/porosity boundary deep
in the profile (Babechuk et al., 2014; Viers and Wasserburg, 2004; Cotten et al., 1995). With
regards to the deep sample (BB3), which does not contain dust-derived Th, the isotope
composition independently confirms that the REE enrichment is the result of downward
migration of REE, since it necessitates that at least some of the Nd was derived from the dust
higher in the profile. Accordingly, it provides further evidence that the REE are hosted in a
secondary phase that precipitated from weathering fluids. It also suggests that Th stayed
lattice-bound to the incorporated allochthonous mineral(s) and did not