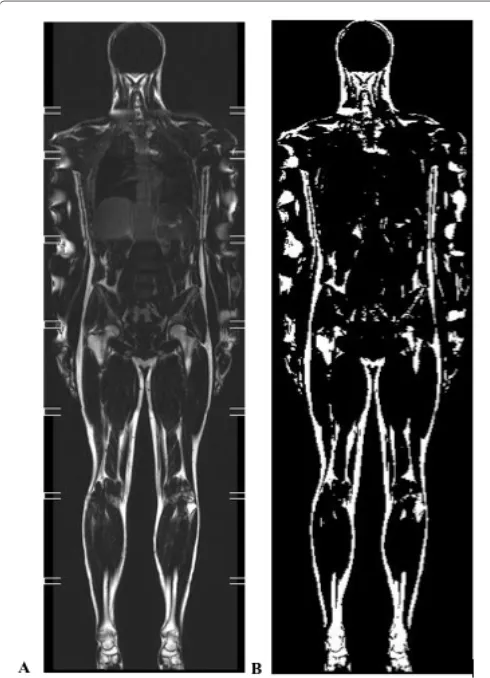
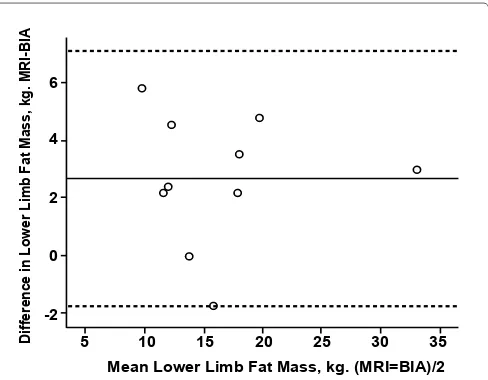
Comparison of bioelectrical impedance analysis and magnetic resonance imaging for the quantification of fat mass
Full text
Figure
Related documents
19% serve a county. Fourteen per cent of the centers provide service for adjoining states in addition to the states in which they are located; usually these adjoining states have
Our study successfully implemented a referral program for maternal contraceptive services within pediatric care by having pediatric residents assess postpartum women ’ s needs
It was decided that with the presence of such significant red flag signs that she should undergo advanced imaging, in this case an MRI, that revealed an underlying malignancy, which
In the present study, we have evaluated the expression of EIF2B5 in liver cancer, analyzed the relationship between EIF2B5 expression and clinical features, and explored the
Purpose: To assess the 3-year safety and ef fi cacy of femtosecond laser-assisted intrastromal corneal ring segments' (ICRS) implantation followed or accompanied by
The constraint j + = i is analogous to the treatment of data for individual gene loci, in which case the observed allele frequen- cies in the sample are known to be
In terms of fingerprint matching false non matching ratio is calculated by the total non matched or total rejected fingerprint divided by the total overall attempts
Strains were typed by competitive enzyme-linked immunosorbent assay with rabbit antisera specific for serogroups O1 to O12 and monoclonal antibodies (MAbs) specific for sero- groups
