Forensic
Interpretation
of
Glass
Forensic
Interpretation
of
Glass
Evidence
James Michael Curran, Ph.D.
Tacha Natalie Hicks, Ph.D.
John S. Buckleton, Ph.D.
with contributions by
José R. Almirall • Ian W. Evett • James A. Lambert
This book contains information obtained from authentic and highly regarded sources. Reprinted material is quoted with permission, and sources are indicated. A wide variety of references are listed. Reasonable efforts have been made to publish reliable data and information, but the author and the publisher cannot assume responsibility for the validity of all materials or for the consequences of their use.
Neither this book nor any part may be reproduced or transmitted in any form or by any means, electronic or mechanical, including photocopying, microfilming, and recording, or by any information storage or retrieval system, without prior permission in writing from the publisher.
The consent of CRC Press LLC does not extend to copying for general distribution, for promotion, for creating new works, or for resale. Specific permission must be obtained in writing from CRC Press LLC for such copying.
Direct all inquiries to CRC Press LLC, 2000 N.W. Corporate Blvd., Boca Raton, Florida 33431.
Trademark Notice: Product or corporate names may be trademarks or registered trademarks, and are used only for identification and explanation, without intent to infringe.
© 2000 by CRC Press LLC No claim to original U.S. Government works International Standard Book Number 0-8493-0069-X
Library of Congress Card Number 00-030354
Printed in the United States of America 1 2 3 4 5 6 7 8 9 0 Printed on acid-free paper
Library of Congress Cataloging-in-Publication Data
Curran, James Michael.
Forensic interpretation of glass evidence / by James Michael Curran, Tacha Natalie Hicks, John S. Buckleton.
p. cm.
Includes bibliographical references and index. ISBN 0-8493-0069-X (alk.)
1. Glass. 2. Forensic engineering. 3. Ceramic materials. 4. Bayesian statistical decision theory. I. Hicks, Tacha Natalie. II. Buckleton, John S. III. Title.
TA450.C87 2000
616′.1—dc21 00-030354
Preface
In 1933 the problem of identifying certain minute splinters of glass was referred to the Dominion Laboratory in New Zealand. The splinters from the corner of an attaché case of the accused were alleged to be the result of
the case being used to break a shop window preparatory to taking goods.1
Refractive index and density were used in the comparison. Of 65 samples previously encountered only 1 matched in all respects to the glass from the attaché case and that 1 was the plate glass from the shop window.
The analysis of glass evidence for forensic uses was an exciting topic even before Nelson and Revell2 first carried out their backward
fragmenta-tion experiments and Ojena and De Forest3 perfected the method of
charac-terizing a fragment of glass by its refractive index.
This field of glass evidence interpretation was revolutionized in the late 1970s when a young Forensic Science Service (FSS) document examiner named Ian Evett4 decided to introduce statistics as a method for consistent
and objective evaluation of forensic glass evidence.
Evett discussed the problems facing forensic scientists with Professor Dennis Lindley. Lindley can be considered as one of the forefathers of mod-ern Bayesian thinking, given that he regularly entered into debate over the validity of the subject with the great Sir Ronald Aylmer Fisher who is con-sidered the founder of modern statistics. At the same time that Dr. Evett introduced statistics into the analysis of glass evidence, Professor Lindley remarked that the actual solution was a Bayesian one.5
This book evolved from an “interpretation manual” written by Evett, Lambert, and Buckleton for the FSS. Some material has been added and other areas updated. We also acknowledge Dr. José Almirall for the substantial amount of material he contributed to Chapter 1.
casework situations, or how this frequency applies to the questions before the court.
By using either method, most practitioners can interpret simple evidence such as one bloodstain left at a scene that matches a suspect. However, misleading statements and ad hoc solutions may result when the frequentist approach is applied to more complex cases. For instance, we have shown coherent methods to understand the value of the presence of glass per se. We have seen frequentists attempt to formulate this assessment, and both they and we feel that there is great value in this. Furthermore, both the Bayesian and frequentist schools would accept that the larger the group of
D.F. Nelson and B.C. Revell, Backward fragmentation from breaking glass, J.
Forensic Sci. Soc., 7, 58, 1967 (Reprinted with the kind permission of the Forensic
glass, the higher the value of the evidence (in most cases). The difference is that the Bayesian school can make a logical attempt to evaluate this evidence. It is possible to expose these differences with a simple case example. Consider a case where a man has been seen to shoulder charge six windows. A suspect is apprehended 30 minutes later and found to have two fragments of glass upon his highly retentive black jersey. These two fragments match one control. Simply quoting the frequency with which this match would occur, say 1%, might imply some evidence supporting the prosecution hy-pothesis. Presented with this case, frequentists perform one of several ac-tions. The more thoughtful of them start to say something along the lines that this does not appear to be much glass given the circumstance. In doing this, they are unconsciously evolving toward the Bayesian thought.
When computing power and the statistical tools required became avail-able in the early 1980s, Ian Evett, with the help of John Buckleton, Jim Lambert, Colin Aitken, and Richard Pinchin, developed an approximate Bayesian solution which was implemented and used in forensic casework.6,7
We call this implementation approximate for two reasons: (1) a full Bayesian treatment requires the evaluation of the entire joint distribution of the control and recovered samples (a task which still defies solution today), and (2) the approach still contains a “match”/“nonmatch” step. This second point was remedied by Walsh et al.8in the mid 1990s.
Since then there have been rapid advances in the statistical analysis of forensic glass evidence and the statistical evaluation of many other types of forensic evidence, the most notable of these being DNA. In the U.S. and many other countries around the world, forensic scientists have found the major focus of their work shifting toward the evaluation of DNA evidence. This initially involved the analysis of nuclear DNA found in blood, semen, and saliva, but in recent years mitochondrial DNA has also become an important source of forensic information. However, law enforcement is be-ginning to realize that DNA is not always available and there is a whole field of forensic science called trace evidence analysis.
It is for this reason that the authors decided to write a book on the statistical interpretation of glass evidence. Glass work accounts for some 20% of casework in New Zealand and 12% in the U.K. In the past, the U.S. has not had a strong history of forensic glass analysis, but with large amounts of federal funds formerly devoted to military applications being set aside for forensic research, we expect this to change rapidly over the next few years. The U.S. is at the forefront of research in the use of elemental concen-tration data as a means of discriminating between different glass sources.
her lab. To that end, in conjunction with this book, we offer free software (available by E-mailing James Curran at: curran@stats.waikato.ac.nz.html, courtesy of James Curran and ESR) that implements nearly all of the meth-odology in this book. We offer this software with the minor proviso that users must supply their own data because we are unable to give away some of the data sets mentioned in this book.
The examples and theory in this book primarily revolve around refrac-tive index measurements. However, where applicable, the methods have been extended for elemental concentration data. Caseworkers who deal with mostly elemental analysis should not be discouraged by this apparent slant. The theory is easily transferred to the elemental perspective in most cases by simply substituting the equivalent elemental measurement.
Chapter 1 is an introduction to the physical properties and methods for analysis of forensic glass analysis. This chapter is intended for forensic sci-entists new to the area of glass analysis, students of forensic science, and perhaps statisticians or lawyers who are interested in the physical processes behind the data.
Chapter 2 provides an introduction and review of the conventional or classical approaches to the statistical treatment of forensic glass evidence. Topics covered include range tests, hypothesis tests, and confidence inter-vals. Grouping of glass considered to have come from multiple sources, t -testing, coincidence probabilities, and a simple extension of the classical approach to the analysis of elemental data. By the end of Chapter 2, the
reader should be able to perform a two-sample t-test for the difference
between two means, carry out a range test, construct a confidence interval, and have a basic understanding of the statistical procedures necessary for automatic grouping of recovered glass samples.
Chapter 3 offers the reader an introduction to the application of Bayesian statistics to forensic science. Bayesianism is an entirely different approach to the subject of statistics. A Bayesian approach often requires more thought about the problem involved and the results desired. In this chapter the reader will learn the reasoning behind the Bayesian methods and hopefully gain some insight as to why this approach is preferred. In addition to Bayesian thinking, Chapter 3 introduces the rules of probability, the details of a Baye-sian approach to the statistical analysis of forensic glass evidence, and many worked examples to aid comprehension.
In Chapter 4 we attempt to summarize the experimental knowledge gained to date in the fields of glass frequency surveys and the prevalence of glass on clothing.
Chapter 5 describes survey work on transfer and persistence of glass. Many of these works will be familiar to the experienced glass examiner; however, they are presented with the deliberate attempt to make them rel-evant in the Bayesian framework and with some novel comparative work.
reader is introduced to histograms and their more robust extension and density estimates. This chapter also discusses the various software packages available for the evaluation of glass evidence.
The Authors
James M. Curran, Ph.D., is a statistics lecturer at the University of Waikato, Hamilton, New Zealand, with extensive publications in the statistical anal-ysis of forensic evidence. In 1994 he was awarded a scholarship from the Institute of Environmental Science Ltd. (ESR) to work on statistical problems in the analysis of forensic glass evidence. He received his Ph.D. from the University of Auckland, New Zealand, in 1997. During this period, Dr. Curran lectured and gave seminars at numerous conferences and universities in New Zealand and overseas. He also developed software that is now used for day-to-day casework in New Zealand and as a research tool in several laboratories around the world.
In 1997 Dr. Curran was awarded a postdoctoral fellowship from a New Zealand government agency, the Foundation for Research in Science and Technology (FORST). This provided Dr. Curran with funding to go to North Carolina State University in Raleigh, NC, for 2 years and work on statistical problems in DNA evidence. While in the U.S., Dr. Curran provided statistical reports or expert testimony in nearly 20 criminal cases involving DNA evi-dence.
The California Association of Criminalists and the U.K. Forensic Science Service awarded Dr. Curran the Joint Presidents Award for significant con-tribution to the field of forensic science by a young practitioner.
Tacha Hicks, Ph.D., graduated with honors in forensic science from the Institut de Police Scientifique et de Criminologie (IPSC) at the University of Lausanne. Her doctoral dissertation entitled “The Interpretation of Glass Evidence” explores many areas described in this book such as transfer and persistence, glass found at random, and knowledge-based systems.
John S. Buckleton, Ph.D., is a forensic scientist working in New Zealand. He received his Ph.D. in chemistry from the University of Auckland, New Zealand. Dr. Buckleton has coauthored more than 60 publications in the field of forensic science and has taught this subject internationally. Dr. Buckleton has helped develop a computerized expert system for the interpretation of glass evidence.
Contents
Chapter 1 Examination of Glass
1.1 History 1.2 Flat Glass 1.3 Float Glass 1.4 Toughened Glass 1.5 Laminated Glass 1.6 Glass Composition
1.7 Glass Breakage Under Impact 1.7.1 Breakage in Flexion
1.7.2 Determination of Side of Impact 1.7.3 Percussion Cone Breakage 1.7.4 Transfer of Glass
1.8 Physical Examinations
1.9 Examinations of Large Fragments 1.9.1 The Comparison of Thickness 1.9.2 The Comparison of Color
1.9.3 Matching Edges and Matching Hackle Marks 1.9.4 Density Comparisons
1.10 Examinations Performed on Small and Large Fragments 1.10.1 Recovering Glass
1.10.2 Examination of Transparent Material to Determine Whether It Is Glass
1.10.3 The Examination of Surface Fragments 1.10.4 Refractive Index Determinations 1.10.5 Dispersion
1.10.6 Refractive Index Anomalies
1.10.7 The Examination of Tempered (Toughened) Glass by Annealing
1.11 Elemental Composition 1.11.1 X-Ray Methods
1.11.1.1 Classification of Glass Using X-Ray Methods
1.11.2 ICP Techniques
1.11.2.1 Classification of Glass Using ICP Techniques
1.11.2.2 Discrimination of Glass Using ICP Techniques
1.12 Summary
1.13 Appendix A — Snell’s Law
Chapter 2 The Conventional Approach to Evidence Interpretation
2.1 Data Comparison
2.1.1 Range Tests and Use of Confidence Intervals 2.1.2 Confidence Interval
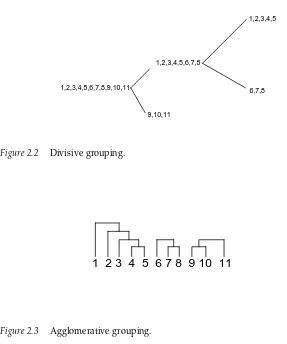
2.2 Statistical Tests and Grouping 2.2.1 Grouping
2.2.1.1 Agglomerative Methods 2.2.1.2 Divisive Methods 2.2.1.3 Performance 2.2.2 Statistical Tests
2.2.2.1 Hypothesis Testing 2.2.2.1.1 Student’s t-Test
2.2.2.1.2 Welch’s Modification to the Student’s t-Test
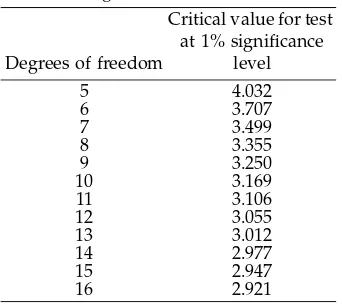
2.2.2.2 How Many Control Fragments? 2.2.2.3 Setting Significance Levels
2.2.2.4 Elemental Composition Measurements — Hotelling’s T2
2.2.2.4.1 The Multiple Comparison Problem
2.2.2.4.2 Hotelling’s T2 — A Method for
Comparing Two Multivariate Mean Vectors
2.2.2.4.3 Examples
2.2.2.4.4 Discussion on the Use of Hotelling’s T2
2.3 Coincidence Probabilities 2.4 Summary
2.5 Appendix A 2.6 Appendix B 2.7 Appendix C
Chapter 3 The Bayesian Approach to Evidence Interpretation
3.1 Probability — Some Definitions 3.2 The Laws of Probability
3.2.2 The Second Law of Probability 3.2.3 The Third Law of Probability 3.2.4 The Law of Total Probability 3.2.5 Bayes Theorem
3.2.6 The Relationship Between Probability and Odds 3.2.7 The Odds Form of Bayes Theorem
3.3 Bayesian Thinking in Forensic Glass Analysis 3.3.1 A Generalized Bayesian Formula 3.4 Taking Account of Further Analyses 3.5 Search Strategy
3.6 Comparison of Measurements: The Continuous Approach 3.6.1 A Continuous LR Approach to the Interpretation of
Elemental Composition Measurements from Forensic Glass Evidence
3.6.1.1 The Continuous Likelihood Ratio for Elemental Observations
3.6.1.2 Examples 3.6.1.3 Discussion 3.7 Summary
3.8 Appendix A
Chapter 4 Glass Found at Random and Frequency of Glass
4.1 Relevant Questions 4.2 Availability
4.3 Glass Found at Random (Clothing Surveys) 4.3.1 Glass Found on the General Population
4.3.1.1 Glass Recovered on Garments 4.3.1.2 Glass Recovered on Shoes 4.3.1.3 Glass Recovered in Hair
4.3.2 Glass Recovered on the Suspect Population 4.3.2.1 General Trends
4.3.2.2 Glass Recovered on Shoes
4.4 Comparison Between Suspect and General Populations: An Example
4.5 Estimation of the Probability of Finding at Random i Groups of j Fragments
4.6 Frequency of the Analyzed Characteristics 4.7 Control Glass Data Collections
4.8 Clothing Surveys
4.9 Characteristics of Glass Found on the General Population 4.9.1 Glass Recovered on Garments
4.9.2 Glass Recovered on Shoes
4.11 Comparison Between Suspect and General Populations: An Example
4.12 Summary
Chapter 5 Transfer and Persistence Studies
5.1 Transfer of Glass
5.1.1 Transfer of Glass to the Ground
5.1.1.1 Number, Size, and Distribution of the Fragments
5.1.1.2 Influence of the Window Type and Size 5.1.1.3 Presence of an Original Surface
5.1.2 Transfer of Glass Broken with a Firearm 5.1.3 Transfer of Vehicle Glass
5.1.4 Transfer of Glass to Individuals Standing Nearby 5.1.5 Transfer of Window Glass to Garments
5.1.6 Transfer of Glass with a Pendulum 5.1.7 Glass Broken Under Conditions Similar
to Casework
5.1.8 Transfer of Vehicle Glass and Absence of Glass 5.1.9 Transfer of Glass When a Person Enters Through a
Window
5.1.10 Influence of the Weather on Transfer 5.1.11 Transfer of Broken Glass
5.1.12 Transfer of Window Glass to Hair 5.1.13 Transfer of Window Glass to Footwear 5.1.14 Secondary and Tertiary Transfer 5.1.15 Transfer: What Do We Know? 5.2 Persistence of Glass on Garments
5.2.1 Early Studies
5.2.2 Persistence of Glass on Clothing 5.2.3 Persistence of Glass on Shoes 5.2.4 Persistence of Glass in Hair 5.3 Main Results of the Studies
5.4 Modeling Glass Transfer and Making Estimates 5.4.1 Graphical Models
5.4.2 A Graphical Model for Assessing Transfer Probabilities
5.4.3 Results
5.4.4 Conclusions from the Modeling Experiment 5.5 Appendix A — The Full Graphical Model for
Assessing Transfer Probabilities
Chapter 6 Statistical Tools and Software
6.1 Data Analysis
6.1.1 Histograms and Lookup Tables 6.1.1.1 Constructing a Histogram 6.1.2 Constructing a Floating Window 6.1.3 Estimating Low Frequencies 6.1.4 Density Estimates
6.1.4.1 Random Variables and Probability Density Functions
6.1.5 Kernel Density Estimators
6.1.5.1 What Is a Good Tuning Parameter for a Kernel Density Estimator?
6.2 Calculating Densities by Hand 6.3 Computer Programs
6.3.1 The Fragment Data System (FDS) 6.3.2 STAG
6.3.3 Elementary 6.3.4 CAGE 6.4 Summary 6.5 Appendix A
Chapter 7 Reporting Glass Evidence
7.1 Verbalization of a Likelihood Ratio Answer
7.2 Sensitivity of the Likelihood Ratio Answer to Some of the Data Estimates
7.3 The Effect of Search Procedures 7.4 Fallacy of the Transposed Conditional
chapter one
Examination of glass
José Almirall, John Buckleton, James Curran, and Tacha Hicks
A forensic scientist may be asked to examine glass to reconstruct events (for example, to determine whether a pane of glass was broken from the inside or outside) or to associate a person or an object with the scene of a crime or a victim. The strength of the opinion of the forensic scientist depends on many factors, including the nature of the background information and com-parisons used, the type of glass involved, whether it is rare or common, and how well it is characterized.
This chapter will consider the examinations and comparisons that are often used in the evaluation of glass as evidence. This is preparatory to introducing modern and classical methods for the interpretation of the alleg-edly transferred material. We also include a brief description of glass man-ufacturing processes and composition of glass, as these are important in understanding the examinations to be performed and the sources of variation to be expected. We cover measurements such as comparison of thickness, color, density, and more extensively the measurement of refractive index and elemental analysis, two of the dominant techniques in modern laboratories. It is our intention, however, to introduce these methods rather than give an extensive review of them.
1.1 History
Glass is defined as “an inorganic product of fusion that has cooled to a rigid condition without crystallization.”
The first glass objects used by man probably originated from naturally occurring sources such as obsidian, from which sharp tools may be chipped. It is believed that manmade glass originated in the regions now known as Egypt and Iraq around 3500 years ago.9 Pliny, the Roman historian, recounts
a story whereby Phoenician sailors propped a cooking pot on some blocks
of natron (an alkali). They noticed that the sand beneath the fire had melted and assumed the properties of a liquid. Upon cooling, they also noticed that the liquid hardened into the material now known as glass. Modern scholar-ship suggests that glass developed from faience, an older material made from crushed quartz and alkali. These same ingredients in different propor-tions form a true glass.
1.2 Flat glass
The development of flat glass manufacturing methods progressed through the early 20th century, first in Belgium with the Fourcault process.10 In this
[image:20.441.62.384.333.560.2]process, the components are first melted in a large tank (which little by little dissolves itself in the molten glass, so that traces of the tank [zirconium, for example] are present in the glass product). The sheet of glass is then drawn vertically through a slotted refractory in a continuous ribbon. The problem of “necking down” to a narrow ribbon was solved by chilling the ribbon against paired rolls that gripped the sheet edges. Glass made this way has a fire finish or polish which is the brilliant surface achieved by allowing molten glass to cool to rigidity without contact. The solidified ribbon, how-ever, has a noticeable amount of waviness. Figure 1.1 shows a diagrammatic sketch of the Fourcault process.
Figure 1.1 Diagrammatic sketch of the Fourcault process.
Drawing machine and vertical lehr
Glass
Sheet coolers
Later in North America the Libbey-Owens and Pittsburgh methods refined this. The latter replaces the depressed debiteuse with a submerged drawbar, but otherwise the principle and outcome are the same.
Glass drawn from a molten source in this manner is referred to as sheet glass and typically has a fine finish with optical distortions due to minor thickness variations. The term “sheet glass” has been used in forensic texts to mean either any flat glass or glass made by this wire drawn method. This latter definition seems better and will be used in this book.
Sheet glass has a minor amount of visual distortion due to minor vari-ations in thickness. Plate glass was developed to overcome the problem of visual distortion. Typical plate glass production has two predominant steps: first, rough blank production and, second, the grinding and polishing stage. Plate glass was possibly first produced by pouring onto a flat base and rolling to produce the rough blank. A factory in St. Gobain, France was built for this purpose in 1688. Modern machines produce the rough blank by rolling glass directly from the spout and automate grinding and polishing.
Patterned glass may be produced by a number of methods, but mass produced patterned glass is typically made by squeezing the flow of molten glass between paired water-cooled rollers. One or both rollers impress the desired pattern. Wired glass can also be made by feeding wire mesh between the forming rollers.
1.3 Float glass
The float process was developed by the Pilkington company in Britain. The incorporation of a liquid tin bed in the float process leads to a smooth and flat surface. The molten glass is delivered onto a bed of liquid tin where the glass “floats” over the metal. Rollers on the sides pull the glass to a desired thickness depending on the speed of the pull. The float process is currently used for the manufacture of the vast majority of flat glass (see Figure 1.2). It is important to note that the surface in contact with the tin will show luminescence when excited at 254 nm, enabling the forensic scientist to identify float glass (elemental analysis with the scanning electron microscope [SEM] also allows the identification of float glass). It has also been shown that this manufacturing process induces a gradient in the refractive index of the glass, which becomes anisotropic.
1.4 Toughened glass
jets on both sides. This compresses the surfaces and places the center in tension. The process is believed to strengthen (toughen) the glass because surface flaws are thought to initiate breakage. Flaws initiate breakage when the glass is in tension. Inducing surface compression reduces or eliminates this tendency. The center, in tension, cannot possess surface flaws. Modern trends in tempering include the move to thinner glass (a cost-saving mea-sure) and quick sag bending, a shaping technique.
Large fragments of tempered glass may appear in casework in hit and run incidents or more rarely in the pockets of clothing. Such large fragments may be recognized as tempered by their diced appearance and by the pres-ence of a frosted line through the middle of the cube (see Figure 1.3).
The identification of glass as “toughened” by polarized light microscopy has been reported for fragments measuring more than 20 mm3.11 Sanger
concluded that correctly mounted and lit fragments exhibiting brightness, if not colors, must be toughened. Small fragments not exhibiting brightness may still be toughened, but below the size required to produce the effect. The authors are unaware of any laboratory using this method. With the small
Figure 1.2 Flat glass production in the U.S. from 1964 to 1980.
Figure 1.3 Characteristics of tempered glass cubes, such as frosting in the middle
of the cube.
0 500 1000 1500 2000 2500 3000 3500 4000
1964 1965 1966 1967 1968 1969 1970 1971 1972 1973 1974 1975 1976 1977 1978 1979 1980
Millions of ft
fragments typical of glass recovered from clothing, these observations cannot be made, and for fragments of this size annealing has become the method of choice.
1.5 Laminated glass
Another modern trend is the increased use of laminated glass. This is a composite typically of a sheet of plastic between two sheets of flat glass. Flat or shaped laminates may be produced and are dominant in modern wind-screens. The two sheets may be taken from one pallet, in which case they are typically very similar, or from two pallets, in which case they may differ. Some applications deliberately call for color differences in the two sheets. Laminates are noted for their ability to resist penetration, acting as security glass or to restrain passengers within a vehicle during collision.
1.6 Glass composition
Soda-lime glass accounts for the majority of the glass manufactured around the world, producing windows (flat glass) for buildings and automobiles and containers of all types. The major components in the raw materials for this type of glass are sand (SiO2, 63 to 74%), soda ash (Na2CO3, 12 to 16%),
limestone (CaO, 7 to 14%), and cullet. The major component (or primary former) is sand, and if it is of very high quality then it is sufficient to produce glass. However, because of the high purity and temperature required to melt sand, soda ash and potassium oxides are added to lower the melting point. Limestone is then used so that the glass becomes insoluble in water and acquires a higher chemical durability. As the products used are not pure, other processes designed to improve purity may be necessary. Of particular concern for the manufacturer is iron or chromium contamination in the sand deposits, which can lead to undesirable coloring.* The impurities in the main products, such as those in cullet, the potassium oxides in soda ash, the magnesium as well as aluminum oxides in the lime, or strontium in dolomite (a source of CaO and MgO), can be used by the forensic scientist to discrim-inate glass of the same type.
Depending on the end use of the product and on the manufacturing process, special components will be intentionally used.
• Boron oxide (B2O3), for example, will be added to improve heat
du-rability in glass intended for cookware, laboratory glassware, or au-tomobile headlamps.
• Lead oxide (PbO) will improve the sparkling effect of glass or absorb radiation (it is also used for stemware, neon, electrical connections, thermometers, and eyeglasses).
* The manufacturer will add CeO2 (As2O3 was formerly used), SbO, NaNO3, BaNO3, K2SO4, or
• Other examples are the addition of silver (Ag) in sunglasses and of strontium in television screens in order to absorb radiation.
Depending on its use, glass will also contain different quantities of the same elements. For example, container glass will have a low level of mag-nesium, iron, and sodium compared to flat glass.
1.7 Glass breakage under impact
In order to understand transfer mechanism, we will discuss breakage under impact. There is a separate body of knowledge relating to breakage under heat stress. As a preliminary rule, glass is strong in compression, but weak in tension. This fact in itself explains a lot regarding glass breakage. However, there are two different ways in which glass may fail under impact.12 Failure
to recognize these two different mechanisms has led to some erroneous thinking. For instance, a toughened “glass will arrest the fall from a couple of stories height of a massive steel ball…but it will collapse like a bubble from the impact of a little steel dart dropped from the height of four inches.” This example defines the two fracture mechanisms: the flexural type or the bump check (percussion cone) type.
Despite their names, both types can be produced under static conditions or under impact. Glass breaking under flexion will typically have a break origin opposite the point of stress (or impact) (see Figure 1.4).
The effect of “flaws” as points of initiation has long been known.13Flaws,
especially on the surface opposite to the force, greatly reduce the strength of the glass to flexion breakage.
Flexural stresses are essentially the same for any object and are deter-mined more by the kinetic energy of the striking object rather than by the nature of the object itself. Therefore, the stress imparted by a wooden bat and a steel ball is similar with respect to flexural stress. Bearing stress and
Figure 1.4 The origin of breakage.
the tendency to produce percussion cones, however, is very different for these two objects.
Key elements, therefore, in examining breakage are flexibility vs. strength of the glass and the nature of the impacting object. An object cannot start a percussion flaw if it is too soft to do so.
Small, hard objects moving rapidly do damage mainly by starting per-cussion cones (however, refer to the disper-cussion of rifle or gun shots later), whereas massive objects (of any hardness) traveling slowly initiate breakage in flexion.
1.7.1 Breakage in flexion
The concept of breakage in flexion is essentially the same in flat glass and container glass except that in container glass the principle is modified by the presence of flexibility restricting parts of the bottle such as the base of the bottle. Here we consider flat glass.
Remember that glass is weak in tension and strong in compression. Consider then a pane of glass under flexion pressure held firmly at the edges (see Figure 1.5). Point A is in tension and is likely to be the origin of the breakage. The opposite side is in compression and will typically not initiate breakage (under flexion stress). Radial cracks will begin at point A and will radiate out in several directions. Points B and C are also in tension and will typically initiate concentric fractures. Hence, the “spider’s web” appearance of flat glass after flexion breakage.
1.7.2 Determination of side of impact
This determination is performed by an examination of ridges on the broken surfaces of the glass. These ridges are termed rib or hackle marks. According to Preston,14 the long curved lines have been termed rib marks, while the
shorter straight lines are hackle marks (see Figure 1.6).
Figure 1.5 The origin of breakage under flexion.
B C
The fracture always approaches the rib mark from the concave side and leaves from the convex side. In a region of tension the fracture will travel rapidly, leaving the rib marks well spaced, whereas in an area of compression they will be closer together.
A single, well-defined rib occurs at the termination of the fracture and is a clue as to whether a fracture has extended subsequently.
To perform this examination, the glass remaining in the frame should be labeled inside and outside and much of the glass from the ground should be retained. The examiner begins by reconstructing the pane until the point of impact is obvious. The examiner should not rely on the triangular shape of a single piece or of cratering to determine the point of origin, but rather should reconstruct the pattern of radial and concentric cracks. Then the “four Rs” rule may be applied.15,16
Ridges on Radial cracks are at Right angles to the Rear.
The origin of the rule can be seen by considering the tension and com-pression sides of the glass. The closely spaced rib marks are on the compres-sion side, whereas widely spaced ones are on the tencompres-sion side. Typically, the tension side is at the rear in flexion breakage for the radial cracks; therefore, the widely spaced ridges are to the rear.
[image:26.441.61.382.67.292.2]This rule is unreliable on laminated glass. However, the side of impact is usually obvious in laminated glass due to the fact that it remains deformed after breakage.
Fractures in tempered glass appear to originate in the central region regardless of where the point of impact was. The surfaces of tempered glass are in compression, whereas the central region is in tension. This makes interpretation of hackle marks in tempered glass difficult.17
Photography of rib or hackle marks is facilitated by shadow photography.17
1.7.3 Percussion cone breakage
Perhaps the most obvious small, high velocity, and dense object that may strike glass is a bullet (see Figure 1.7), although cases involving sling shots and other projectiles are known.
Experiments on shooting through glass show fractures both of the flexion type and the percussion cone type. “Flexure breaks, essentially radial cracks, form first and then the percussion cone is driven through to the rear side. This is attested by the fact that the conical flaw was not smooth and perfect, but made up of radial segments which terminated against the radial cracks.”12
Care should be taken if the projectile has not penetrated the glass, as the larger side of the percussion cone may be toward the point of impact.
[image:27.441.122.321.205.441.2]When two projectiles penetrate a pane of glass the sequence can be determined from the observation that the cracks for the second impact ter-minate at those caused by the first. Care should be taken as some cracks may “extend” by any movement after the incident.
1.7.4 Transfer of glass
In 1967 Nelson and Revell2 reported the backward fragmentation of glass
and demonstrated it by photography. Backward fragmentation is the scatter toward the direction of the force and has since become known as backscatter. They broke 19 sheets of glass and observed backward fragmentation in all cases. They observed that “whenever a window is broken, it is to be expected that numerous fragments of glass will strike any person within a few feet of the window.”
The size of the fragments that are likely to be transferred from crime scenes depends on the type of glass that was broken and many other factors that are discussed later. However, there are two types of crime that have a reasonable chance of producing large fragments for comparison. These are hit-and-run incidents (incidents where a vehicle has collided with another vehicle, pedestrian, or other object) and ram raids (incidents where a vehicle has been used to effect entry). In hit-and-run cases, broken tempered glass produces relatively large pieces often scattered at (or about) the point of impact. These pieces usually include original surfaces; full thickness mea-surements are also possible.
Ram raids may result in large pieces of window glass being transferred to a vehicle.
However, in the bulk of cases of glass breakage, glass transfer to clothing involves small fragments with their size ranging from 0.1 to 2 mm and their shapes being typically irregular.
1.8 Physical examinations
One of the determining factors in the choice of analytical scheme employed in any given case is the size of recovered fragments. If the fragments are large, then many possibilities exist that are not realistic for the smaller frag-ments typically recovered from clothing. We will first present the physical examinations that can be performed on large fragments.
1.9 Examinations of large fragments
1.9.1 The comparison of thickness
Occasionally, fragments of glass are recovered that exhibit the full thickness of the source object. These can be compared by direct thickness ment. Once measured, it may be necessary to compare two sets of measure-ments. Unlike refractive index, no body of statistical work exists in this area, although similarities in the comparison problem suggest that a similar solu-tion is plausible.
thickness. Take for instance a toughened windscreen thought to have been the source of glass on a road at the point of impact with a pedestrian. The glass samples from the car are likely to be from the edges of the windscreen and those on the road from the center. Given the way in which windscreens are made and shaped, it is plausible that the edges are a different thickness, albeit slightly, to the center due to the bending in the production of the windscreen.
In this section we shall restrict ourselves to a subjective approach along the lines of “how close must two sets of thickness measurement be for them to be from the same source.”
Renshaw and Clarke18 give the standard deviation they encountered in
seven vehicle windscreens as ranging from 0.004 to 0.013 mm for the five float glass samples and 0.013 and 0.037 mm for the two nonfloat samples.
This difference between float and nonfloat samples seems to also exist in flat glass samples; however, the standard deviations for flat glass are lower. We are, however, unaware of published studies on this.
Survey work18,19 suggests that there is a very high level of discrimination
between glass samples, using thickness notwithstanding, and that most glasses are sold at nominal thickness such as 3, 3.5, 4 mm, and so on. This appears to be because there is only a loose agreement between nominal thickness and actual thickness.
1.9.2 The comparison of color
Large fragments of glass can be compared for color and ultraviolet (UV) fluorescence relatively straightforwardly by subjective comparison side by side. For color, samples may be viewed in a variety of lights, and it is often valuable to use daylight and tungsten light. The background should be neutral or a complementary color (for instance, the complement of blue is orange). It is thought that a background of the complementary color “primes” the eye to observe subtle color differences.
Difficulty is found in expressing the evidential weight of these subjective comparisons, although they do have value. This is because of the difficulty in storing subjective color information from samples to produce an estimate of frequency. Attempts to overcome this difficulty, using visible spectroscopy and a microspectrophotometer (MSP), suggest limited discrimination (New-ton, A.N. unpublished results, 1999).
1.9.3 Matching edges and matching hackle marks
With large, recovered glass samples, the fragments may first be examined to determine if coincidental edges exist between the recovered and control fragments in the form of a physical fit. This is most feasible for large pieces of glass and is seldom attempted on the typically smaller fragments trans-ferred to clothing, although rare successes are reported. The observation of these “fracture matches” indicates that both fragments once formed a larger piece of glass.
Similarly, the edges of a broken fragment will exhibit mechanical mark-ings, known as “hackle” marks (see Figure 1.6), which occur with such irregularity that a perfect match of an edge from a recovered fragment to an edge from a source fragment also indicates that both samples have come from the same source. The successful association by a hackle mark match is also a rare occurrence in casework and is typically not attempted on frag-ments recovered from clothing.
1.9.4 Density comparisons
One of the analyses that may be performed for comparison of glass samples is density. Depending on the information wanted by the forensic scientist, density can be performed in different ways: the density of the recovered and control fragment can either be compared directly or both densities can be determined. Density can be measured at a constant temperature or by vary-ing temperature.20 The gradient of density technique has also been suggested
in literature.21,22 As the latter technique has been shown to be more
discrim-inating, we will present it here. The method most commonly used places a glass fragment into a liquid of approximately the same density as the glass (~2.5 g/mL). The density of the liquid is varied by the addition of a miscible liquid which is more or less dense until the fragment is observed to “float” in the liquid, not moving up or down in the tube. At that point, the density of the liquid and the glass are equal, and the density of the liquid can then be measured. The densitometer can be calibrated with glasses of known densities. The use of bromoform (CHBr3) as the float liquid in conjunction
with a Mettler densitometer yields a precision of +/–0.0001 g/mL.23 An
alternative to the mix of bromoform and dibromoethane as a float liquid is an aqueous solution of a nontoxic polytungstate salt. The density of this salt solution can be easily adjusted by the addition of water, and the water may be evaporated to concentrate the salt, making it reusable.
Gamble et al.,24 Dabbs and Pearson,25 and Miller16 reported results for
refractive index measurements and density on a set of glass fragments and noted the strong correlation.
deter-mine as many physical properties as possible.” This suggests that, despite the obvious correlation, these authors felt that there was still value in deter-mining density if refractive index determination was also performed. Stoney and Thornton26 have shown that measuring both physical properties may
or may not be useful depending on the error of the techniques.
Improvements in equipment and method, however, have increased the advantage that refractive index determination has over density, and now very few laboratories perform both. The small added discrimination is adjudged not worth the extra cost of analysis.
Interestingly, the correlation between refractive index and density can be used to refine the density method,27 since the approximate density implied
by the refractive index can be used to prepare a particularly discriminating density gradient system.
Notwithstanding these advances, the refractive index has largely dis-placed density as the physical property of choice to be determined. For example, a recent survey conducted by the SWGMAT* group addressed the question of added discrimination by density analysis when the refractive index determination by the Glass Refractive Index Measurement (GRIM) was performed. One laboratory that had been collecting both refractive index and density data over many years could show only one example of further discrimination by density when refractive index was also measured. This correlation also holds true for refractive index and density ranges above the usual values for casework.
Figure 1.8 Density vs. refractive index for over 2000 case examples in the U.S.
collected between 1977 and 1990. (Data from FBI laboratory, FBI Academy, Quantico, VA, Robert Koons, personal communication, 1995, by a densitometer.)
* Scientific Working Group on Materials (SWGMAT) sponsored by the FBI laboratory, FBI Academy, Quantico, VA.
2.4 2.45 2.5 2.55 2.6 2.65
1.505 1.51 1.515 1.52 1.525 1.53 1.535
RI (Nd)
This finding supports the conclusion that the measurement of both refractive index and density may produce some additional discrimination, but this is limited by the observed correlation between these two properties.
1.10 Examinations performed on small and large fragments
1.10.1 Recovering glass
A number of methods for detection and collection of glass from clothing have been reported. These include hanging the garment over a large piece of paper and scraping the debris with a clean metal spatula onto the paper for collection; picking with tweezers; using adhesive tape on large surfaces (or on a surface where fibers are also gathered); in the case of the inside of a vehicle or a large room, vacuuming the area in question and examining the filter; and shaking the garment over paper or over a large (previously cleaned and blanked) metal cone. For garment examinations, each garment should preferably be packaged and inspected separately. The relative advan-tages of recovery methods can usefully be debated.
Pounds and Smalldon28 give a comparison of visual searching vs.
recov-ery by shaking. Table 1.1 gives a quick summary of these findings.
Interestingly, when visual searching was performed by two experienced and two inexperienced examiners, both sets performed similarly. The ranges in the visual searching column relate to the different performances of the different examiners and different garment types. These findings suggest that shaking is an efficient way of recovering glass, especially in the critical size ranges for typical casework, 0.1 to 0.5 and 0.5 to 1.0 mm. It is noted that the British view of shaking is a more violent activity than the impression given by the SWGMAT description of “scrape the debris with a clean metal spat-ula.” Nonetheless, they both constitute shaking-type methods of collection. A remaining point of debate is whether to shake over clean paper (and, if so, how) or a metal cone. The advantages of the cone are seen as a greater chance of recovery of fragments during violent shaking with the consequent risk of carry over and contamination. If the cone is to be used, strict anti-contamination procedures are typically required, including “blanking”* of the cone between suspects. The paper method requires that contamination does not come from the surface under the paper. This is typically achieved by cleaning this surface and, in some cases, placing a taped down clean sheet of paper on the work surface before placing the sampling sheet of paper.
Table 1.1 A Summary of the Findings of Pounds and Smalldon28
Size range Recovery by visual searching Recovery by shaking
0.1–0.5 mm 0–12% 72%
0.5–1.0 mm 13–67% 85%
1.0 mm or greater 44–100% 93%
Fuller29 reported recovery rates for various methods of hair combing and
found variable results. Plain combs and combs treated with cotton wool and Litex were evaluated. No clear trends were discernible regarding the most efficient type of comb.
1.10.2 Examination of transparent material to determine whether it
is glass
Many examiners begin their career picking up quartz and glass in equal measure from the debris produced by shaking garments. However, experi-ence tends to allow the examiner to pick up glass exclusively by choosing those fragments with freshly broken edges and “appearance,” sometimes referred to as the conchoidal fracturing.
If small particles of clear material are encountered, these can be exam-ined under crossed polarized light conditions to determine if they are iso-tropic. Anisotropic materials such as quartz or other mineral crystals are birefringent and rotate plane polarized light. Therefore, they appear bright under crossed polarizers in at least some orientations. Isotropic materials such as glass would remain dark in all orientations. Plastic particles can be distinguished from glass particles by applying pressure on the particle with a hard point and determining if the material compresses.
The characteristic appearance of quartz in oil can often be recognized when the refractive index measurement is attempted, and many examiners do not take the step of determining whether or not the material is glass before proceeding to refractive index determination. It is hoped that with experience examiners do not pick up much quartz and if they do the frag-ments can be detected at the refractive index measurement stage.
1.10.3 The examination of surface fragments
A surprisingly high fraction of casework glass samples recovered from cloth-ing exhibit an original surface, that is a surface that is part of the surface of the original object.30 This suggests that examination of these surfaces might
be a quick and effective way to examine glass fragments.
Elliot et al.31 point out that examination with a standard
stereomicro-scope with coaxial illumination allows the examination of specular reflection, reflections from the surface of the glass. “Examination of the specular reflec-tion image reveals surface details such as pits and scratches…. Curvature (or lack of it) is revealed by observing the reflected image of, for example, a probe tip as the probe is moved above the surface. For a flat surface, a sharp image can be obtained at every point; for a curved or irregular surface the image is distorted.”31
This method is simple and uses available equipment; however, interfer-ence microscopy appears to offer advantages. Elliot et al.31 describe the use
surface examination using a commercially produced two-microscope sys-tem. This methodology has not achieved widespread use despite its utility. The phenomenon of interference involves allowing monochromatic light, which has traversed a constant distance (the reference beam), to inter-act with light that has reflected from the surface of a glass fragment. If we imagine the fragment to be flat and very slightly angled, then there is some line on this fragment where the light is reinforcing with the reference beam. At some distance from this line the glass is either further away or closer to the source and does not reinforce. Further away still, the distance will again become an integral number of wavelengths and will again reinforce. The effect is a series of lines of dark and light. For flat objects these lines are straight whichever way the glass fragment is oriented. For curved objects the lines are curved in most orientations.
Locke and Elliot33 pursue a classification approach with much success.
Using their recommendations, glass is classified as flat, curved, or slightly curved or by suggesting sources such as inner surface of container or table-ware,a outer surface of container or tableware,b spectacle lens,c nonpatterned
surface of patterned glass,d patterned surface of patterned glass,eflat glass,f
or windscreen glass.g It can be seen that some of the characteristics described
would apply to two categories; however, blind trials suggest a very high success rate once experience has been obtained. Error rates are higher for small fragments. This suggests that classification should be applied to frag-ments 0.4 mm2, or to sets of three fragments. If sets of three fragments are
to be used, then they should all be <0.4 mm2 in size and they should be
similar in refractive index and interference pattern.
Experience suggests that the technique has discrimination beyond that suggested previously. The flat sides of different one-sided patterned win-dows are easily differentiated, for instance, due presumably to the different surface defects on the flat roller. Even flat glass shows differing amounts of surface markings from cleaning and may be discriminated in some cases.
Given the cheapness and effectiveness of this technique, it is surprising that more use is not made of it. It also seems likely that a high fraction of surface fragments is an indicator of backscattered glass. There is obvious, but unexplored, potential in this, using the Bayesian approach, to help dis-tinguish between some prosecution and defense hypotheses.
As previously suggested, float glass fluoresces when excited at 254 nm.31
This fluorescence gives the surface a dusty or milky appearance that may appear faintly yellow or green. This fluorescence is not necessarily visible
a Smooth curved lines due to the blown nature of the inner surface.
b Wavy curved lines due to the mold contact of the outer surface.
c Curved straight lines.
d Straight, but wavy lines resulting from flat surfaces affected by contact with the roller.
e Complex wavy lines.
f Smooth straight lines in all orientations.
in casework-sized fragments due to their small size and reflections from broken surfaces.
Lloyd34 reports on experiments examining the fluorescence spectrometry
of glass surfaces of casework-sized pieces. The main emission from a float surface is a very broad band with a maximum at about 490 nm when excited at 280 nm. Another excitation occurs at about 260 nm and produces a second broad emission largely superimposed on the first. A third excitation occurs at 340 nm, producing an emission peaking at 375 nm.
Nonfloat surfaces show only one strong fluorescence with an excitation at about 340 nm and an emission peaking at about 375 nm, similar to the third excitation of the float surface. The excitation at 280 nm is thought to result from tin. Considerable variation occurs between the fluorescence intensities for different samples of float glass. The largest variation lies in the tin fluorescence.
Locke35 describes equipment for viewing the float glass fluorescence on
casework-sized fragments. Inquiries suggest that this equipment is not com-mercially available. The float surface may also be detected by the use of X-ray analysis using the SEM to detect tin.
1.10.4 Refractive index determinations
The dominant physical property investigated in glass has been refractive index (RI) measurements. RI can provide a high degree of discrimination between a known and a questioned glass sample.
RI measurements are widely used for comparing forensic glass samples in crime laboratories. This optical property is easily measured in transparent materials such as glass and has been measured for more than 60 years with various methods. As such, it has largely superseded density as the physical property of choice to be measured.
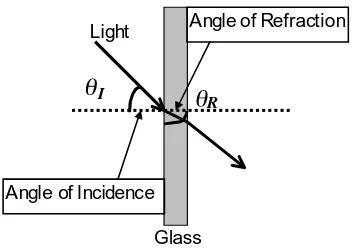
Figure 1.9 illustrates the change of direction (refraction) that is observed when light passes from one medium to another. Refraction occurs because (as described by Snell’s Law in Equation 1.1; also see Appendix A) the velocity of light in the transparent medium is slowed.
This interaction can be described as (1) the ratio of the wave’s velocity in a vacuum to the wave’s velocity in the transparent medium or (2) the ratio of the sine of the incident angle to the sine of the angle of refraction.
(1.1)
Becke* first described a phenomenon that he observed while analyzing geological samples in 1892. Using a microscope to examine rock sections, Becke observed a bright line inside the edge of a mineral section that had a
* Friedrich Johann Karl Becke, mineralogist, 1855–1931.
RI sin sin
= θ =
θ
I
R
Vacuum
Glass V
higher RI than its surroundings. Becke also saw that when the objective on the microscope was raised (focus up), the bright line moved in the direction of the mineral of higher RI. This Becke line, as it is known today, is a function of how light behaves at the boundary between two components with differ-ent RIs. To measure the RI of glass, one could immerse the glass in oil and adjust the focus on the edge of the glass fragment. If the objective was raised and the bright line moved into the oil (and away from the edge of the glass), then this would indicate that the oil had a higher RI than the glass. One could then take a miscible liquid such as an organic solvent and add it to the oil to lower the RI line until it does not move further or disappears. At that point, the RI of the oil is equal to the RI of the glass. One could then measure the RI of the oil with a refractometer. This method is very time consuming and not very accurate.
Around 1930, Emmons described the temperature variation technique, observing that RI varied with temperature. As the temperature of an oil is raised, the RI of the oil decreases while not affecting the RI of the immersed glass to the same extent. Emmons used a hot circulating water bath to heat the microscope slide and its contents and then waited for the Becke line to disappear. The water bath was also used to heat a sample of the same oil on a refractometer so that the RI could be measured once the line disappeared. This method was an improvement over the previous Becke method, but it was hard to control the temperature accurately. Therefore, the error was relatively high.
The double variation method16 involved the variation of both the
tem-perature and wavelength of the light coming through the sample to deter-mine the RIs for three wavelengths. This method has been published as an accepted method by the Association of Official Analytical Chemists.
[image:36.441.138.314.87.211.2]Mettler developed and sold a commercial Hot-Stage™ in the early 1970s that enabled very good control of the temperature of the locally heated microscope slide and was typically used in conjunction with a phase contract objective. This method was more accurate than previous methods, but still very time consuming. The phase contrast objective36 enhances any phase
Figure 1.9 Refraction of light through a glass medium.
Glass Angle of Incidence
Angle of Refraction Light
contrast caused by retardation or acceleration of the light as it passes through the glass relative to light that has passed only through oil. This is achieved by adding or subtracting a large phase difference (typically λ/4) to the small phase difference existing between those rays which have interacted with the sample and those which have traversed the surrounding border. This enhanced phase difference is seen as an optical effect similar to the Becke line, that is light and dark lines, but is strictly not the Becke method since that method uses a defocusing which is not required in phase contract microscopy. The act of defocusing and refocusing becomes progressively harder as the match temperature is approached and the fragment becomes less visible.
As noted by Ojena and De Forest,3“it becomes increasingly difficult to
see the Becke line as one gets closer to the match point of the immersion liquid and the glass fragment. The contrast of the diffraction pattern (Becke line) is influenced by the shape and dimensions of the specimen and by the degree of defocusing of the microscope. These factors, in turn, affect the accuracy of the match.”
In the mid 1980s, Foster and Freeman developed an instrument which they called “Glass Refractive Index Measurement” (GRIM) based on the observation of the glass immersed in oil (Figure 1.10).
A phase contrast microscope is used at the fixed wavelength of 589 nm, and the image is adjusted for maximum contrast. GRIM I and II both use dark contract phase microscopy. This is where the diffracted rays, those that have interacted with the sample, are deliberately retarded with respect to the 0-order (undiffracted) rays.
Figure 1.10 Glass fragments as viewed from the GRIM II video camera while being
Three studies have been conducted to evaluate the accuracy, precision, and long-term stability of the GRIM method and conclude that the instru-ment provides for very satisfactory results and should be the method of choice for the measurement of RI in forensic laboratories.
The GRIM manual suggests that fragments producing edge counts below ten should not be used or should be repeated manually. Tests by Zoro et al.37
and Coulson, Curran, and Gummer (personal communication) suggest that there is an increase in the variation of measurement on a single glass pane with a lower edge count, but the mean remains approximately the same. This suggests that low edge count fragments may still be used if the added variance is considered in the comparison and assessment procedure.
1.10.5 Dispersion
RI varies with wavelength, being greater for shorter wavelengths.16 The
standard wavelength for RI determination is the sodium D line. If no super-scripts or subsuper-scripts are used, then the RI referred to is the Sodium D line at 25°C. Therefore, N is shorthand for ND25. Other standard wavelengths used
are near the ends of the visible spectrum (typically the hydrogen C [656.3 nm] and F [486.1 nm] lines). The RI at these wavelengths are NC and NF, respectively.
There are two ways of expressing dispersion. First, it may be shown as a plot of RI vs. wavelength or, second, it can be defined as
(1.2)
Locke et al.38 suggest that “for glasses of the type commonly encountered
in casework in the United Kingdom (of Great Britain and Northern Ireland), dispersion measurements are unlikely to enhance the evidential value” due mostly to the large observed correlation between dispersion and ND. Locke et al.38 and Cassista et al.39 dispute the findings of Miller40and Koons et al.41
who suggested the opposite conclusion. However, in Miller data have not been given on the discrimination added, and in Koons et al. no phase contrast has been used, suggesting the possibility of low precision.
1.10.6 Refractive index anomalies
It has been known for some time that the float surface of float glass has a different RI to the bulk of the glass. Underhill42 describes the origin of the
multiple RI phenomena. The float surface is enriched in SnO2, and the
oppo-site surface appears to be depleted in various other constituents and, conse-quently, enriched in SiO2. The float surface typically has a lower RI to the
bulk. Underhill42 and Davies et al.43 raised the exciting prospect that a
sep-arate float RI might be measurable and, hence, an additional aspect of
dis-V N
N N
D
F C
= −
−
crimination might be available. Later research37 confirms the presence of RI
anomalies at the float surface, but suggests that this RI is approached smoothly over the last few microns of depth and, therefore, a discrete surface RI does not exist. They also show that the RI of the antifloat surface (the surface opposite the float surface) has an anomaly in the other direction (that is toward higher RI). This antifloat anomaly is smaller than the float anomaly in most, but not all, of Zoro et al.’s samples.37
Nonfloat flat glass may also on occasion exhibit surface anomalies. Two of Zoro et al.’s nonfloat samples showed anomalies, in both cases toward higher RI. One sample showed this at one surface and another at both surfaces.
Container glass and tableware may also show surface anomalies (in this case in either direction).
These findings do not absolutely exclude the use of “surface RI” as a discrimination tool, but do suggest that this use will be very difficult. It is, for instance, theoretically possible to consider “maximum” deviation as a discrimination tool. In order to do this it will be necessary to identify frag-ments expected to show maximal deviations, possibly by confirming that the measured edge is truly surface (and reasonably thin but measurable). The authors are aware of no laboratories applying this technique.
1.10.7 The examination of tempered (toughened) glass by annealing
Locke et al.44 describe an annealing process where a specifically designed
oven is used to anneal the small fragments typically recovered from clothing. Locke and Hayes45 report the results of this technique when applied to a
number of different glass sources.
Table 1.2 is a summary of Locke and Hayes findings; positive ∆RI values mean that the RI was higher after annealing.
Table 1.2 suggests that tempered specimens can be differentiated from nontempered specimens. Later work46 on 200 random survey items
sug-gested that an ∆RI value above 0.00120 identifies the glass as toughened, while values less than 0.00060 identify the glass as not toughened with an inconclusive region in between (please note that these values do not follow
from Locke and Hayes’ work which would suggest a value of ∆RI = 0.00150).
The studies performed by Cassista and Sandercock,39 Locke et al.,44,45,47,48
Winstanley and Rydeard,49 and Marcouiller50 confirm that toughened glass
can successfully be classified using annealing.
Table 1.2 A Summary of Locke and Hayes’45 Findings
Glass type ∆RI
Tempered specimens 0.00173–0.00206
Nontempered float, patterned, or plate glass 0.00086–0.00144
This approach is the traditional classification approach. A different approach is possible. The ∆RI value per se is an element of discrimination and can be used as that rather than as an element of classification. This point is a theme in glass where much effort has been expended in classi-fication type investigations where the discrimination type approach is as valid if not more so. In the case of annealing, two types of discrimination
information are available. The first described earlier is the ∆RI value, and
the second arises from the fact that the variance of RI in annealed glass is less than in unannealed glass. Hence, the comparison of two sets of appealed measurements is expected to give more discrimination (or a more peaked density, see later).
1.11 Elemental composition
Elemental analysis can either be used for classification or to discriminate glasses of the same type (windows, container, etc.) having similar physical characteristics. Indeed, RI differences correspond to small compositional differences in the major elements silicon (Si, ~30%), sodium (Na, ~8%), calcium (Ca, ~8%), magnesium (Mg, ~2%), and potassium (K, ~1.5%). It is possible, however, to have two different glass samples and be able to observe the same density and RI, and measure a difference in the minor element composition of aluminum (Al, ~1%) and iron (Fe, <0.3%), or by trace element content of barium (Ba), manganese (Mn), titanium (Ti), strontium (Sr), and zirconium (Zr). Ba, Mn, Ti, Sr, and Zr are all usually present in concentrations of less than 0.1%.
The techniques used for classification and discrimination may be differ-ent, as the determination of glass type depends on the major elements, whereas discrimination is mostly based on minor or trace elements. Numer-ous methods have been proposed for the elemental analysis of glass, such as SEM-EDX,51-53 X-ray fluorescence (XRF),54-57 neutron activation,58 or
induc-tively coupled plasma (ICP) techniques.41,59,60 Many different techniques for
the analysis and comparison of glass samples have been used because in many cases forensic laboratories must often use the available instrumenta-tion and adapt its use to as many types of evidence analyses as possible. A review of some of the methods used for the elemental analysis of forensic glass samples was reported by Buscaglia61 who discussed the advantages
and disadvantages of the individual analytical techniques.
Although each of these techniques has its strengths, each is limited in practical usage by one or more of the following: sample size requirements, whether or not the technique is destructive, sensitivity, precision, multi-element capability, or analysis time.
been further enhanced by computer-managed processes that also allow man-ufacturers to control the physical and optical properties of the glass such as thickness and RI to a great degree. In addition, the methods and formulation among manufacturers and plants around the world has become more uni-form. This has caused a noticeable decrease in the variation of RI for the population of flat glass produced by any one plant. While this trend appears to have been at least partially offset by the growing internationalization of the market, leading to more plants selling into any one market, there have been persistent concerns about a general loss of overall discrimination if the sole method used is RI. This has led to a critical review of other methods of analysis that could add discrimination.
A second school of thought considers elemental analysis as a tool to be used when required. Therefore, depending on the circumstances, there may be no need for elemental analysis or there may be a need for a technique that adds a little more discrimination or a very powerful technique. The scientist will not only consider the discriminating power of the technique when choosing if and how elemental analysis should be performed, but she/he will consider the circumstances of the case, the cost, the destructive nature of some techniques, and the availability of equipment. It is in this context that we would like to present the techniques used nowadays in forensic laboratories or in research: X-ray and ICP techniques.
1.11.1 X-ray methods
Two techniques have been proposed for the analysis of glass: SEM-EDX and XRF. Both are considered to be rapid, relatively sensitive, nondestructive, and complementary, as SEM is more sensitive to small atomic number ele-ments (major and minor eleele-ments in glass). These techniques have both been used for classification and discrimination.
1.11.1.1 Classification of glass using X-ray methods
Keeley and Christofides56 showed that magnesium and iron allowed the
differentiation of windows from other glass types. These results have been confirmed by other researches using SEM-EDX, such as Ryland.53 Ryland
used both SEM and XRF, as the latter is more sensitive to iron. In this research, it was found that old windows contained low levels of magnesium, but that the high iron content still allowed differentiation from container glass. Terry et al.52 used sodium, aluminum, silicon, calcium, and potassium
in addition to magnesium. The content of potash and lime allowed the differentiation of borosilicate labware from borosilicate headlamps; the con-tent of potash (in excess of 5%) differentiated spectacles and lead glasses. Flat glass was identified by its low aluminum content. Howden et al.54
For additional information on classification schemes showing differences between container and float glass, the reader is referred to studies conducted by Hickman.59,62,63
1.11.1.2 Discrimination of glass using X-ray methods
XRF techniques have also been reported t