OPEN ACCESS STATISTICS RESOURCES
I. Weir, Rh. Gwynllyw, K. Henderson
University of the West of England, Bristol (UNITED KINGDOM)
Abstract
In this paper we illustrate an open access statistics resource related to the statistical activities involved in choosing and carrying out an appropriate one sample test for location (mean or median) on a randomly generated data set. The development of the resource was funded through a sigma Resource Development Grant and is freely available from the UK national statstutor site. Five e-Assessment modules are available and these may be accessed independently or can be taken sequentially mimicking the flow of a full statistical analysis using the SPSS software package. On accessing the resource a new statistical data set may be generated or an existing data set used. Each module requires the data to have been downloaded to the SPSS statistical package, relevant analysis output obtained and a few questions answered to demonstrate understanding of the results. On submission, the e-Assessment system marks the responses immediately and provides full bespoke feedback for inappropriate test choices as well as other incorrect analysis. Videos and instruction pamphlets are accessible as links from each e-Assessment, which give clear instructions as to how to carry out the analyses and interpret results using SPSS. These additional resources, together with repeated use of the e-Assessment modules, facilitates learning how to identify and employ the correct test on a variety of data sets.
Keywords: e-Assessment, statistics, SPSS, multimedia, higher education.
1
INTRODUCTION
We report on an open access statistics resource created for the UK national statstutor site [1]. This site is the first port of call for students and lecturers looking for post-16 statistics support materials. These resources have been made available under a Creative Commons licence by the authors of this paper and reviewed by Dr Nadarajah Ramesh, University of Greenwich following a sigma Resource Development Grant [2].
The resource described here comprises a suite of e-Assessments together with supporting materials that relate to the statistical activities involved in choosing and carrying out an appropriate one sample test for location (mean or median) on a randomly generated data set. The choice of focusing on one sample location tests is a natural one as it contains activities that are required in the extension to more complex data scenarios. Five e-Assessment modules are available and these may be accessed independently or can be taken sequentially mimicking the flow of a full statistical analysis using the SPSS software package. The goal is to identify and perform the appropriate location test for a particular data set; t-test, Wilcoxon signed-rank test or Binomial (Sign) test. The e-Assessment modules are as follows:
• Exploratory Data Analysis;
• Shapiro-Wilk Normality test and Skewness & Kurtosis;
• One-sample t-test;
• Wilcoxon signed-rank test;
• Sign (Binomial) test.
The e-Assessments are run using DEWIS which is a fully algorithmic open-source e-Assessment system designed and developed at the University of the West of England, Bristol (UWE). It is a completely stand-alone web based system used for both summative and formative assessments. It uses embedded R code in order to create bespoke random data sets with desired statistical properties and to generate answers that match SPSS screen output. On accessing each e-Assessment module you are able to download a new statistical data set or, by using a unique customer reference number, return to a particular data set that you have previously used. Each module requires you to have downloaded this data, run an analysis on the SPSS statistical package, get output and answer a few questions demonstrating understanding of the results. Each data set is generated randomly and thus you can have multiple attempts at the same scenario with a variety of data sets that will cover the various experiences that you will encounter when analysing data; i.e. data that is appropriate for any one of the three tests and that may or may not have a significant effect.
The resource described in this paper is relevant to a wide range of disciplines, where it is necessary to master a methodical and defendable approach to carrying in depth and appropriate statistical analysis. A variety of application contexts are offered, for example from the fields of business, environmental science and engineering. Data sets are generated that vary in sample size, normality and in their degree of skewness.
Feedback is given for inappropriate test choices as well as other incorrect analysis and is an important feature because it has been found that students learn from e-Assessment feedback, using it to perfect their technical knowledge [8]. Videos and instruction pamphlets are accessible as links from each e-Assessment, which give clear instructions as to how to carry out the analyses and interpret results using SPSS. These videos and pdf instruction pamphlets are also available as stand-alone documents. Repeated use of the e-Assessment modules facilitates learning of how to identify and employ the correct test on a variety of data sets.
2
THE RESOURCE
The open access statistics resource is available from the statstutor site [9]. Before using the e-Assessments for the first time it is recommended that you download and read the accompanying notes [10] and watch an introductory video [11] which demonstrate the use of the learning modules. These describe the rule of thumb guidelines that enable choices of the appropriate location test based upon sample size, normality test results and skewness values. In particular it should be noted that the e-Assessment marks to the accuracy that SPSS outputs various summary statistics when the data is displayed in the Data View to the recorded accuracy.
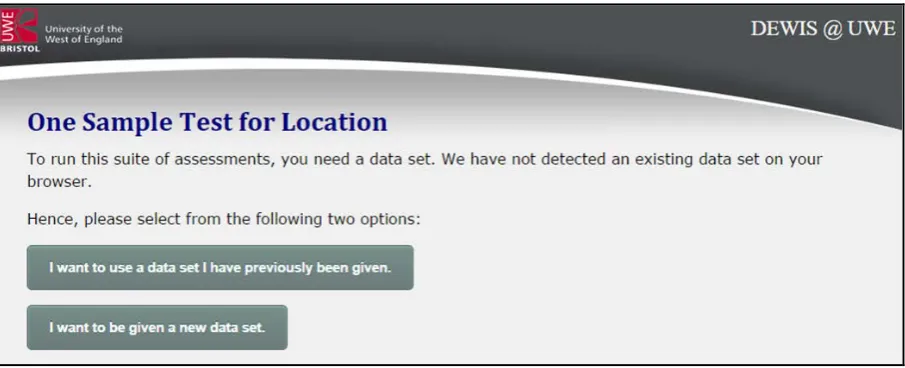
[image:2.595.73.526.557.741.2]On accessing the resource for the first time you are asked whether you want to be provided with a new data set or to use an existing data set; see Figure 1. On clicking on “I want to be given a new data set”, you are presented with a choice of contexts to choose from as illustrated in Figure 2.
Figure 2: An illustration of the choice of contexts for the data set.
At present ten different contexts are available but it is a simple process to edit an R source file to generate further alternatives. For this paper we have selected the “Forest Ozone level” context which would be of interest to environmental scientists for example. Alternatively, if you have used the resource previously and have a data set that you have already downloaded and wish to continue analysing, then by clicking on “I want to use a data set I have previously been given” you are prompted to enter the unique customer reference number that makes it possible to continue with this data set. A browser cookie is used to hold the most recent unique customer reference number used by the user. If this is detected by the system, an additional option is given, enabling the user to continue with this data set automatically.
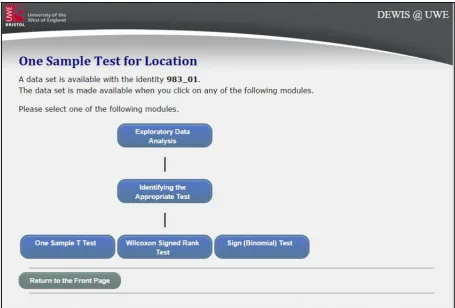
This unique reference number (983_01) is illustrated in Figure 3 as well as the five e-Assessment modules available from this resource. If mimicking an analysis, these modules would be taken in the order: Exploratory Data Analysis then Identifying the Appropriate Test before choosing the test to perform. However, it is permissible to do the modules in any order.
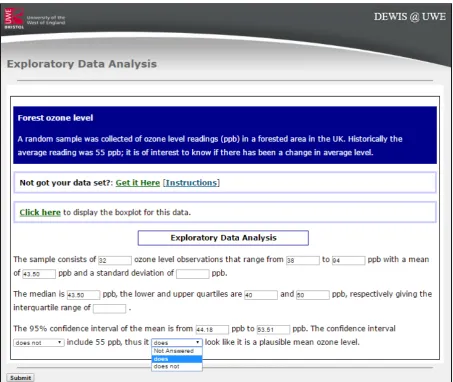
[image:3.595.70.526.443.751.2]In Figure 4 the Exploratory Data Analysis module is displayed. The question posed is stated along with links to download the data (together, if needed, with PDF instructions regarding reading the data into SPSS) and to view a boxplot of the data. The latter is useful for students to compare with their SPSS created boxplot which confirms data transference from the supplied Excel format to SPSS. The questions posed concern relevant elementary analysis that entails numerical extraction from the SPSS output as well as drop down menus for decisions based upon the output (e.g. the confidence interval does/does not include hypothesised mean). It can be seen that some questions have been answered (not all correct!) and some left blank.
Figure 4: The Exploratory Data Analysis module (partially answered for illustrative purposes).
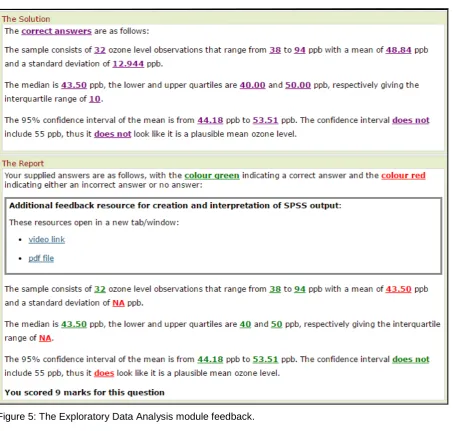
On pressing Submit the module score is reported. Whilst students have the choice of retaking the module or moving to another module, it is recommended that they select to see their feedback. The feedback comprises a reminder of the question posed together with the correct answers and a report which marks the students attempt with a colour coding of green for correct answers and red for incorrect or not answered questions; see Figure 5. Embedded links give access to additional feedback:
• A “how-to” video for creation of the required SPSS output’;
• A PDF file of interpretation of output required in the questions posed.
Figure 5: The Exploratory Data Analysis module feedback.
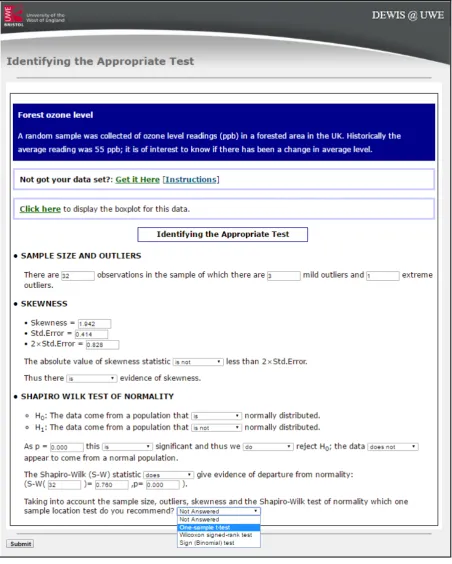
Figure 6 shows the second module; Identifying the Appropriate Test. This is where students will need to follow our supplied decision rules to correctly answer the final question where a subsequent test needs to be chosen. Here the student has correctly answered everything but is about to incorrectly choose the one-sample t-test. Note that as well as the need to carry out and interpret statistical activities, the student is expected to report test results in a formal manner.
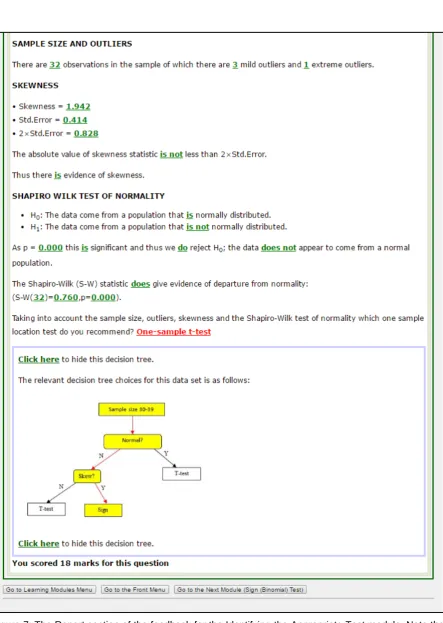
Figure 7 demonstrates the report part of the feedback for this module; the red colour coding informs the student that they have selected an incorrect test. The correct path through the appropriate decision tree is displayed to inform the student that the Sign test should have been chosen.
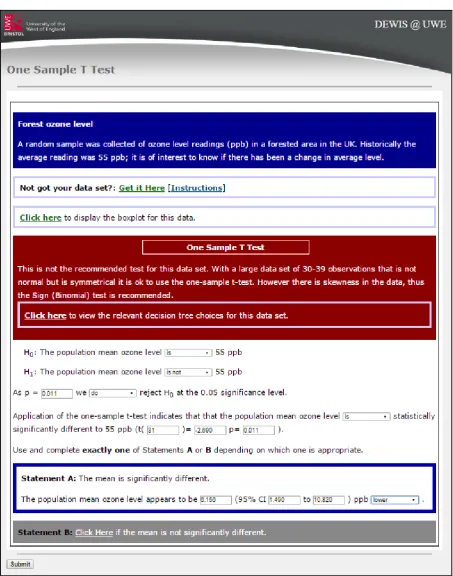
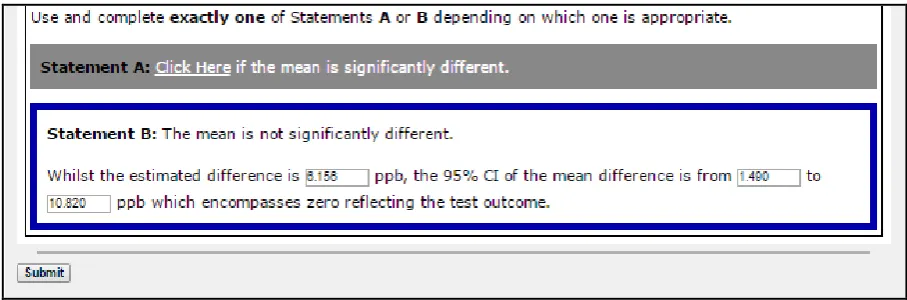
Figure 9: One-sample t-test module alternative final statement. In this case the student has entered correct numerical values but it is the incorrect statement choice as illustrated by the contradiction regarding the confidence interval to encompass zero.
3
DISCUSSION
Whilst there is a lot of good Mathematics material in the public domain there are less targeted resources available for the training of students to identify and perform appropriate statistical analyses. The resource described in this paper goes somewhere towards addressing this need. It is an open access online statistics resource which is freely available on the statstutor site. An overview of the resource is described in this paper and a fuller video demonstration is available [12]. In the first 9 months since its launch in July 2015, over 500 people have attempted the e-Assessment module(s) contained within it. The need to be able to choose, perform and interpret the results from appropriate statistical tests is ubiquitous in many STEM disciplines and beyond. Users are given a contextualised problem chosen from a wide range of disciplines and a bespoke data set is created for them to work with.
The sophisticated Assessments have been created by embedding R code within the DEWIS e-Assessment system. The R code has been written to emulate SPSS output and thus the statistical results for each bespoke data set can be generated efficiently and accurately using standard R routines. This pioneering approach was used for the first time in the 2013/14 academic year to efficiently assess statistics within a Level 2 research skills module delivered to Business School students and further statistical e-Assessments have since been developed [6,7]. A future aim is to facilitate others to create their own statistics e-Assessments using the DEWIS-R approach [13].
REFERENCES
[1] Statstutor: http://www.statstutor.ac.uk (accessed 20/05/2015).
[2] Sigma Resource Development Projects Funded (2015) http://www.sigma-network.ac.uk/resource-development-projects-funded/ (accessed 14/05/2016).
[3] Sangwin, C. (2013). Computer Aided Assessment of Mathematics. Oxford University Press.
[4] Baglin, J. and Da Costa, C. (2012). A theoretical framework for developing statistical package competence as an outcome of statistical literacy. Proceedings of the International Association of Statistics Education (IASE) 2012 Roundtable Conference: Technology in Statistics Education: Virtualities and Realities.
[5] DEWIS welcome page: http://dewis.uwe.ac.uk (accessed 14/05/2016).
[6] Gwynllyw, R., Weir, I. and Henderson, K. (2015). Using DEWIS and R for multi-staged statistics e-Assessments. Submitted to Teaching Mathematics and its Applications.
[8] Greenhow, M. and Gill, M. (2008). How effective is feedback in computer-aided assessments? Learning, Media and Technology 33(3), pp. 207-220.
[9] DEWIS resources on statstutor (2015) http://www.statstutor.ac.uk/search/?q=dewis (accessed 14/05/2016).
[10] Weir, I., Gwynllyw, R. and Henderson, K. (2015). DEWIS Learning Modules accompanying notes. http://dewisprod.uwe.ac.uk/projects/sigma/PDF/DEWIS_intro.pdf (accessed
18/05/2016).
[11] Weir, I., Gwynllyw, R. and Henderson, K. (2015). DEWIS Learning Modules introductory video. http://dewis.uwe.ac.uk/projects/sigma/DEWISdemo/DEWISdemo.htm (accessed 18/05/2016).
[12] Weir, I., Gwynllyw, R. and Henderson, K. (2016). Review of statstutor DEWIS Learning Modules