Drug
t
h
erapy
ABSTRACTObjective To determine the accuracy with which parents can estimate preschool children’s weight using home scales in order to calculate antipyretic dose. Design Cross-sectional, method comparison study. Setting and participants 156 preschool children aged 6 months to 6 years recruited from primary care and the community to an antipyretic strategies trial and managed at home.
Comparison and outcome measures Research nurse weight estimate using Seca 835-2 digital paediatric scales compared with parental weight estimate using usual home scales.
Results Parents of 62 (40%) preschool children had home scales. Research scale estimated weights were heavier than home scale weight estimates, with a mean difference of 0.41 kg (95% CI −0.24 to 0.74 kg), with 95% limits of agreement of −2.44 to 1.47 kg. Conclusion Weight can be estimated accurately enough to calculate antipyretic medicine doses by the minority of parents having scales that can be used to estimate their child’s weight.
INTRODUCTION
Medicine dose calculation can be based on a child’s age, weight or surface area. ‘Dosing by age’ is typically used by UK parents because the quantities are listed on the medicine packaging and the method is easy to use.1 Unlike some
European and US antipyretic products, UK prod-ucts do not contain dose by weight guidance for parents, although in common with all paediatric formularies, the British National Formulary for Children (BNFC) presents doses per kilogram.2
The UK National Service Framework for Children, young people and maternity services1 states
that children should receive age-, weight- and development-appropriate medicines. Moreover, in order to reduce medication error and improve dosing, it recommends that prescribing should be by weight, that is, in mg/kg. Prodigy has also issued guidance stating that antipyretics should be dosed by weight (paracetamol 15 mg/ kg up to four times daily and ibuprofen 10 mg/kg up to three times daily).3 13
Studies have shown that parents generally underdose children when administering anti-pyretic medicine. A US study investigating par-acetamol and ibuprofen dosing by parents found that 51% of patients received an inaccurate dose of medication, but that caregivers who stated that
medication dosage was based on weight were less likely to give an inaccurate dose.4
To our knowledge, although infant-related fac-tors infl uencing the actual weight measured are known, no previous studies have investigated if parents can use home scales to accurately weigh children to determine appropriate antipyretic medicine dose.
METHODS
This study aimed to investigate if parents could accurately estimate preschool children’s weight using ordinary home scales in order to calculate antipyretic doses.
The PITCH (Paracetamol plus Ibuprofen for the Treatment of Fever in Children) study, a ran-domised trial designed to establish the effective-ness of paracetamol, ibuprofen or a combination of both in treating fever in preschool children,5
used two methods for determining child’s weight: a research nurse measured weight using digital paediatric scales and, if a scale was available, a parent measured weight using home scales. We estimated the level of agreement between the two methods of measurement, as a means of assessing if parents could accurately weigh their children and hence dose by weight.
Children were recruited to the PITCH trial according to a protocol previously described.6
Briefl y, preschool children were included if aged between 6 months and 6 years and unwell with a temperature of at least 37.8°C and up to 41°C due to illnesses that could be managed at home.
Children were randomised to receive either: (1) paracetamolactive and ibuprofenactive; (2)
paraceta-molactive and ibuprofenplacebo; or (3) paracetamol pla-cebo and ibuprofenactive. The dose of medicine was
determined by the child’s weight.7
Once consent was obtained, the child was undressed to one layer, without nappy or shoes, and weighed on a Seca 835-2 baby and teen-ager scale (Seca, Hamburg, Germany). Weight was recorded to the nearest 100g. The Seca 835-2 weighing scales were regularly calibrated throughout the study period. If the parent had a home weighing scales, the details were noted on the case report form and the child’s weight was measured on the home scales by the parent. The weight measurements were then entered into the equations given in box 1 to produce a volume of antipyretic to be administered to the child. For 1Academic Unit of Primary
Health Care, NIHR National School for Primary Care Research, School of Social and Community Medicine, University of Bristol, Bristol, UK
2University of the West of England, Bristol, UK 3University Hospitals Bristol NHS Foundation Trust, Bristol, UK
4School of Clinical Sciences, Southmead Hospital, University of Bristol, Bristol, UK
Correspondence to Dr Céire Costelloe, Academic Unit of Primary Health Care, NIHR National School for Primary Care Research, School of Social and Community Medicine, University of Bristol, Canynge Hall, 39 Whatley Road, Bristol BS8 2PS, UK; ceire.costelloe@bristol.ac.uk Accepted 4 July 2011
Medicine dosing by weight in the home: can parents
accurately weigh preschool children? A method
comparison study
Céire Costelloe,
1Alan A Montgomery,
1Niamh M Redmond,
1Margaret Fletcher,
2,3Review
Costelloe C, Montgomery AA, Redmond NM, et al. Arch Dis Child (2011). doi:10.1136/archdischild-2011-300600 2 of 4
Drug
t
h
erapy
the purposes of the study dosing, the Seca measurement was used to determine actual doses given.
For example, a child weighing 10 kg would receive a dose of 6.25 ml paracetamol up to four times daily, and a dose of 5 ml of ibuprofen up to three times daily.
All data were analysed using Stata 11.8 First, two
graphi-cal methods were used to examine agreement. Dose was graphi- cal-culated using both weight measurements. Graphs were also produced representing the maximum daily doses that could be administered according to age, compared with the maximum daily dose that could be administered according to weight in 2, 50 and 98 percentiles of childhood weight.2
Home scale weight was plotted against paediatric scale weight, then the difference between the measurements for each subject was plotted against the mean.9 The Pitman’s
per-mutation test was used to test the difference in variance for paired data.10 11 The difference between home scale weight
measurement and paediatric nurse weight measurement was calculated for each child and a mean difference and SD of the differences recorded. 95% limits of agreement were cal-culated for the mean. Weight observations that were outside the limits of agreement were investigated for their potential effect on overdosing a child. The study was approved by the Bath Research Ethics Committee, UK (reference number 04/Q2001/197).
RESULTS
The parents of 62 (40%) children had scales present in the home and most (56%) scales were analogue. There were no differences between preschool children whose parents had
scales at home and those who did not in terms of age, gender, comorbidities, weight or fever severity (table 1). Parents who did not have a home scales had a higher deprivation score than parents who had a home scales (p<0.05).
The mean difference in (nurse minus parent measured) weight was +0.48 kg (95% CI +0.24 to +0.73 kg). The 95% limits of agreement defi ning the range within which most of the differences fell was 1.47 to −2.44 kg (table 2).9 The Bland–
Altman plots shows that the difference between nurse and parent measured weight remained relatively constant with varying child weights (fi gure 1). Intermeasurement agreement analysis showed that there was no evidence of any difference between the two measurements (p=0.39).
[image:2.595.48.290.67.186.2]According to BNFC guidelines and using the doses calcu-lated, a child would be given too much medicine if their weight was over-estimated by 2 kg. The Bland–Altman plot indicates that this was the case for one child, whose parent measured weight was greater than the nurse measured weight by 4 kg.
Figure 2 compares the different total medicine doses for paracetamol and ibuprofen if calculated by weight (given two extreme and one central weight percentile) and age. The stepped dose that age calculations produce and the differences in total daily doses that are produced between weight and age calculations are shown.
There was strong evidence that the dosing according to weight resulted in a higher dose of ibuprofen than if the child had received a daily dose calculated using their age, with a mean difference of +127.1 mg (95% CI +100.0 to +154.2 mg, p<0.001). Using parent measured weight to calculate a daily paracetamol dose resulted in children receiving a lower dose than if age was used, with a mean difference of −74.3 mg (95% CI −89.5 to −29.0 mg, p<0.001).
DISCUSSION
The results show that there is good agreement between the two methods of weight measurement. Within the dose by age regimen, there are some large dose differences across certain age categories. The difference in the dose of paracetamol is also large for heavier 3 and 4 year olds, who would be under-dosed using the ‘by age’ regimen. As the prevalence of over-weight and obesity increases in children,12 these dosing by age
measurements will become less accurate as the mean weight of children at different age ranges increases.
[image:2.595.40.291.591.745.2]We are aware of the following potential limitations. First, we were unable to carry out method comparison for 60% of the study participants as they did not have scales at home, although these children did not differ from those who did in terms of, for instance, age and gender, from those included here (table 1). Second, the parents and nurses were not blind to one another’s estimates. Third, we used two methods to measure the child’s weight and there may be added variation due to differences in operator. Fourth, the parents agreeing to participate in a trial may not be representative of all parents of preschool children. Finally, in a thorough investigation of the agreement between two methods, it would be advisable
Table 1 Characteristics of participants with and without a parent measured weight Parent measured weight available, n (%)* Parent measured weight unavailable, n (%)*
Age, years 2.24 (0.17) 2.23 (0.14)
Male 36 (58) 52 (55)
Weight, kg 12.85 (0.45) 13.14 (0.41)
Antibiotic use 23 (38) 23 (24)
Asthma 6 (10) 13 (14)
Temperature, °C 38.55 (0.08) 38.59 (0.06)
Discomfort score
≤3 38 (61) 63 (67)
>3 24 (39) 31 (33)
Deprivation score 1.33 (0.33) 2.33 (0.33)
*Or mean (standard error) for continuous variables.
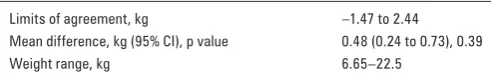
Table 2 Weight agreement for nurse measured compared with parent measured weight
Limits of agreement, kg −1.47 to 2.44
Mean difference, kg (95% CI), p value 0.48 (0.24 to 0.73), 0.39
Weight range, kg 6.65–22.5
Box 1 Dosing calculation
Paracetamol
▶
120 mg/5 ml dose
▶
Administered up to four times daily at 15 mg/kg
▶
Dose in ml =15×5×(child’s weight in kg)/120
▶
Ibuprofen
▶
100 mg/5 ml dose
▶
Administered up to four times daily at 10 mg/kg
▶
Dose in ml =10×5×(child’s weight in kg)/100
[image:2.595.308.554.717.755.2]Drug
t
h
[image:3.595.117.475.55.300.2]erapy
Figure 1 Plot of the difference between research nurse and parent measured weight estimates against the average weight (kg). Circle size indicates more than one observation at this point. 95% limits of agreement and means are marked.
[image:3.595.116.475.361.726.2]Review
Costelloe C, Montgomery AA, Redmond NM, et al. Arch Dis Child (2011). doi:10.1136/archdischild-2011-300600 4 of 4
Drug
t
h
erapy
to take replicated measurements. This would enable us to consider intermethod reliability in the context of the repeat-ability of each measure individually.7 9
The results presented here show a minority of parents had home scales. It seems feasible that these parents could be asked to measure their child’s weight, and calculate a dose based on this measurement, as is the case in other countries. Furthermore, it is important for clinicians/nurses/pharma-cists to provide accurate advice to parents whose children do not seem to be responding to these antipyretic medications. In these cases, it is important to check the doses given, and where necessary suggest dose adjustment by using the more accurate dose for weight method if available. Countries where medicine manufacturers do not currently include dose by weight tables and dose by weight oral syringes with their products may wish to consider doing so.
Contributors ADH conceived the idea for the method comparison study. The research nurse team collected the data under the supervision of NMR, CC and SH. CC, AAM and TJP cleaned and analysed the data. CC drafted the paper with subsequent contributions from all the authors. AAH is the guarantor.
The authors are extremely grateful to the Avon, Gloucestershire and Wiltshire NHS Direct, the Bristol GP practices, the South Bristol Walk-in Centre, the Bristol Royal Hospital for Children’s Emergency Department and the children and parents whose participation made this study possible. They are indebted to the South West Medicines for Children Local Research Network (MCRN); the research nurse team W Horseman, J Farrimond, R Powell, S Shatford, P Richards and MCRN nurse V Payne; W Patterson (trial coordinator); S Doohan and S Burke (project administrators); K Schroeder, M Weiss and A Emond (co-applicants); and K Pitcher (data entry/quality). They thank the Trial Steering Committee (A L Kinmonth, C Butler, J Peacock, M Blythe and P Denyer) and the Data Monitoring and Safety Committee (R Bragonier, S Kerry and J Chudleigh) for their time and expertise. Funding The PITCH study was funded by the National Institute for Health Research (NIHR) Health Technology Assessment (HTA) programme (project number 03/09/01). The fi nal study design, data collection and analysis, interpretation of results and paper writing was the sole responsibility of the authors. For the duration of the trial, AH held a postdoctoral award from the National Coordinating Centre for Research Capacity Development (NCCRCD),
Department of Health. The views and opinions expressed in this paper do not necessarily refl ect those of the NIHR HTA, NCCRCD or Department of Health. Competing interests None.
Ethics approval The study was approved by the Bath Research Ethics Committee, UK (reference number 04/Q2001/197).
Provenance and peer review Commissioned by the NIHR HTA; externally peer reviewed.
REFERENCES
1. Department of Health. National Service Framework for Children, Young People
and Maternity Services. London: Her Majesty’s Stationery Offi ce, 2004.
2. British Medical Association and Royal Pharmaceutical Society of Great
Britain. British National Formulary (59) – 44th Edition. London: British Medical Association and Royal Pharmaceutical Society of Great Britain, 2010.
3. Prodigy. Paracetamol and Ibuprofen in the Treatment of Fever and Acute Pain in
Children Under 16 Years. Prodigy Quick Reference Guide, 2006. http://www.cks. library.nhs.uk/clinical_knowledge (accessed Mar 2011).
4. LiSF, Lacher B, Crain EF. Acetaminophen and ibuprofen dosing by parents.
Pediatr Emerg Care 2000;16:394–7.
5. HayAD, Costelloe C, Redmond NM, et al. Paracetamol plus ibuprofen for
the treatment of fever in children (PITCH): randomised controlled trial. BMJ
2008;337:a1302.
6. HayAD, Redmond NM, Costelloe C, et al. Paracetamol and ibuprofen for the
treatment of fever in children: the PITCH randomised controlled trial. Health
Technol Assess 2009;13:iii–iv, ix–x, 1–163.
7. SarrellM, Cohen HA, Kahan E. Physicians’, nurses’, and parents’ attitudes to and knowledge about fever in early childhood. Patient Educ Couns
2002;46:61–5.
8. STATA. Statistical Software: Release 11.0. College Station, TX: STATA,2009.
9. BlandJM, Altman DG. Statistical methods for assessing agreement between
two methods of clinical measurement. Lancet 1986;1:307–10.
10. Pitman EJG. Signifi cance tests which may be applied to samples from any
population. R Stat Soc Suppl 1937;4:225–32.
11. Welch WJ. Contruction of permutation tests. J Am Stat Assoc
1990;85:693–8.
12. NHS Information Centre for Health and Social Care. National Child Measurement
Programme Guidance for Analysis by Public Health Observatories and Primary Care Trusts. NHS Information Centre for Health and Social Care, 2010.
13. HyamE, Brawer M, Herman J, et al. What’s in a teaspoon? Underdosing with
doi: 10.1136/archdischild-2011-300600
published online August 10, 2011
Arch Dis Child
Céire Costelloe, Alan A Montgomery, Niamh M Redmond, et al.
children? A method comparison study
parents accurately weigh preschool
Medicine dosing by weight in the home: can
http://adc.bmj.com/content/early/2011/08/10/archdischild-2011-300600.full.html
Updated information and services can be found at:
These include:
References
http://adc.bmj.com/content/early/2011/08/10/archdischild-2011-300600.full.html#ref-list-1
This article cites 6 articles, 1 of which can be accessed free at:
P<P
Published online August 10, 2011 in advance of the print journal.
service
Email alerting
the box at the top right corner of the online article.
Receive free email alerts when new articles cite this article. Sign up in
Notes
(DOIs) and date of initial publication.
publication. Citations to Advance online articles must include the digital object identifier
citable and establish publication priority; they are indexed by PubMed from initial
typeset, but have not not yet appeared in the paper journal. Advance online articles are
Advance online articles have been peer reviewed, accepted for publication, edited and
http://group.bmj.com/group/rights-licensing/permissions
To request permissions go to:
http://journals.bmj.com/cgi/reprintform