Newborn calves are subjected to various nutri-tional conditions. The early intake of solid feed, which is related to the development of microbial fermentation in the rumen, might positively influ-ence the functional development of the rumen in calves (Roy, 1980; Zitnan et al., 1993a,b; Kohler et al., 1997). However, there is debate on the ra-tio of forage to concentrate and on the physical form of concentrates (Di Giancamillo et al., 2003). Forage consumption stimulates rumination, saliva
production and muscular development of the ru-men (Hodson, 1971; Hamada et al., 1976). On the other hand, forage fermentation does not provide sufficient concentrations of short chain fatty acids (SCFA). SCFA are chemical stimuli for the develop-ment of rumen epithelium, promoting its structural development and absorption activity (Kauffold et al., 1977; Jesse et al., 1995; Zitnan et al., 1998; Lesmeister and Heinrichs, 2004).
Diet induced ruminal papillae development in neonatal
calves not correlating with rumen butyrate
R. ZITNAN
1,2, S. KUHLA
2, P. SANFTLEBEN
3, A. BILSKA
4, F. SCHNEIDER
2,
M. ZUPCANOVA
1, J. VOIGT
21Research Institute of Animal Production, Nitra, Slovak Republic
2Research Institute for the Biology of Farm Animals (FBN), Dummerstorf, Germany
3State Research Institute for Agriculture and Fishery, Mecklenburg-Vorpommern,
Institute of Animal Production, Dummerstorf, Germany
4Faculty of Biotechnology and Animal Breeding,University of Szczecin, Szczecin, Poland
ABSTRACT: The objective of this study was to investigate the development of rumen mucosa and the level of plasma IGF-1 in calves induced by different amounts and types of milk replacers and solid diet. Forty-five male Holstein calves 7 days of age were assigned to three groups: group I milk free replacer, late weaned; group II milk free replacer, early weaned, and group III milk replacer, early weaned. All animals received additional concentrate, water and maize silage were offered ad libitum. In each group, three calves were slaughtered at 41 days of age. The concentration of ruminal total SCFA and the molar proportion of butyrate did not differ between the groups, but the molar proportion of acetate was lower (P= 0.01) and the proportion of propionate was higher (P = 0.02) in early weaned calves. Compared to the late weaned calves (group I) the length, width and surface of the papil-lae of atrium ruminis, the length and width of the papillae of ventral ruminal sac and the length of the papillae of ventral blind sac were greater (P < 0.05) in the early weaned calves fed low amounts of milk and high amounts of concentrate (group III). Furthermore, there was a tendency of plasma IGF-1 concentration to be increased (P = 0.1) in early weaned calves. The plasma levels of glucose and insulin were decreased (P < 0.01, and P = 0.03, respectively). Positive correlations existed between papillae length and plasma IGF-1 concentrations (P < 0.10). Insulin and glucose concentrations were negatively correlated with parameters of papillae development (P < 0.1). In conclusion, the development of rumen papillae was stimulated in calves consuming increased amounts of concentrate. The effect was not correlated with the molar proportion of butyrate, but with the molar propionate proportion in the rumen and with the plasma IGF-1 concentration.
In a previous study we demonstrated a positive correlation between early weaning and progress of the morphological development of the rumen epithelium, as characterized by the number of pa-pillae as well as their length and width (Zitnan et al., 1999). A recent report indicates similar ontogenic and physiological effects on sodium and chloride transport in the developing calf rumen epithelium (Breves et al., 2002). Increased sodium and chloride transport by the developing rumen epithelium could reflect an increase in the SCFA absorptive capacity by the rumen epithelium (Sehested et al., 1999).
Shen et al. (2004) observed higher IGF-1 con-centration in plasma, increased papillae size and surface of rumen epithelium, and an enhanced net flux of Na+ across the isolated rumen epithelium
in kids fed high energy levels. Thus dietary en-ergy-dependent alterations of rumen morphology and function are accompanied by corresponding changes in systemic IGF-1.
The aim of this investigation was to examine the effects of different amounts and types of milk re-placers (milk free vs. milk containing ones) and
solid diet on the development of rumen mucosa and level of plasma IGF-1 in calves during the first 7 weeks of age.
MATERIAL AND METHODS
Animals and nutrition
[image:2.595.63.534.431.671.2]Forty-five male German Holstein calves (mean body weight 49.9 ± 0.3 kg) were used. The calves were 7 days old and were randomly assigned to one of the three treatment groups. Calves were housed outdoors in group hutches with straw bedding. Water and maize silage were offered ad libitum. The animals of group I (late weaned) were offered a maximum of 8 l of commercial milk free replacer (100 g/l) per day until seven weeks of age and a concentrate mixture (50% pellets + 50% flakes) ad libitum. Both in group II (early weaned) and group III (early weaned) calves were given a milk replacer until six weeks of age, which was milk free in group II. Groups II and III received flakes
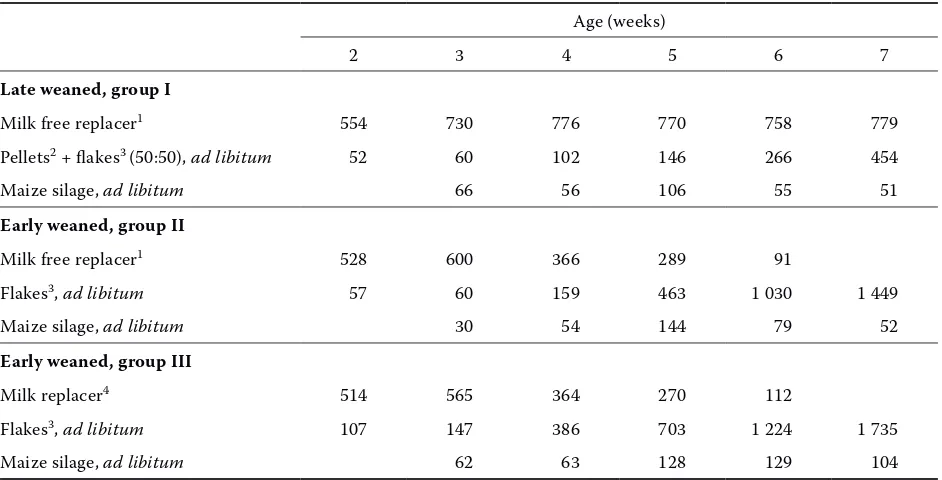
Table 1. Feed intake by the calves (in g air dry matter per animal and day;maize silage in g fresh matter per animal and day)
Age (weeks)
2 3 4 5 6 7
Late weaned, group I
Milk free replacer1 554 730 776 770 758 779
Pellets2 + flakes3 (50:50), ad libitum 52 60 102 146 266 454
Maize silage, ad libitum 66 56 106 55 51
Early weaned, group II
Milk free replacer1 528 600 366 289 91
Flakes3, ad libitum 57 60 159 463 1 030 1 449
Maize silage, ad libitum 30 54 144 79 52
Early weaned, group III
Milk replacer4 514 565 364 270 112
Flakes3, ad libitum 107 147 386 703 1 224 1 735
Maize silage, ad libitum 62 63 128 129 104
1components: dried sweet whey, dried sweet whey (partial removal of lactose), oil (vegetable origin), wheat protein; in
group I 100 g/l, in group II 120 g/l
2components: wheat, soybean meal (extracted), dried molassed sugar beet pulp, barley, soybean oil, minerals
3components: soybean meal (extracted), linseed expeller, cornflakes, wheat flakes, maize gluten, dried whey (protein-rich), wheat bran, soy lecithin, sugar beet molasses, vitamin and mineral mixture
ad libitum (Table 1). The chemical composition and metabolizable energy of feed are shown in Table 2.
Sampling and chemical analysis
In each group, 3 calves were slaughtered at 41 days of age. Rumen fluid was taken from the perforated rumen immediately after slaughtering. The rumen fluid was strained through 4 layers of gauze and prepared for SCFA analysis.
Samples of the rumen wall (1 cm2 surface) were
obtained from identical sites of the atriumruminis, ventral rumen sac and ventral blind sac and fixed in a 4% neutral formaldehyde solution.
Blood samples were obtained from the non-sacrificed calves on day 42 of life. Blood was col-lected into 9-ml heparinized tubes (S-Monovette®,
SARSTEDT, Numbrecht, Germany) (Li-heparin 10–30 I.U./ml blood). The samples were immedi-ately put on melting ice and centrifuged at 3 000 × g at 4°C for 10 min to separate the plasma. Plasma samples were stored at –80°C until analysed for IGF-1, insulin, and glucose.
For SCFA analysis, a mixture of 5 ml rumen fluid and 2 ml iso-capronic acid (internal standard) was centrifuged at 3 000 × g at 4°C for 20 minutes. The supernatant was then filtered (0.22 µm pore size) to measure the SCFA concentration by gas chromatography (Shimadzu GC-14A, Shimadzu Corporation, Kyoto, Japan) on a capillary column (Free Fatty Acid Phase, 25 m × 0.25 mm, Machery-Nagel GmbH & Co. KG, Duren, Germany) (Geissler et al., 1976). The pH of rumen fluid was measured directly after sampling and prior to preparation for
SCFA analysis with a glass electrode (N 1042A, pH meter CG 841, Schott, Mainz, Germany), and ammonia concentration was determined by the microdiffusion method (Voigt and Steger, 1967).
Plasma glucose concentrations were measured by the glucose oxidase method using a commercial kit (No. 115, Sigma Diagnostics, St. Louis, MO).
The determination of insulin was performed by the porcine insulin 125RIA kit (PI-12K, Linco
Research, Inc., St. Charles, MO, USA) which used purified human insulin as standard, first antibody raised in guinea pigs, and goat-anti-guinea pig IgG for the bound/free separation. A standard curve was prepared at concentrations from 2 to 200 µU. Cross-reactivity with bovine insulin was 90%. All samples were analysed in duplicates. The sensitiv-ity of the insulin RIA was calculated at 2 µU/ml after measurements with a multi-crystal gamma-counter by a RIA program (LB 2104, Berthold, Bad Wildbad, Germany). Intra- and inter-assay coef-ficients of variation (precision and reproducibility) were 4.3 and 8.2%, respectively.
Plasma IGF-I was measured by a commercial 125
I-RIA kit (Nichols Institute Diagnostics, San Juan Capistrano, USA). IGF-I was separated from bind-ing proteins through acid-ethanol (12.5% 2N HCl – 87.5% ethanol) precipitation. Each sample was analysed in duplicates (2 × 100 µl). All steps of RIA were performed according to the directional insert. Test on samples with two different IGF-I contents (undiluted and diluted, respectively) in-dicated parallelism. The coefficients of intra-assay and inter-assay variation were 4.4% and 9.9%.
[image:3.595.69.533.102.257.2]Dietary dry matter (DM), crude protein (CP), crude fibre (CF) and ash were determined according
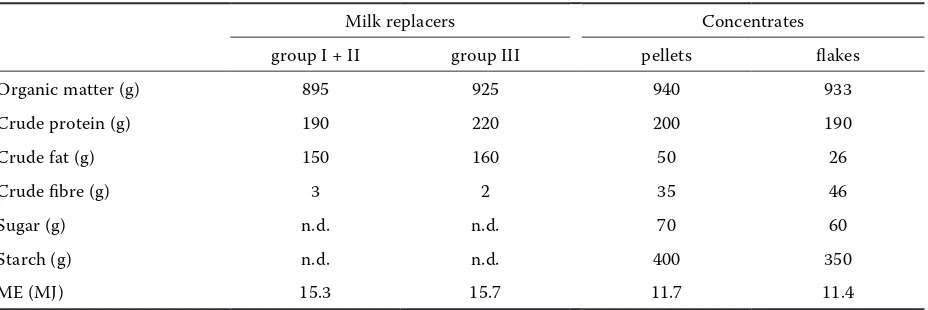
Table 2. Chemical composition and metabolizable energy of diet components (per kg air dry matter)
Milk replacers Concentrates
group I + II group III pellets flakes
Organic matter (g) 895 925 940 933
Crude protein (g) 190 220 200 190
Crude fat (g) 150 160 50 26
Crude fibre (g) 3 2 35 46
Sugar (g) n.d. n.d. 70 60
Starch (g) n.d. n.d. 400 350
ME (MJ) 15.3 15.7 11.7 11.4
to the Weender standard procedure (Naumann and Bassler, 1993). The energy content was calculated by the prediction equation of metabolizable energy in mixed feeds (Kuhla and Weißbach, 1996).
Light microscopy and morphometry
After rinsing with water, the rumen wall tis-sues were dehydrated in a graded series of etha-nol (30%, 50%, 70%, 90% and absolute ethaetha-nol), cleared with benzene, saturated with and em-bedded in paraffin. At each sampling sections of 5 µm thickness were made of 20 papillae and stained with haematoxylin/eosin. The length and width of papillae were determined by the com-puter-operated Image C analysis system (Intronic GmbH, Berlin, Germany) and the IMES analysis program, using a colour video camera (SONY 3 CCD) and a light microscope (Axiolab, Carl Zeiss Jena, Germany). The number of papillae per cm2
of mucosa was estimated with video camera by an image analysis system. The total surface of papil-lae per cm2 of mucosa was determined as length
× width × 2, multiplied by the number of papil-lae/cm2 (Hofmann and Schnorr, 1982).
Statistical analysis
The results were statistically analysed by STA- TISTICA-Software of StatSoft Inc. (version 6.0). A one-way analysis of variance ANOVA was used to determine the significance between the feeding
groups. A significance level of P < 0.05 was set. The results are presented as means ± SD.
RESULTS
Intake and body weight gain
During the experimental period of 7 weeks the calves of late weaned group I and early weaned group II and group III daily consumed 675, 362, and 364 g of milk replacer per animal, respec-tively. The consumption of concentrate in late weaned group I was 294 g per animal and day. In early weaned group II and group III, the intake amounted to 715 g and 887 g per animal and day, respectively. The intake of maize silage in group I, II and III was 68, 78, and 109 g per animal and day, respectively. In group I, II, and III, the intake of total energy amounted to 13.4, 11.7 and 13.6 MJ ME per animal and day. The intake of crude protein amounted to 182, 181, and 219 g per ani-mal and day for group I, II, and III, respectively. The body weight of the calves before slaughtering averaged 63.3 kg (group I), 60.7 kg (group II) and 61 kg (group III). Calves fed in group II had a lower average daily gain (310 g) than calves in group I (502 g) and in group III (521 g) (P < 0.1).
Rumen fermentation
[image:4.595.63.535.570.723.2]No significant differences in the pH, total SCFA concentration and molar proportion of butyrate
Table 3. Effects of diet on ruminal parameters in calves at the time of slaughter at the age of 41 days (mean ± SD,
n = 3)
Group1
P-values
I II III
pH 5.30 ± 0.31 5.13 ± 0.08 5.34 ± 0.18 0.469
SCFA (mmol/l) 133.7 ± 43.2 175.2 ± 40.1 156.1 ± 13.5 0.403
C2 (mol%) 59.2 ± 9.1a 42.0 ± 0.3b 43.1 ± 2.1b 0.013
C3 (mol%) 27.9 ± 6.1a 41.6 ± 5.0b 43.9 ± 4.5b 0.020
C4 (mol%) 8.8 ± 2.4 9.6 ± 3.4 8.2 ± 3.9 0.864
C2 : C3 2.24 ± 0.85a 1.02 ± 0.11b 0.99 ± 0.10b 0.035
NH3(mmol/l) 13.9 ± 1.17a 3.9 ± 1.35b 10.4 ± 2.90a 0.002
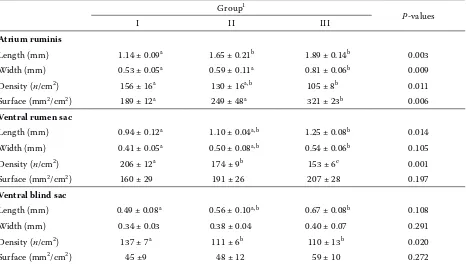
Table 4. Effects of diet on the number and surface of rumen papillae in calves at the time of slaughter at the age of 41 days (mean ± SD, n = 3)
Group1
P-values
I II III
Atrium ruminis
Length (mm) 1.14 ± 0.09a 1.65 ± 0.21b 1.89 ± 0.14b 0.003
Width (mm) 0.53 ± 0.05a 0.59 ± 0.11a 0.81 ± 0.06b 0.009
Density (n/cm2) 156 ± 16a 130 ± 16a,b 105 ± 8b 0.011
Surface (mm2/cm2) 189 ± 12a 249 ± 48a 321 ± 23b 0.006
Ventral rumen sac
Length (mm) 0.94 ± 0.12a 1.10 ± 0.04a,b 1.25 ± 0.08b 0.014
Width (mm) 0.41 ± 0.05a 0.50 ± 0.08a,b 0.54 ± 0.06b 0.105
Density (n/cm2) 206 ± 12a 174 ± 9b 153 ± 6c 0.001
Surface (mm2/cm2) 160 ± 29 191 ± 26 207 ± 28 0.197
Ventral blind sac
Length (mm) 0.49 ± 0.08a 0.56 ± 0.10a,b 0.67 ± 0.08b 0.108
Width (mm) 0.34 ± 0.03 0.38 ± 0.04 0.40 ± 0.07 0.291
Density (n/cm2) 137 ± 7a 111 ± 6b 110 ± 13b 0.020
Surface (mm2/cm2) 45 ±9 48 ± 12 59 ± 10 0.272
1group I milk free replacer, late weaned; group II milk free replacer, early weaned; group III milk replacer, early weaned a,b,cmeans with different superscripts within a row differ significantly (P < 0.05)
in the rumen contents were observed (Table 3). The molar proportion of acetate was increased (P = 0.013) and the proportion of propionate decreased (P = 0.020) in the late weaned calves (group I) when compared to the early weaned calves (group II and III). In the early weaned calves the ac-etate to propionate ratio also decreased (P = 0.035). Ammonia levels in the rumen contents were lower (P = 0.002) in the early weaned calves of group II.
Rumen mucosa
In the early weaned calves of group III the length, width, density and surface of rumen papillae of the atrium ruminis were increased (P < 0.05) when compared to the late weaned calves (group I). Both the papillae length and width of the ventral rumen sac were significantly greater in the early weaned calves (group III) than in the late weaned calves (group I). Likewise, the length of papillae in the ventral blind sac was larger in the early weaned calves of group III than in the late weaned calves (P < 0.05; Table 4).
Plasma IGF-1, insulin, and glucose concentrations
The plasma concentrations of insulin and glucose were lower (P = 0.03 and P < 0.01, respectively), but the plasma concentrations of IGF-1 tended to be higher (P = 0.10) in calves fed less milk and in-creased amounts of concentrate (Table 5).
Pearson correlation coefficients for selected parameters are presented in Table 6. Butyrate ex-hibited very low coefficients (–0.25 and 0.18) with IGF-1 and insulin. Correlation coefficients were negative for IGF-1 with acetate (–0.75) and for in-sulin with propionate (–0.77), but were positive for IGF-1 with propionate (0.85) and insulin with glucose (0.89) and acetate (0.69), respectively.
DISCUSSION
In our studies the pattern of rumen fermenta-tion was significantly different between animals weaned early or late. Molar proportion of acetate was significantly lower and molar concentration of propionate was significantly higher in calves fed the low milk and high solid diets. Consequently, the acetate to propionate ratio was lowered in the early weaned calves. Different types of diets did not influence the molar proportion of butyrate nor the pH and total SCFA concentration.
[image:6.595.62.531.117.203.2]The development of parakeratosis and strong mu-cosal proliferation were apparent after feeding high amounts of concentrate (groups II and III). This can be interpreted as a result of adaptive processes to the increased SCFA level (not significantly) and
Table 5. Effects of diet on plasma glucose, insulin-like growth factor 1 (IGF-1) and insulin concentrations in calves at the age of 42 days1
Group2
P-values
I II III
Glucose (mmol/l) 5.20 ± 0.85a 3.41 ± 0.46b 3.83 ± 0.68b < 0.001
IGF-1 (µg/l) 116 ± 44a 147 ± 32b 139 ± 25a,b 0.103
Insulin (µU/ml) 20 ± 16a 8 ± 3b 11 ± 9b 0.034
1values are means ± SD, group I and group II n = 11, group III n = 12
2group I milk free replacer, late weaned; group II milk free replacer, early weaned; group III milk replacer, early weaned a,bmeans with different superscripts within a row differ significantly (P < 0.05)
Table 6. Pearson coefficients of correlation between selected parameters and probability of difference from zero1
(n = 9)
C2 (mol%) C3 (mol%) C4 (mol%) C2 : C3 (mmol/l)Glucose IGF-1 (µg/l) (µU/ml)Insulin
IGF-1 (µg/L) –0.75 (0.02) 0.85 (<0.01) –0.25 (0.52) –0.80 (0.01) –0.84 (< 0.01)
Insulin (µU/mL) 0.69 (0.04) –0.77 (0.02) 0.18 (0.64) 0.68 (0.04) 0.89 (< 0.01) –0.84 (< 0.01)
Atrium ruminis
Length (mm) –0.73 (0.02) 0.75 (0.02) –0.09 (0.82) –0.71 (0.03) –0.69 (0.04) 0.58 (0.10) –0.73 (0.03) Surface (mm2/cm2) –0.61 (0.06) 0.70 (0.04) –0.19 (0.63) –0.62 (0.08) –0.51 (0.16) 0.45 (0.23) –0.59 (0.10)
Ventral rumen sac
Length (mm) –0.58 (0.10) 0.73 (0.03) –0.24 (0.53) –0.61 (0.08) –0.68 (0.05) 0.62 (0.08) –0.79 (0.01) Surface (mm2/cm2) –0.48 (0.19) 0.60 (0.09) –0.12 (0.77) –0.50 (0.18) –0.60 (0.08) 0.46 (0.22) –0.78 (0.01)
Ventral blind sac
Length (mm) –0.29 (0.46) 0.41 (0.28) –0.24 (0.54) –0.26 (0.50) –0.46 (0.21) 0.43 (0.25) –0.44 (0.24) Surface (mm2/cm2) –0.10 (0.79) 0.24 (0.54) –0.26 (0.50) –0.09 (0.82) –0.31 (0.42) 0.31 (0.42) –0.30 (0.43)
1in parentheses
[image:6.595.62.536.306.526.2]production, they can lead to health impairment in response to pathophysiological changes of the ru-men wall (Dirksen and Garry, 1987).
A higher proportion of butyrate usually causes the proliferation and keratinisation of papillae in the rumen of adult animals (Kauffold et al., 1977). This effect was not present in our examinations (Table 6). Papillae development and keratinisation of papillae were found without a change in the bu-tyrate proportion. However, the higher proportion of propionate was related to an increased papillae size. It was earlier demonstrated that the intrarumi-nal infusion of propionate, but not glucose resulted in a distinct development of the papillae in calves (Sander et al., 1959; Tamate et al., 1962).
The responsible mechanisms for the induction of papillary development are not fully understood. The plasma concentrations of insulin and glucose were lower (P < 0.05) and plasma concentra-tions of IGF-1 tended to be increased (P = 0.10) in calves with stimulated papillae development (Table 5). Shen et al. (2004) demonstrated in kids that circulating IGF-1 affected the rumen papillae development. The effect is probably mediated by IGF-binding proteins in tissue. As demonstrated in Table 6, a positive correlation existed between papil-lae length (atrium ruminis, ventral rumen sac) and plasma IGF-1 concentrations (P < 0.10). Insulin and glucose concentrations were negatively correlated with parameters of papillae (length, surface) devel-opment (P < 0.10). In contrast, ruminal epithelial proliferation in adult sheep was stimulated by i.v. infusion of insulin (Sakata et al., 1980) or by in vitro incubations with insulin (Baldwin, 1999). Obviously, differences exist in the metabolism of mature rumen papillae andneonatal rumen papillae. It seems that insulin is not a necessary factor controlling ruminal epithelial proliferation in neonatal calves.
CONCLUSION
In conclusion, the development of rumen papil-lae is stimulated in calves consuming less milk and increased amounts of concentrate. The effect is not correlated with the molar butyrate proportion but with the molar propionate proportion in the rumen and circulating IGF-1. Increased plasma glucose and insulin were not related to ruminal papillae development in neonatal calves consuming pre-dominantly milk replacer.
REFERENCES
Baldwin R.L. (1999): The proliferative actions of insulin, insulin-like growth factor-1, epidermal growth factor, butyrate and propionate on ruminal epithelial cells in vitro. Small Ruminant Research, 32, 261–268. Baldwin R.L., Jesse B.W. (1992): Developmental changes
in glucose and butyrate metabolism by isolated sheep ruminalcells. Journal of Nutrition, 122, 1149–1153. Breves G., Zitnan R., Schroder B., Winckler C.,
Hage-meister H., Failing K., Voigt J. (2002): Postnatal devel-opment of electrolyte transport in calf rumen as affected by weaning time. Archives of Animal Nutri-tion, 56, 371–377.
Di Giancamillo A., Bosi G., Arrighi S., Savoini G., Do-meneghini C. (2003): The influence of different fibrous supplements in the diet on ruminal histology and his-tometry in veal calves. Histology Histopathology, 18, 727–733.
Dirksen G., Garry F.B. (1987): Diseases of the forestom-achs in calves – Part I. BEEF Continuing Education Article, 9, 140–146.
Geissler Ch., Hoffmann M., Hickel B. (1976): Determina-tion of volatile fatty acids by gas chromatography (in German). Archives of Animal Nutrition, 26, 123–129. Hamada T., Maeda S., Kameoka K. (1976): Factors in-fluencing growth of rumen, liver and other organs in kids weaned from milk replacers to solid foods. Jour-nal of Dairy Science, 59, 1110–1118.
Hodson J. (1971): The development of solid food intake in calves. 1. The effect of previous experience of solid food, and the physical form of the diet, on the develop-ment of food intake after weaning. Animal Production, 13, 15–24.
Hofmann R.R., Schnorr B. (1982): The Functional Mor-phology of the Forestomachs(in German). Ferdinand Enke Verlag, Stuttgart.
Jesse B.W., Wang L.Q., Baldwin R.L. (1995): Genetic regulations of postnatal sheep rumen metabolic de-velopment. In: Engelhardt W.V., Leonard-Marek S., Breves G., Giesecke D. (eds.): Ruminal Physiology: Digestion, Metabolism, Growth and Reproduction. Proceedings of the Eighth International Symposium on Ruminant Physiology. Ferdinand Enke Verlag, Stutt-gart. 501–517.
Kohler P., Kallweit, E., Henning, M., Flachowsky, G. (1997): Comparative examination of rumen develop-ment, fattening performance and carcass quality in veal calves from natural maternal rearing or conven-tional bucket feeding (in German). Zuchtungskunde, 69, 254–267.
Kuhla S., Weissbach F. (1996): Estimation of the me-tabolizable energy in combined feeds for ruminants by a cellulase-method. Proceedings of the Society of Nutrition Physiology, 5, 116.
Lesmeister K.E., Heinrichs A.J. (2004): Effects of corn processing on growth characteristics, rumen develop-ment, and rumen parameters in neonatal dairy calves. Journal of Dairy Science, 87, 3439–3450.
Naumann C., Bassler R. (1993): The Chemical Investiga-tion of Feeds (in German). VDLUFA-Verlag, Darm-stadt.
Roy J.H.B. (1980): The Calf. Butterworths, London. Sakata T., Hikosaka K., Shiomura Y., Tamate H. (1980):
Stimulatory effect of insulin on ruminal epithelium cell mitosis in adult sheep. British Journal of Nutrition, 44, 325–331.
Sander E.G., Warner R.G., Harrison H.N., Loosli J.K. (1959): The stimulation effect of sodium butyrate and sodium propionate on the development of rumen mu-cosa in the young calf. Journal of Dairy Science, 42, 1600–1605.
Sehested J., Diernaes L., Moller P.D., Skadhauge E. (1999): Transport of butyrate across the isolated bo-vine rumen epithelium-interaction with sodium, chlo-ride and bicarbonate. Comparative Biochemistry and Physiology, Part A, 123, 399–408.
Shen Z., Seyfert H.M., Lohrke B., Schneider F., Zitnan R., Chudy A., Kuhla S., Hammon H.M., Blum J.W., Martens H., Hagemeister H., Voigt J. (2004): An
en-ergy-rich diet causes rumen papillae proliferation as-sociated with more IGF type 1 receptors and increased plasma IGF-1 concentrations in young goats. Journal of Nutrition, 134, 11–17.
Tamate H., McGilliard A.D., Jakobson N.L.,Getty R. (1962): Effect of various dietaries on the anatomical development of the stomach in the calf. Journal of Dairy Science, 45, 408–420.
Voigt J., Steger H. (1967): About the determination of ammonia, urea, and ketone bodies in biological material using a modified type of microdiffusion vessel (in Ger-man). Archives of Animal Nutrition, 17, 289–293. Zitnan R., Bomba A., Sommer A., Kolodzieyski L.
(1993a): Development of rumen metabolism and ru-minal epithelium in lambs. Archives of Animal Nutri-tion, 44, 227–233.
Zitnan R., Bomba A., Laukova A., Sommer A., Kolodziey-ski L., Venglovsky J., Bindas L. (1993b): The effect of diet composition on the development of rumen digestion in lambs. Archives of Animal Nutrition, 45, 161–171. Zitnan R., Voigt J., Schönhusen U., Wegner J., Kokardova
M., Hagemeister H., Levkut M., Kuhla S., Sommer A. (1998): Influence of dietary concentrate to forage ratio on the development of rumen mucosa in calves. Ar-chives of Animal Nutrition, 51, 279–291.
Zitnan R., Voigt J., Wegner J., Breves G., Schroder B., Winckler C., Levkut M., Kokardova M., Schonhusen U., Kuhla S., Hagemeister H., Sommer A. (1999): Mor-phological and functional development of the rumen in the calf: Influence of the time of weaning. 1. Mor-phological development of rumen mucosa. Archives of Animal Nutrition, 52, 351–362.
Received: 05–08–22 Accepted: 05–11–12
Corresponding Author
Dr. Siegfried Kuhla, Research Unit Nutritional Physiology “Oskar Kellner”, Research Institute for the Biology of Farm Animals (FBN), Wilhelm Stahl Allee 2, D-18196 Dummerstorf, Germany