1 1
2
Experimental evaluation of changes in strain under compressive fatigue
3
loading of brick masonry
4
I.S. Koltsida
a,1, A.K. Tomor
a, C.A. Booth
a 5a Faculty of Environment and Technology, University of the West of England, Frenchay Campus, Coldharbour Lane, 6
Bristol BS16 1QY, UK
7
1 Corresponding author. Tel.: +44 (0) 1173283049. E-mail addresses: [email protected]. 8
9
ABSTRACT
10Assessing the long-term performance of masonry structures and their response to increased loading
11conditions are critical to safety and maintenance. A series of laboratory tests have been carried out
12on brick masonry to assess its performance under long-term fatigue loading. The relationship between
13stress levels and number of cycles to failure was identified under compressive loading, together with
14stress-strain evolution at various stress levels. Strain evolution shows distinctive characteristics for
15the three stages of deterioration and increased strain for increased number of cycles. Experimental
16results provide useful data for developing analytical prediction models for the fatigue deterioration
17of masonry structures.
18Keywords: Brick Masonry, Fatigue, Strain Evolution, Stress-Strain curves, SN curves 19
2
1.
Introduction
21
The longest standing bridges around the world are 22
masonry arch bridges, representing around 40% of 23
the highway, railway and waterway bridge 24
infrastructure in Europe [1]. Due to their age and 25
constantly increasing weight, speed and density of 26
traffic, their assessment and maintenance are 27
becoming increasingly important to ensure their 28
continued safe performance. 29
High-cycle fatigue loading experienced over 100+ 30
years of service life can lead to significant changes 31
on the material level and deterioration below 32
serviceability or ultimate failure load [2]. 33
Identifying the rate of fatigue deterioration and 34
changes in the material properties for masonry are 35
necessary to enable improved assessment of load 36
capacity, remaining service life, optimising traffic 37
loading and planning maintenance works. 38
Limited data is however available for assessing the 39
fatigue capacity of masonry structures. Some 40
experimental data is available on SN curves (stress 41
vs. number of cycles) for masonry under fatigue 42
loading (Abrams et al., 1985; Clark, 1994; Ronca 43
et al. 2004; Roberts et al., 2006; Tomor & 44
Verstrynge, 2013; Tomor et al., 2013) but minimal 45
information has been presented on the evolution of 46
strain under fatigue deterioration. 47
Abrams et al. [3] performed experimental test 48
series on brickwork prisms to investigate the 49
mechanics of masonry under cyclic compressive 50
stress. Abrams et al. concluded that cyclic loading 51
leads to gradual reduction in the compressive 52
strength of masonry and that the rate of reduction 53
is a function of the mortar strength, amplitude and 54
number of cycles. Greater cyclic stress levels and 55
stronger mortars accelerate deterioration. Clark [4] 56
conducted similar experiments and proposed SN 57
curves for dry and wet masonry, suggesting a 58
fatigue limit for dry brick masonry around ~50% of 59
its quasi-static compressive strength. 60
Roberts et al. [5] defined a lower bound fatigue 61
strength for dry, submerged and wet brick masonry 62
based on a series of quasi-static and high cycle 63
fatigue tests on brick masonry (Equation 1.1). 64
𝐹(𝑆) =(∆𝜎𝜎𝑚𝑎𝑥) 0.5
𝑓𝑐 = 0.7 − 0.05 𝑙𝑜𝑔 𝑁 1.1
Where F(S) is the function of the induced stress, σ 65
is the stress range, σmax is the maximum stress, fc is 66
the quasi-static compressive strength of masonry 67
3 Casas [2] proposed a probability-based fatigue 69
model for brick masonry under compression with 70
different defined confidence levels based on the 71
experimental data reported by Roberts et al. [5] 72
(Equation 1.2). 73
𝑆𝑚𝑎𝑥= 𝐴 × 𝑁−𝐵(1−𝑅) 1.2
Where Smax is the ratio of the maximum loading 74
stress to the quasi-static compressive strength, N is 75
the number of cycles to failure and R is the ratio of 76
the minimum stress to the maximum stress 77
σmin/σmax. Coefficients A and B depend on the value 78
of the survival function and were calculated by 79
Casas [2]. 80
Tomor and Verstrynge [6] proposed a joined 81
fatigue-creep deterioration model. A probabilistic 82
fatigue model was suggested by adapting Casas’ 83
[7] model and introducing a correction factor C, 84
allowing the interaction between the creep and 85
fatigue phenomena to be taken into account and 86
adjusting the slope of the SN curve (Equation 1.3). 87
𝑆𝑚𝑎𝑥= 𝐴 ∙ 𝑁−𝐵(1−𝐶∙𝑅) 1.3
Where Smax is the ratio of the maximum stress to 88
the average compressive strength (Smax = σMax/fc), 89
N the number of cycles, R the ratio of the minimum 90
stress to the maximum stress (R = σMin/σMax), 91
parameter A is set to 1, parameter B is set to 0.04 92
and C is the correction factor. 93
Tomor and Verstrynge [6] identified three stages of 94
fatigue deterioration with the use of an acoustic 95
emission technique to monitor the response of 96
masonry prisms under long-term fatigue in 97
compression. During the first stage (0-75% of the 98
total number of cycles), the acoustic emission 99
levels were relatively low and constant. A small 100
increase in emission was observed in the second 101
stage (75-95% cycles), followed by rapid increase 102
in emission and sudden failure during the third 103
stage (95-100% cycles). 104
Tomor et al. [8] also identified three distinct stages 105
of fatigue deterioration based on acoustic emission 106
levels. During Stage I, reduction in emission was 107
observed (0-32% of the total loading cycles for 108
compression and 0-58% for shear). During Stage 109
II, emission stabilised (32-67% for compression, 110
not evident in shear) and in Stage III rapid increase 111
in emission was observed, leading to failure (67-112
100% for compression, 58-100% shear). 113
Carpinteri et al. [9] performed a series of quasi-114
4 stress) on brick masonry specimens and walls and 116
suggested a ε-N curve (strain vs. number of cycles) 117
with three distinctive stages. During Stage I 118
deformations increased rapidly for the first 10% of 119
loading cycles, during Stage II deformations 120
increased at a constant rate (10-80% of loading 121
cycles) and during Stage III deformations increased 122
rapidly again, leading to failure. Carpinteri et al. 123
[9] also related the rate of change in vertical 124
deformation during Stage II (ϑεv/ϑn) to the number 125
of cycles at failure (Nf cycles) as shown in Equation 126
1.4. 127
𝑁𝑓 = 𝑎 ( 𝜗𝜀𝑣
𝜗𝑛) 𝑏
1.4
Where εv is the vertical deformation, n is the 128
number of cycles and Nf is the number of loading 129
cycles at failure. Parameters a and b are material 130
constants, that can be evaluated experimentally by 131
applying a number of loading cycles on a prism up 132
to the point here deformation starts to increase at a 133
constant rate (over 10% of the fatigue life). 134
There are conflicting results for the different stages 135
of fatigue for masonry and a lack of experimental 136
data for identifying appropriate SN curves for 137
different types of masonry and the evolution of 138
strain under fatigue loading. The aim of this study 139
is to i) investigate the stages of fatigue 140
deterioration, ii) investigate the evolution of strain 141
and stress-strain curves and iii) provide test data to 142
develop mathematical models to predict the fatigue 143
life of masonry. 144
145
2.
Quasi-static and long-term cyclic tests
146
under compression
147
Based on the work of Roberts et al. [5] and Tomor 148
et al. [8], a series of brick masonry prisms have 149
been tested under quasi-static and long-term cyclic 150
compressive loading to identify changes in the 151
material properties of masonry. 152
2.1 Materials 153
The experimental study intends to represent the 154
weakest form of masonry, widely found in the UK 155
waterways network, originating from the 1750s-156
1850s. Brick masonry prisms were built using 157
handmade low-strength solid 210x100x65 mm3 158
Michelmersh bricks (B1 bricks). The average 159
compressive strength of the bricks was 4.86 N/mm2 160
(1.19 N/mm2 standard deviation (SD) and 24.48% 161
coefficient of variation) and the gross dry density 162
1823 kg/m3. Lime-mortar with 0:1:2 cement: lime: 163
5 NHL3.5 lime and 3 mm sharp washed sand and the 165
mortar joins were 8 mm thick. 166
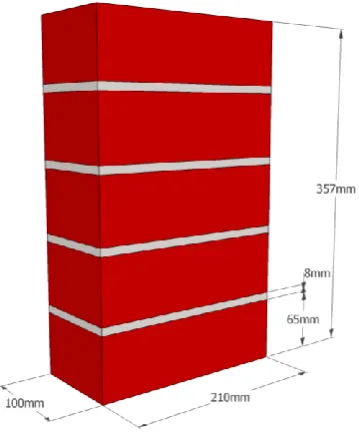
2.2 Test specimens 167
Small-scale masonry prisms (B1M01) comprised 168
of five stack-bonded bricks with four 8 mm mortar 169
joints built according to the ASTM standards 170
(ASTM, 2014) with total dimensions of 210 x 100 171
x 357 mm3 (Figure 2-1). In order to have systematic 172
building quality, the same experienced master 173
stonemason constructed all specimens. 174
Specimens were cured at room temperature for a 175
minimum of five days, stored outdoors for a 176
maximum of six months and acclimatised for a 177
minimum of three days at room temperature prior 178
to testing (Oliveira et al., 2006). 179
[image:5.595.78.258.505.724.2]180
Figure 2-1 Masonry prism dimensions
181
2.3 Test setup, preparation and instrumentation 182
Specimens were tested under compression using a 183
250 kN actuator. Deflections were monitored using 184
four Linear Variable Differential Transformers 185
(LVDTs) with 5 mm linear range and 0.07% 186
accuracy. Two LVDTs were attached at the front 187
and two in the back of the prisms (Figure 2-2). 188
LVDTs were positioned at 10 mm distance from 189
the edges of the prisms and set against wooden 190
blocks (Tomor & Verstrynge, 2013; Tomor et al., 191
2013). The distance between the wooden blocks 192
and the LVDTs was ca. 81 mm and included two 193
mortar joints (8 mm each) and one brick (65 mm). 194
The upper and lower surfaces of the prisms were 195
brushed to remove loose particles and ground flat 196
prior to the test (Oliveira et al., 2006; ASTM, 197
2014). Prisms were placed, subsequently, between 198
layers of 3 mm plywood and 30 mm steel plates to 199
ensure effective load distribution and to reduce 200
localised stress concentrations (Tomor & 201
6 203
Figure 2-2 Instrumentation of prisms 204
205
2.4 Loading 206
Three sets of tests were performed under quasi-207
static and fatigue loading to identify material 208
properties and to investigate changes in the 209
material during high-cycle compressive fatigue 210
loading of masonry prisms. 211
Quasi-Static tests. A set of six prisms were 212
tested under displacement-controlled quasi-static 213
compression to obtain the mean compressive 214
strength of the material. Loading was applied at 215
0.01 mm/sec rate of displacement to obtain the full 216
stress-strain curve. 217
Fatigue tests - Type I. Masonry prisms 218
were tested under long-term compressive cyclic 219
loading at 2 Hz frequency to identify the number of 220
cycles to failure at different stress levels. Before 221
the start of the fatigue tests, quasi-static loading 222
was applied up to the mean fatigue load. Fatigue 223
loading was subsequently applied in a sinusoidal 224
pattern (Figure 2-3), between defined minimum 225
and maximum stress levels. 226
[image:6.595.283.537.105.379.2]227
Figure 2-3 Sinusoidal load pattern for Type I fatigue tests 228
The minimum (Smin) and maximum (Smax) stress 229
levels were expressed as percentage of the mean 230
ultimate quasi-static strength. The minimum stress 231
represent the dead load of the structure due to its 232
self-weight and was set to 10% of the ultimate 233
compressive strength to enable the most extreme 234
range of fatigue loading to be applied. 235
The maximum stress level represents live load (e.g. 236
similar to traffic over a masonry arch bridge) and 237
ranged between 55% and 80% (55%, 60%, 68%, 238
80%) of the ultimate compressive strength for the 239
7
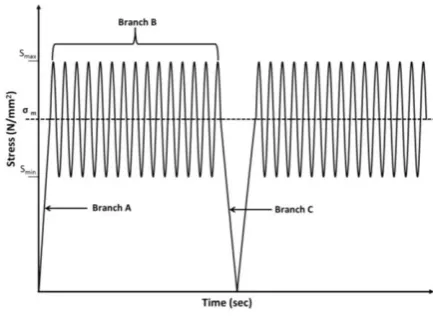
Fatigue tests - Type II. The second set of 241
fatigue tests was designed to identify stages during 242
fatigue deterioration and evolution of the stress-243
strain curves. Loading was first applied statically 244
up to the mean fatigue stress level σm under 245
displacement control at a 0.01 mm/sec loading rate 246
(Branch A, Figure 2-4), cycled sinusoidally 247
between the minimum and maximum load levels 248
for 1000 cycles (Branch B, Figure 2-4) and 249
unloaded (Branch C, Figure 2-4). The process was 250
repeated until failure occurred. Branch A was used 251
to identify the stress-strain relationship, up to the 252
mean fatigue stress level, every 1000 cycles during 253
the fatigue life of the prisms. Similarly to Type I 254
fatigue tests, the minimum stress level was set to 255
10% of the compressive strength and the maximum 256
stress level was set to 63%, 68% and 73% for the 257
individual specimens. 258
259
Figure 2-4 Load pattern for Type II fatigue tests
260
(Branch A quasi-static loading, Branch B cyclic loading,
261
Branch C unloading)
262
263
3.
Results
264
3.1 Quasi-static tests 265
The mean compressive strength for the set of 266
B1M01 prisms tested, according to BS EN 1052-267
1:1999, was 2.94 N/mm2 (SD 0.10 N/mm2). During 268
quasi-static compression vertical cracks developed 269
initially around the middle of the specimens and 270
subsequently on the narrow sides, leading to failure 271
(Figure 3-1). 272
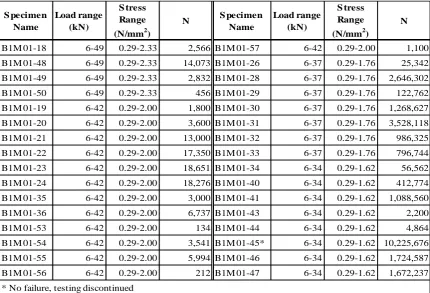
3.2 Fatigue Tests – Type I. 273
A total of 32 prisms were tested to failure under 274
maximum stress levels of 55, 60, 68 or 80% of the 275
average quasi-static compressive strength (see 276
section 2.4). The maximum number of loading 277
[image:7.595.314.531.84.245.2]8 Table 3-1 Fatigue test results - Type I
279
S pecimen Name
Load range (kN)
S tress Range (N/mm2)
N S pecimen
Name
Load range (kN)
S tress Range (N/mm2)
N
B1M 01-18 6-49 0.29-2.33 2,566 B1M 01-57 6-42 0.29-2.00 1,100
B1M 01-48 6-49 0.29-2.33 14,073 B1M 01-26 6-37 0.29-1.76 25,342
B1M 01-49 6-49 0.29-2.33 2,832 B1M 01-28 6-37 0.29-1.76 2,646,302
B1M 01-50 6-49 0.29-2.33 456 B1M 01-29 6-37 0.29-1.76 122,762
B1M 01-19 6-42 0.29-2.00 1,800 B1M 01-30 6-37 0.29-1.76 1,268,627
B1M 01-20 6-42 0.29-2.00 3,600 B1M 01-31 6-37 0.29-1.76 3,528,118
B1M 01-21 6-42 0.29-2.00 13,000 B1M 01-32 6-37 0.29-1.76 986,325
B1M 01-22 6-42 0.29-2.00 17,350 B1M 01-33 6-37 0.29-1.76 796,744
B1M 01-23 6-42 0.29-2.00 18,651 B1M 01-34 6-34 0.29-1.62 56,562
B1M 01-24 6-42 0.29-2.00 18,276 B1M 01-40 6-34 0.29-1.62 412,774
B1M 01-35 6-42 0.29-2.00 3,000 B1M 01-41 6-34 0.29-1.62 1,088,560
B1M 01-36 6-42 0.29-2.00 6,737 B1M 01-43 6-34 0.29-1.62 2,200
B1M 01-53 6-42 0.29-2.00 134 B1M 01-44 6-34 0.29-1.62 4,864
B1M 01-54 6-42 0.29-2.00 3,541 B1M 01-45* 6-34 0.29-1.62 10,225,676 B1M 01-55 6-42 0.29-2.00 5,994 B1M 01-46 6-34 0.29-1.62 1,724,587
B1M 01-56 6-42 0.29-2.00 212 B1M 01-47 6-34 0.29-1.62 1,672,237
* No failure, testing discontinued 280
The failure patterns under fatigue loading were 281
very similar to quasi-static loading with vertical 282
splitting cracks along the middle of the specimens, 283
leading to failure (Figure 3-1). 284
Results of the quasi-static and fatigue compression 285
tests are shown in Figure 3-2 together with 286
proposed SN relationships by Casas [2] and Tomor 287
& Verstrynge [6]. Quasi-static test results are 288
included as failure at 1 cycle. The SN relationship 289
by Casas [2] gives a good indication of the mean 290
number of cycles at each stress level, while the 291
relationship by Tomor and Verstrynge [6] 292
incorporates the quasi-static test results, although 293
slightly overestimates the mean number of cycles. 294
295
Figure 3-1 Typical failure pattern under (a) quasi-static
296
compression and (b) fatigue compression
[image:8.595.308.535.474.655.2]9 298
Figure 3-2 Fatigue test data together with SN curves [2, 6]. 299
During the Type I Fatigue tests, maximum and 300
minimum total longitudinal displacements were 301
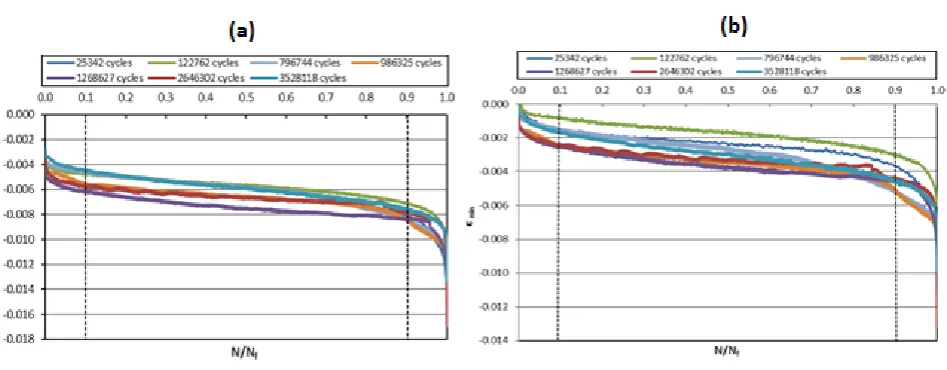
recorded and the strain evolution curves (ε-N/Nf) 302
plotted for each stress level in Figure 3-3to Figure 303
3-6 (for 55, 60, 68, 80% maximum stress 304
respectively). The ε-N curves exhibit a typical S 305
shape (Holmen, 1982; Carpinteri et al., 2014), with 306
three distinct stages: 307
Stage I: rapid increase of strain during the first 308
10% of the life expectancy, caused by initiation of 309
micro-cracks. 310
Stage II: reveals a gradual increase of strain for 311
approximately 80% of the total number of cycles, 312
caused by development of micro-cracks. 313
Stage III: rapid increase of strain during the last 314
10-20% of life expectancy, caused by coalition of 315
micro-cracks into macro-cracks and leading to 316
failure. 317
Carpinteri et al. [9] indicated that Stage II lasts 318
until 80% of the fatigue life of masonry based on 319
limited tests under 70% stress, while according to 320
the data presented here, Stage II occupies the range 321
between 10% and 90% of the total loading cycles 322
sustained by a prism at different stress levels. 323
Carpinteri et al. [9] proposed the use of equation 324
1.4 to correlate the vertical deformation with the 325
number of cycles. The strain evolution could be 326
more precisely described by three distinct 327
10 and linear type for stage II) for the different fatigue 329
stages that would consider the effect of stress level. 330
[image:10.595.59.528.146.333.2]331
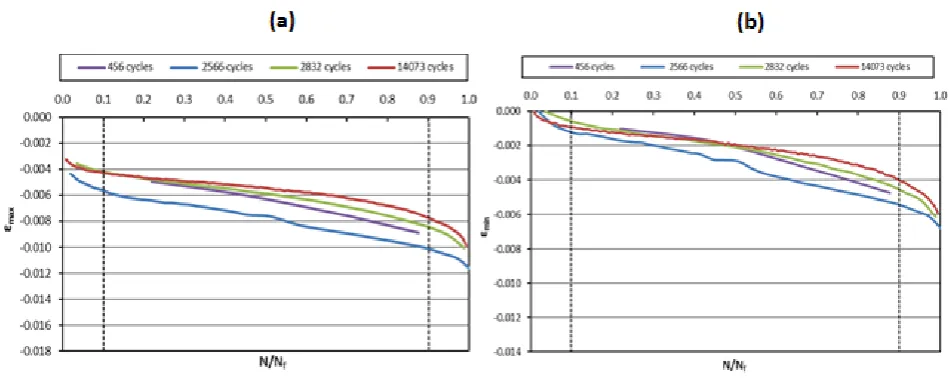
Figure 3-3 Total longitudinal strain variation with the cycle ratio for 55% maximum stress level (a) maximum total strain,
332
(b) minimum total strain
333
334
335
Figure 3-4 Total longitudinal strain variation with the cycle ratio for 60% maximum stress level (a) maximum total strain,
336
(b) minimum total strain
[image:10.595.64.538.432.617.2]11 338
Figure 3-5 Total longitudinal strain variation with the cycle ratio for 68% maximum stress level (a) maximum total strain,
339
(b) minimum total strain
340
341
342
Figure 3-6 Total longitudinal strain variation with the cycle ratio for 80% maximum stress level (a) maximum total strain,
343
(b) minimum total strain
344
Three stages of strain development have already 345
been identified in concrete under fatigue loading 346
(Holmen, 1982; Kim & Kim, 1996; Breitenbucher 347
& Ibuk, 2006; Zanuy et al., 2011) and also for 348
masonry (Carpinteri et al., 2014). 349
The rate of strain evolution at Stage II is noticeably 350
steeper for higher stress levels (as shown in Figure 351
3-7 for maximum stress levels 55%, 60%, 68% and 352
[image:11.595.59.535.366.555.2]12 process at higher stress levels leading to earlier 354
failure of the specimen. 355
[image:12.595.49.281.144.294.2]356
Figure 3-7 Strain rate (dε/d(N/Nf)) for 55%, 60%, 68%, 357
80% maximum stress during Stage II Fatigue test - Type
358
I
359
3.3 Fatigue tests – Type II 360
Masonry prisms were tested under 73%, 68% and 361
63% maximum compressive stress during Type II 362
fatigue tests (see Section 2.4) and results listed in 363
[image:12.595.310.529.388.647.2]Table 3-2 to Table 3-4. 364
Table 3-2 Fatigue test results - Type II, 73% maximum
365
stress
366
S pecimen Name
Load Range
(kN)
S tress Range (N/mm2)
N
B1M 01-66 6-45 0.29-2.14 253
B1M 01-67 6-45 0.29-2.14 200
B1M 01-68 6-45 0.29-2.14 413
B1M 01-69 6-45 0.29-2.14 53
B1M 01-70 6-45 0.29-2.14 55
B1M 01-76 6-45 0.29-2.14 7
B1M 01-77 6-45 0.29-2.14 104
B1M 01-78 6-45 0.29-2.14 240
B1M 01-85 6-45 0.29-2.14 93
367
Table 3-3 Fatigue test results - Type II, 68% maximum
368
stress
369
S pecimen Name
Load Range
(kN)
S tress Range (N/mm2)
N
B1M 01-58 6-42 0.29-2.00 31,000 B1M 01-59 6-42 0.29-2.00 69,537
B1M 01-60 6-42 0.29-2.00 34
B1M 01-61 6-42 0.29-2.00 71,342 B1M 01-62 6-42 0.29-2.00 11,754 B1M 01-63 6-42 0.29-2.00 37,938 B1M 01-64 6-42 0.29-2.00 33,752 B1M 01-65 6-42 0.29-2.00 275,000 370
371
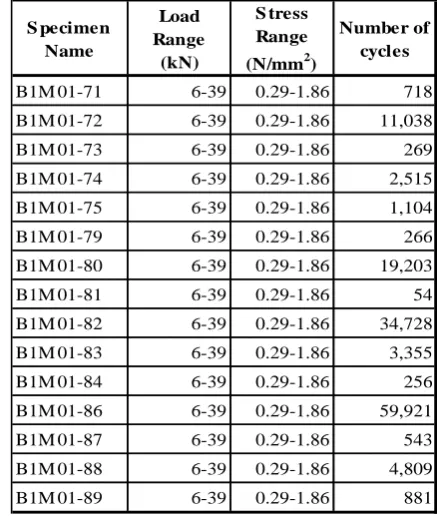
Table 3-4 Fatigue test results - Type II, 63% maximum
372
stress
373
S pecimen Name
Load Range
(kN)
S tress Range (N/mm2)
Number of cycles
B1M 01-71 6-39 0.29-1.86 718
B1M 01-72 6-39 0.29-1.86 11,038
B1M 01-73 6-39 0.29-1.86 269
B1M 01-74 6-39 0.29-1.86 2,515
B1M 01-75 6-39 0.29-1.86 1,104
B1M 01-79 6-39 0.29-1.86 266
B1M 01-80 6-39 0.29-1.86 19,203
B1M 01-81 6-39 0.29-1.86 54
B1M 01-82 6-39 0.29-1.86 34,728
B1M 01-83 6-39 0.29-1.86 3,355
B1M 01-84 6-39 0.29-1.86 256
B1M 01-86 6-39 0.29-1.86 59,921
B1M 01-87 6-39 0.29-1.86 543
B1M 01-88 6-39 0.29-1.86 4,809
B1M 01-89 6-39 0.29-1.86 881
374 375
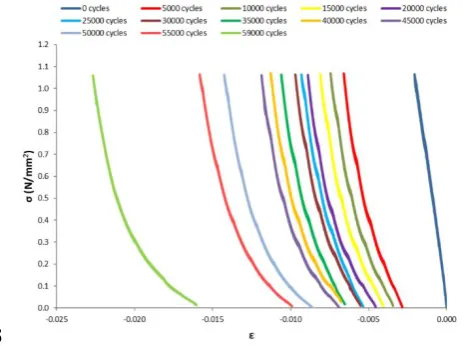
Evolution of the stress-strain curves for 68% and 376
[image:12.595.56.264.580.753.2]13 (every 500 cycles for B1M01-83 and B1M01-88) 378
are shown in Figure 3-8 and Figure 3-9. No stress-379
strain curve could be identified for 73% stress due 380
to rapid deterioration and failure under 300 cycles. 381
The stress-strain curve is straight initially (or 382
slightly concave towards the strain axis) and 383
becomes convex and increasingly curved for 384
increasing load cycles. The residual strain is large 385
in Stage I, decreases and stabilises in Stage II and 386
increases fast again in Stage III. Concrete exhibits 387
similar behaviour under fatigue loading [10, 11]. 388
389
390
Figure 3-8 Stress-strain curve development every 1000
391
cycles under 68% maximum stress (B1M01-61)
392
[image:13.595.305.538.84.257.2]393
Figure 3-9 Stress-Strain curve development every 1000 cycles 394
under 63% maximum stress (B1M01-86)
395
It is noteworthy that the maximum recorded strains 396
at failure, during quasi-static compressive tests are 397
noticeably lower compared to respective strains 398
under fatigue loading. Thus, prior cyclic loading of 399
a masonry prism imposes additional deformation. 400
The maximum strain at failure is the lowest under 401
quasi-static loading (0.002-0.005; mean 0.003; SD 402
0.001) and increases for lower fatigue stress levels 403
(0.005-0.018; mean 0.012; SD 0.005 for 68% 404
maximum stress and 0.017-0.025; mean 0.020; SD 405
0.003 for 63% maximum stress). Increased strain 406
under lower fatigue stress levels is likely to be 407
associated with increasing effect of creep. For 408
extended test durations creep damage is 409
accumulated during the relatively longer time spent 410
14
4.
Discussion
412
Masonry arch bridges are subjected to increasing 413
traffic loading and gradual material deterioration 414
due to environmental impact and fatigue loading. 415
Changes in the material properties have direct 416
influence on the load carrying capacity and rate of 417
deterioration of the overall structure. Very little 418
guidance is, however, available for estimating 419
changes in the material properties for masonry over 420
time. Test data will next be used to develop 421
mathematical models for the evolution of material 422
properties under fatigue compressive loading. 423
Mathematical models can in turn be used for 424
improved modelling of masonry under changing 425
load regimes and estimating the load-carrying 426
capacity over time to improve assessment, 427
maintenance and restoration masonry arch bridges. 428
The fatigue life of the structure can be evaluated by 429
available SN models [2, 6]. Past and future loading 430
history may be estimated using simplified load 431
models, e.g. Miner’s Rule (Equation 4.1) [12] to 432
evaluate the residual service life. 433
𝑛1 𝑁1+ ⋯ +
𝑛𝑖−1 𝑁𝑖−1+
𝑛𝑖
𝑁𝑖 < 1 4.1
Where ni is the number of cycles at any stress range 434
and Ni is the number of cycles causing failure at 435
the corresponding stress range. Knowing the 436
number of cycles that the structure has experienced 437
an appropriate stress-strain curve can be selected 438
for the assessment of a masonry arch bridge (e.g. 439
using finite element models). 440
Changes in the deformability of a masonry arc 441
bridge under traffic loading, observed during 442
monitoring, can be associated with the 443
experimentally recorded ε-N curve configuration 444
and contribute to appropriate maintenance 445
planning. The configuration of the ε-N curve 446
indicates that strain changes with high rate and in 447
parabolic shape during stage I and III and linearly 448
at a constant rate during the second stage. An 449
observed sudden change during long-term 450
monitoring of a structure from linear growth of 451
strain to a non-linear trend could mean that the 452
structure is undergoing stage III and major 453
strengthening is required or traffic needs to be 454
diverted. 455
15
5.
Conclusions
457
This study presents test results from small-scale 458
laboratory tests on changes of the material 459
properties of masonry under compressive fatigue 460
loading. 461
Strain evolution curves (ε-N) exhibit a typical ‘S’ 462
configuration with three distinct stages. During the 463
first stage (10% of Nf), strains grow rapidly 464
indicating initiation of micro-cracks. Stage II is the 465
dominant stage (10-90% of Nf) during which the 466
strains grow steadily until Stage III (90-100% of 467
Nf), at which point, coalition of micro-cracks to 468
macro-cracks leads to sudden failure of the prism. 469
The rate of strain evolution in Stage II of the fatigue 470
life is lower for lower stress levels. 471
The configuration of the stress-strain curve 472
changes during cyclic compressive loading from 473
concave with respect to the strain axis to convex 474
with greater curvature for increased loading cycles. 475
Large initial change in the residual strain is 476
observed in Stage I, reduced and relatively constant 477
strain in Stage II and increases again in Stage III. 478
Prior cyclic loading of masonry imposes additional 479
deformation. The maximum strain at failure is 480
greater for lower fatigue stress levels, likely to be 481
due to the effect of creep for longer test durations. 482
Test data will be used to develop probability based 483
mathematical models for the evolution of material 484
properties under fatigue compressive loading. 485
Improved models for material properties will 486
enable enhanced modelling of masonry arch 487
bridges and estimation of the load carrying 488
capacity and remaining service life over time. 489
490
Acknowledgement
491
The work reported in this paper was supported by 492
the International Union of Railways (UIC). The 493
technical and financial support provided, is 494
gratefully acknowledged by the authors. 495
References
496
[1] S. Sustainable Bridges Project, “European Railway Bridge Demography, Deliverable D1.2 – Technical report,” 2004.
[2] J. R. Casas, “A probabilistic fatigue strength model for brick masonry under compression,” Construction and Building Materials, vol. 23, no. 8, pp. 2964-2972, 2009.
[3] D. P. Abrams, J. L. Noland and R. H. Atkinson, “Response of Clay-unit Masonry to Repeated Compressive Forces,” Melbourne, Australia, 1985.
16 Masonry,” British Rail Research Report No. LR-CES-151, 1994.
[5] T. Roberts, T. Hughes, V. Dandamudi and B. Bell, “Quasi-static and high cycle fatigue strength of brick masonry,” Construction and Building Materials, vol. 20, no. 9, pp. 603-614, 2006.
[6] A. Tomor and E. Verstrynge, “A joint fatigue–creep deterioration model for masonry with acoustic emission based damage assessment,” Construction and Building Materials, vol. 43, no. 1, pp. 575-588, 2013.
[7] J. R. Casas, “Reliability-based assessment of masonry arch bridges,” Construction and Building Materials, vol. 25, no. 4, pp. 1621-1631, 2011.
[8] A. Tomor, S. De Santis and J. Wang, “Fatigue deterioration process of brick masonry,” Journal of the International Masonry Society, vol. 26, no. 2, pp. 41-48, 2013.
[9] A. Carpinteri, A. Grazzini, G. Lacidogna and A. Manuello, “Durability evaluation of reinforced masonry by fatigue tests and acoustic emission technique,” Structural Control and Health Monitoring, vol. 21, no. 6, pp. 950-961, 2014.
[10] J. Crumley and W. Kennedy, “Fatigue and Repeated-load Elastic Characteristics of Inservice Portland Cement Concrete,” Center of highway research, The University of Texas, Texas, USA, 1977.
[11] J. O. Holmen, “Fatigue of concrete by constant and variable amplitude loading,” ACI, vol. 75, no. 0, pp. 71-110, 1982.
[12] M. Miner, “Cumulative damage in fatigue,” Journal of Applied Mechanics, vol. 67, pp. A159-A164, 1945.
[13] D. V. Oliveira, P. B. Lourenço and P. Roca, “Cyclic behaviour of stone and brick masonry under uniaxial compressive loading,” Materials and Structures, vol. 39, no. 2, pp. 247-257, 2006.
[14] P. Ronca, A. Franchi and P. Crespi, “Structural failure of historic buildings: masonry fatigue tests for an interpretation model,” Structural Analysis of Historical Constructions, vol. 2, no. 1, pp. 273-279, 2004.
[15] C. Zanuy, L. Albajar and P. de la Fuente, “The fatigue process of concrete and its structural influence,” Materiales de Construccion, vol. 61, no. 303, pp. 385-399, 2011.
[16] ASTM, “Standard test method for compressive strength of masonry prisms,” in Annual Book of ASTM Standards, vol. 4.05, ASTM, Ed., West Conhohocken, ASTM International, 2014, pp. 889-895.
[17] R. Breitenbucher and H. Ibuk, “Experimentally based investigations on the degradation-process of concrete under cyclic loading,” Materials and Structures, vol. 39, no. 7, pp. 717-724, 2006.
[18] J. Kim and Y. Kim, “Experimental study of the fatigue behavior of high strength concrete,” Cement and Concrete Research, vol. 26, no. 10, pp. 1513-1523, 1996. 497

![Figure 3-2 Fatigue test data together with SN curves [2, 6].](https://thumb-us.123doks.com/thumbv2/123dok_us/578752.557558/9.595.123.482.83.316/figure-fatigue-test-data-sn-curves.webp)