Temporal constraints on predation risk assessment in a changing world
Douglas P. Chivers
a,⁎
, Ryan A. Ramasamy
b,c, Mark I. McCormick
b,c, Sue-Ann Watson
b,c,
Ulrike E. Siebeck
d, Maud C.O. Ferrari
ea
Department of Biology, University of Saskatchewan, Saskatoon, SK S7N 5E2, Canada b
ARC Centre of Excellence for Coral Reef Studies, James Cook University, Townsville Qld4811, Australia c
School of Marine and Tropical Biology, James Cook University, Townsville Qld4811, Australia d
School of Biomedical Sciences, University of Queensland, Brisbane Qld4072, Australia e
Department of Biomedical Sciences, WCVM, University of Saskatchewan, Saskatoon, SK S7W 5B4, Canada
H I G H L I G H T S
•We have limited understanding of how long chemical alarm cues persist after release.
•We examined the effect of UV radiation and CO2on persistence offish alarm cues.
•Alarm cues of coral reeffish degrade surprisingly quickly under natural conditions.
•Anthropogenic changes have the potential to change rates of cue degradation.
•Trait-mediated indirect interactions will be altered with a changing climate.
a b s t r a c t
a r t i c l e i n f o
Article history:
Received 27 June 2014
Received in revised form 12 August 2014 Accepted 18 August 2014
Available online 18 September 2014
Editor: C.E.W. Steinberg
Keywords:
Global change Ocean acidification Ultraviolet radiation Risk assessment Alarm cues
Trait-mediated indirect effects
Habitat degradation takes various forms and likely represents the most significant threat to our global biodiversity. Recently, we have seen considerable attention paid to increasing global CO2emissions which lead to ocean acidifi -cation (OA). Other stressors, such as changing levels of ultraviolet radiation (UVR), also impact biodiversity but have received much less attention in the recent past. Here we examine fundamental questions about temporal aspects of risk assessment by coral reef damselfish and provide critical insights into how OA and UVR influence this assess-ment. Chemical cues released during a predator attack provide a rich source of information that other prey animals use to mediate their risk of predation and are the basis of the majority of trait-mediated indirect interactions in aquatic communities. However, we have surprisingly limited information about temporal aspects of risk assess-ment because we lack knowledge about how long chemical cues persist after they are released into the environ-ment. Here, we showed that under ambient CO2conditions (~385μatm), alarm cues of ambon damselfish (Pomacentrus amboinensis) did not degrade within 30 min in the absence of ultraviolet radiation (UVR), but were degraded within 15 min when the CO2was increased to ~905μatm. In experiments that usedfilters to eliminate UVR, we found minimal degradation of alarm cues within 30 min, whereas under ambient UVR conditions, alarm cues were completely degraded within 15 min. Moreover, in the presence of both UVR and elevated CO2, alarm cues were broken down within 5 min. Our results highlight that alarm cues degrade surprisingly quickly under natural conditions and that anthropogenic changes have the potential to dramatically change rates of cue degrada-tion in the wild. This has considerable implicadegrada-tions for risk assessment and consequently the importance of trait-mediated indirect interactions in coral-reef communities.
© 2014 Elsevier B.V. All rights reserved.
1. Introduction
On a global scale, habitat destruction is one of the“Big Five”drivers of biodiversity loss (Anthony et al., 2008; Hoekstra et al., 2005; Rohr et al., 2006; Salo et al., 2007). Loss of habitat, such as that which would occur with deforestation and mining activities, is often a rapid
process with dramatic consequences that are easy to observe. In con-trast, habitat degradation effects are often more subtle, slower to appear and/or harder to detect (Doak, 1995). The ubiquitous nature of habitat degradation and its more subtle effects likely means that it represents our most significant threat to biodiversity. Coral reefs are one of the most impacted and vulnerable ecosystems in the world. Indeed, nearly 30% of the world's coral reef ecosystems have already been destroyed or severely degraded (Goreau et al., 2000) and 60% of them are now facing extinction by 2030 (Carpenter et al., 2008; Wilkinson, 2002).
⁎ Corresponding author.
E-mail address:[email protected](D.P. Chivers).
http://dx.doi.org/10.1016/j.scitotenv.2014.08.059
0048-9697/© 2014 Elsevier B.V. All rights reserved.
Contents lists available atScienceDirect
Science of the Total Environment
Until recently, overfishing and pollution were thought to be the two major drivers of degradation in coral reef ecosystems (Hughes et al., 2003). However, climate change is an ever increasing concern. In particular, ocean acidification (OA) caused by an increase in global emissions of CO2, sulphur oxide (SOx) and nitrogen oxide (NOx), is front and centre, and has been linked to fundamental chemical processes such as metal speciation (Miller and Frank, 2009) and funda-mental biological processes, including metabolism, growth, calcification and reproduction (Fabry et al., 2008; Hassellöv et al., 2013; Kroeker et al., 2010; Widdicombe and Spicer, 2008). Whilst the vast majority of OA work has focused on calcifying organisms, damselfishes have be-come the model system to study OA effects onfishes (Ferrari et al., 2011a, 2011b; Munday et al., 2010). We have considerable evidence thatfishes exposed to elevated CO2have impaired responses to risk cues as a result of cognitive impairment (Chivers et al., 2014; Nilsson et al., 2012). Fish exposed to elevated CO2fail to respond to risk cues and this is associated with higher mortality in the wild (Ferrari et al., 2011a).
Another threat to coral reeffish communities, particularly in the southern hemisphere, stems from stratospheric ozone depletion and its consequences for elevated ultraviolet radiation (UVR). We have seen limited work on understanding the effects of changing UVR in the past decade, likely because UVR is seen as a less pressing threat to our biodiversity. The implementation of the Montreal Protocol in 1989 is often touted by the United Nations as the single most successful inter-national agreement, and has ameliorated much of the global ozone depletion. However, it is difficult to ascertain how consistent ozone recovery will be, due to factors such as changes in cloud cover, air pollutants and aerosols, all of which are influenced by climate change (McKenzie et al., 2011). Compared to 1980, UV-B irradiance towards the end of the 21st century is projected to be lower at mid to high latitudes by between 5 and 20% respectively, and higher by 2–3% in the low latitudes. This means that depending on where an organism lives, it has seen considerable change in UVR and could continue to see substantive changes over the next century. Changes in UVR at a local scale are dramatically influenced by turbidity and dissolved organic carbon, both of which have increased dramatically in costal marine habitats (Wenger and McCormick, 2013).
Our work here addresses fundamental questions about temporal dynamics of risk assessment in coral reeffish and provides critical insights into how both OA and UVR can influence this assessment. Prey animals have numerous sources of information available to assess their risk of predation. However, with each source of information come specific constraints. Visual cues, for example, provide information about risk in real space and time. Prey can judge the size and distance from predators and may even be able to determine the predator's motivation to feed (Murphy and Pitcher, 1997). However, the prey actually needs to be present at the correct time to acquire the information. In contrast, chemical sources of information persist for some time after they are re-leased, and consequently provide information even after the predator has moved on from the area. However, the drawback of this information source is the temporal and spatial disconnect with the source of risk. When a prey animal detects a chemical cue that indicates risk, does it know the age of the cue? Was the cue just recently released or was it released minutes or hours or even days ago? Was the cue released in the exact location where it is being detected or was it released at a considerable distance and transported by air or water currents? There are many hundreds of studies that have investigated the role of chemi-cal information in risk assessment, but we know surprisingly little about temporal aspects of assessment because we have only a rudimentary understanding of how long chemical information sources persist under natural conditions (Chivers et al., 2013; Ferrari et al., 2010; Wisenden and Chivers, 2006). Understanding the availability of those cues to prey species is crucial to understanding community dynamics. Chemical cues are often the basis of trait-mediated indirect interactions, which are quantitatively much more important than the direct
consumptive effects of predators (Preisser et al., 2005). The detection of risk-related chemicals has been shown to mediate many inducible morphological defences, the timing of crucial ontogenetic switches, and changes in life-history strategies, affecting growth rate, age at maturation and a number of reproductive traits (Appleton and Palmer, 1988; Brönmark and Miner, 1992; Chivers et al., 2001; Hoverman et al., 2005). They also mediate the expression of antipredator behav-iours, as seen in habitat and food preference and mate choice (Lima, 1998; Stankowich and Blumstein, 2005). Any factors that will affect the availability of these cues in the medium will also affect the number of individuals that will detect and respond to these cues, with dramatic implications for the existence, type, strength of many trait-mediated in-direct interactions (Ferrari et al., 2010).
There are several sources of chemical information available to prey for risk assessment, including predator odours, cues from injured con-specifics or heterospecifics (alarm cues), and disturbance cues released from prey that have been disturbed by predators (Ferrari et al., 2010; Kats and Dill, 1998; Vavrek et al., 2008; Wisenden et al., 1995). From a temporal risk perspective, we know that some predator odour cues may last for upwards of several days (Fraker, 2009; Peacor, 2006), whilst alarm cues may last for hours (Wisenden et al., 2009) or may be degraded within 30 min (Chivers et al., 2013; Ferrari et al., 2007b). Chivers et al. (2013)were thefirst to document that the rate of degrada-tion of alarm cues, as measured by the response offish to the degraded cues (fish bioassay), was dependent on time of day. They showed that alarm cue breakdown in ambon damselfish (Pomacentrus amboinensis) occurred within 30 min in mid-afternoon, but both early and late in the day, the cues remained active for greater than this length of time. Peak breakdown of cues early in the afternoon suggests that UVR, or other abiotic factors (temperature, dissolved oxygen, pH, etc.) thatfluctuate on a daily basis, may facilitate the degradation process. Moreover, microbial activity in the water column and in the sand may peak in early afternoon leading to faster degradation.
Here, we provide thefirst empirical test of factors responsible for variation in the rate of breakdown of chemical alarm cues and address how anthropogenic change influences rates of breakdown. This informa-tion will allow us to understand temporal dynamics of risk assessment, and even more critically how this assessment may be changing in impact-ed ecosystems. We examinimpact-ed the role of CO2in influencing the rate of breakdown of alarm cues, by supplementing our water with CO2at levels predicted to occur near the end of the century. We also test whether levels of UVR influence the rate of degradation by allowing alarm cues to degrade under natural conditions or under conditions of reduced UVR.
2. Methods
2.1. Fish collection, study species and maintenance
All experiments took place in October and November 2013, at the Lizard Island Research Station, Great Barrier Reef Australia (14°40′S, 145°28′E). We used light traps set at night to capture larval
P. amboinensis, measuring approximately 12–14 mm total length (Meekan et al., 2001). Fish were captured approximately 100 m off the fringing reef at the end of their pelagic phase just prior to settlement to the reef. Fish were taken to the laboratory, held in 25-lflow-through tanks for a minimum of 4 days prior to the start of the experiment and were fed ad libitum with newly hatched brine shrimp three times per day. Thefish grew to approximately 13–16 mm in total length prior to being used as test animals and alarm cue donors in our experiments.
P. amboinensisis a common member of the reef community in the Indo-Pacific and inhabits the edge of the reef amongst patches of sand, live and dead coral. Juveniles sustain high mortality immediately after settlement in large part due to their inability to recognize predators (Hoey and McCormick, 2004; Mitchell et al., 2011). Learning the identity of local predators is facilitated through the coincidence exposure of the
leads to a marked increase in survival of these recently settledfish (Chivers et al., 2014; Lonnstedt et al., 2012).
2.2. Preparation of alarm cues
Alarm cues were prepared in batches by euthanizing 12 donorfish by cold shock and then making a series of 6 vertical cuts along both sides of eachfish. Afterwards thefish were rinsed in 60 ml of water and the resulting solution was added to a plastic pail containing 16 l of seawater and a coral sand substrate (4 cm thick) collected from the ocean. It is somewhat difficult to know whether the amount of alarm cues released during a predator attack matches the concentrations we used in our experiment. Here we added the equivalent of 144 cuts in 16 l of water. Depending on the relative size of the predator and prey, and the size of the predator's mouth, the predator may take several minutes to manipulate and consume the prey (Chivers et al., 1996; Ferrari et al., 2007a). In such a case, there is likely more tissue damage than we used in our experiment (Ferrari et al., 2007a). However, in other cases, the prey may be swallowed with little damage. We used this concentration of alarm cues following the methodology ofChivers et al. (2013), who showed thatP. amboinensisexhibited a strong avoid-ance of this concentration of cues (144 cuts per 16 l). In that study,fish showed weaker, but still significant, avoidance when exposed to 120 or 96 (but not 72) cuts in 16 l.
2.3. Behavioural assay
Our behavioural assay was a slight modification of the methods of Dixson et al. (2010), in whichfish were tested using a 2-channel choice
flume (13 cm × 4 cm). Theflume had a constant gravity-drivenflow of 100 ml min−1per channel throughout all trials. Flow rates were mea-sured using aflow metre and a dye test ensured that the 2 channels exhibited distinct and parallel waterflow, with no turbulence or eddies. Prior to each trial individualfish were isolated in 100 ml plastic jars and left to acclimate for 20 min. Afish was placed into the centre of the downstream end of the choiceflume and acclimated for 2 min. In all cases, juveniles were given a choice in theflume chamber between a water source (seawater) treated with alarm cues and an identical water source without that cue. At the end of the acclimation period, the position of thefish on either side of the chamber was recorded at 5-s intervals for 2 min. The side of theflume receiving the alarm cue solution was changed and 2 min later we again began recording the position of thefish at 5-s intervals for 2 min. We summed the number of times thefish spent on the alarm cue arm of theflume during the 4 min of observations. Eachfish was tested only once.
2.4. Experiment 1: the effects of elevated CO2on alarm cue degradation
The goal of this experiment was to determine whether an elevation in CO2influences the rate of breakdown of alarm cues, as measured by the ability offish to avoid the cues. We prepared multiple batches of fresh alarm cues (a total of 144 cuts from 12 donors in 60 ml of ocean water) and introduced the cues into 16 l buckets that were placed in a water bath (750 l) that had ocean water pumped directly into the bath at a rate of 6 l/min. The water bath ensured that the temperature profile of the pails was similar to that of ambient ocean water at the time of testing. Our protocol consisted of adding the alarm cue solution to the pails and then gently stirring the water to ensure the stimulus was evenly dispersed. We then immediately removed approximately 4 l of water for behavioural trials. We also removed the same amount of water from an adjacent water pail that did not contain alarm cues, to use as the other water source in the 2-choiceflume. At 30 min post-injection, an additional 4 l of water was also removed from each of the pails. By comparing the intensity of behavioural response of a
fish at 0 and at 30 min we could assess whether the alarm cues had broken down. Thirty minutes was chosen as the endpoint because
Chivers et al. (2013)suggest that alarm cues ofP. amboinensismay breakdown within this time.
In this experiment we manipulated the level of dissolved CO2by dosing seawater with 100% CO2to a set pH, following standard techniques (Gattuso et al., 2010). Seawater was pumped from the ocean into 2 × 60 l tanks where it was diffused with ambient air (control) or CO2to achieve the desired pH (elevated-CO2 treatment). A pH-controller (Aqua Medic, Germany) attached to the CO2treatment tank maintained pH at the desired level. A powerhead in the tank rapidly dis-solved CO2into the seawater and also served as a vigorous stirrer. Control or elevated-CO2seawater was used tofill pails of water for immediate use in the experiment. Seawater pHNBS (SevenGo Pro, Mettler-Toledo, Switzerland) and temperature were recorded in each pail at the begin-ning and end of each 30 min trial. CO2(inμatm) was calculated in CO2SYS using total alkalinity data determined from analysis of water samples by Gran titration (888 Titrando, Metrohm, Switzerland) to with-in 1% of certified reference material (Prof. A. Dickson, Scripps Institution of Oceanography). We testedfish under 2 different CO2conditions, equiv-alent to 385μatm (ambient) or 905μatm (elevated). There were 11 rep-licates per treatment and nofish was used more than once. The partial pressure of CO2(pCO2) on coral reefsfluctuates on a daily basis due the net effects of photosynthesis, respiration and calcification (Gagliano et al., 2010; Ohde and van Woesik, 1999; Shamberger et al., 2011; Shaw et al., 2013) and can increase several hundredμatm on a daily basis (Shamberger et al., 2011). We chose a concentration of 905 μatm CO2because it nearly matches the current end of the century CO2projections (Collins et al., 2013; Meinshausen et al., 2011) and approaches what somefish could experience at night in a shallow reef environment or a reef matrix. We conducted this experiment between 1700 and 1900 h in order to minimize UVR, given that UVR could be one of the most important variables influencing the rate of degradation. There was no direct sunlight hitting the pails at this time.
2.5. Experiment 2: the effects of UVR on alarm cue degradation
The goal of this experiment was to determine whether UVR infl u-ences the rate of breakdown of alarm cues. Our experiment took place using the same general protocol as experiment 1. We manipulated UVR by covering both the alarm cue and control seawater pails with a 2 mm thick Lexan polycarbonate sheet (SABIC Innovative Plastics, Indiana, USA). We contrasted the response of thefish to water taken from pails with reduced UV to pails that were open on the top and had exposure to ambient UVR. The Lexan sheet did not influence the temperature of the water (see results section). The experimental testing occurred in a shaded location to avoid further break down of chemical cues once the subsample of water had been removed from the pail for testing. We conducted 10–11 trials per treatment, all between 1100 and 1400 each day, alternating the start of UV and reduced-UV trials each day. We did not have access to a photometer during all of the trials, and hence did not have the ability to determine the specific levels of solar radiation for each trial. However, all days were free of all but sporadic cloud cover. We measured the irradiance levels using a 200 micron cable and irradiance probe attached to a Jaz spectropho-tometer (Ocean Optics, Florida, USA). We took a total of 10 replicate measures in the presence and absence of thefilter to provide an average irradiance values.
2.6. Experiment 3: the interactive effects of UVR and CO2on alarm cue
degradation
previous experiments except that we eliminated the time zero testing, given that we had established thatfish show strong avoidance of alarm cues at time zero, and instead collected data at 5 min post-injection and again at 15 min post-injection. This was done in an attempt to tease apart any interactive effects of UV and CO2. We completed between 9 and 10 trials per treatment.
2.7. Statistical analysis
Analyses of temperature, pH and pCO2 were carried out with multiway ANOVAs, to investigate the change in the physico-chemical properties of the water under different experimental conditions. Whilst measurements were taken in both the water pail and the alarm cue pail, the addition of alarm cues did not affect any of the variables (PN0.9 for all analyses and all variables), so pail was not reported. The results re-ported were taken from the pails containing the alarm cues only.
The number of scans (out of 48 scans) that thefish spent on the alarm cue (AC) side of theflume was computed into a proportion time spent on the alarm cue side (#scanAC/48). This variable was used as raw data in subsequent analyses. For each experiment, we used multiway ANOVAs to investigate the effect of UV and/or elevated CO2 levels at different degradation times. To investigate if thefish signifi -cantly avoided the AC side of theflume, the response variable was com-pared to the 0.5 predicted value for no avoidance (thefish spent 50% of their time in the AC side, meaning they did not significantly avoid the arm) using a one-samplet-test. Data met all assumptions of parametric analyses.
3. Results
3.1. Experiment 1: the effects of elevated CO2on alarm cue degradation
There was no difference in temperature between CO2treatments (F1,29= 0.3,P= 0.6) or between sampling times (F1,29= 0.1,P= 0.8). No interaction were found between CO2and time (F1,29= 0.1,P= 0.8). However, there was a significant effect of CO2treatment on both pH
(F1,29= 920,Pb0.001) and pCO2(F1,29= 660,Pb0.001), but not on time (F1,29= 0.5 and 0.4 respectively, bothPN0.4), nor was there any in-teraction between CO2and time on those two variables (F1,29= 0.1 and 0.1 respectively, bothPN0.7—Table 1).
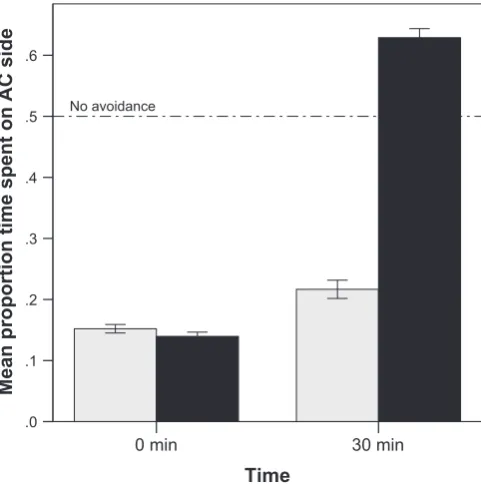
The 2-way ANOVA revealed a significant interaction between time and CO2(F1,40= 361,Pb0.001,Fig. 1) on alarm cue potency, as indicated by the avoidance response of thefish. At time 0, CO2has no effect on the alarm cue potency (F1,20= 0.8,P= 0.37), but after 30 min, the alarm cue in elevated CO2was much more degraded than that in ambient CO2 (F1,20= 584,Pb0.001). In fact, after 30 min, the alarm cue did not elicit any avoidance, as the avoidance value does not differ from 0.5 (one-samplet-test:t10= 0.97,P= 0.36).
3.2. Experiment 2: the effects of UVR on alarm cue degradation
Our irradiance measurements confirmed that the Lexan sheets removed almost all radiation below 400 nm (seeFig. 2).
Table 1
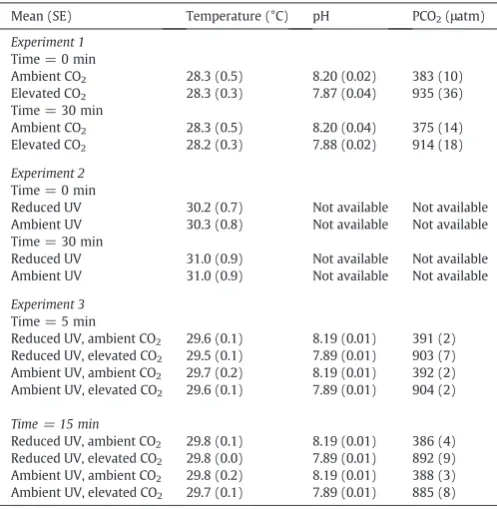
Water quality parameters measured during each of the three experiments. Values are expressed as means (±SE).
Mean (SE) Temperature (°C) pH PCO2(μatm) Experiment 1
Time = 0 min
Ambient CO2 28.3 (0.5) 8.20 (0.02) 383 (10)
Elevated CO2 28.3 (0.3) 7.87 (0.04) 935 (36)
Time = 30 min
Ambient CO2 28.3 (0.5) 8.20 (0.04) 375 (14)
Elevated CO2 28.2 (0.3) 7.88 (0.02) 914 (18) Experiment 2
Time = 0 min
Reduced UV 30.2 (0.7) Not available Not available Ambient UV 30.3 (0.8) Not available Not available Time = 30 min
Reduced UV 31.0 (0.9) Not available Not available Ambient UV 31.0 (0.9) Not available Not available
Experiment 3
Time = 5 min
Reduced UV, ambient CO2 29.6 (0.1) 8.19 (0.01) 391 (2)
Reduced UV, elevated CO2 29.5 (0.1) 7.89 (0.01) 903 (7)
Ambient UV, ambient CO2 29.7 (0.2) 8.19 (0.01) 392 (2)
Ambient UV, elevated CO2 29.6 (0.1) 7.89 (0.01) 904 (2)
Time = 15 min
Reduced UV, ambient CO2 29.8 (0.1) 8.19 (0.01) 386 (4)
Reduced UV, elevated CO2 29.8 (0.0) 7.89 (0.01) 892 (9)
Ambient UV, ambient CO2 29.8 (0.2) 8.19 (0.01) 388 (3)
Ambient UV, elevated CO2 29.7 (0.1) 7.89 (0.01) 885 (8)
Time
30 min
0 min
Mean proportion time spent on AC side
.6
.5
.4
.3
.2
.1
.0
No avoidance
Fig. 1.Mean (±SE) proportion of time spent in the alarm cue arm of the choiceflume for
fish exposed to ambient (grey bars) or elevated CO2(black bars). Experiments were
com-pleted late in the day when UVR is at a minimum.
0 20 40 60 80 100 120 140
300 400 500 600 700 800
Irr
adiance µW/
cm
2
/s
Wavelength (nm)
UV
Natural spectrumFiltered spectrum
Analyses of temperature revealed a significant increase of tempera-ture between time 0 and time 30 min (F1,30= 5.6,P= 0.024), but no effect of UVR (F1,30= 0.1,P= 0.8), nor any UVR by time interaction (F1,30= 0.1,P= 0.9). Temperature increased from 30.3 °C (±0.7–SD) to 31.0 °C (±0.9) in 30 min (Table 1). We did not have access to equip-ment to measure pH and pCO2during this experiment.
The 2-way ANOVA revealed a significant interaction between UVR and time (F1,37= 321,Pb0.001,Fig. 3). At time 0, the potency of alarm cue was the same, regardless of the level of UV (F1,18= 1.6,
P= 0.22). After 30 min, however, the alarm cue maintained under the UVR filter was much more potent than that exposed to UVR (F1,18= 382,Pb0.001). Unlike with CO2, the alarm cue became somewhat attractive after 30 min, withfish spending significantly more time in the alarm cue arm of theflume (one-samplettest:
t10= 8.7,Pb0.001).
3.3. Experiment 3: the interactive effects of UVR and CO2on alarm cue
degradation
The 3-way ANOVA indicated a significant effect of time on tempera-ture (F1,35= 15.5,Pb0.001), pH (F1,35= 9.4,P= 0.004) and pCO2 (F1,35= 7.7,P= 0.009); the water warmed up 0.2 °C (from 29.6 °C to 29.8 °C, SE = 0.03) in 10 min, average pH raised less than 0.01 unit (from 8.038 to 8.044, SE = 0.001) and average pCO2went from 647 to 637μatm (SE = 2.6—seeTable 1for more details). As predicted, CO2 treatment affected pH and pCO2 (both F1,35N2000,Pb0.001), but did not affect water temperature (F1,35= 1.2,P= 0.3). For the three vari-ables, we failed tofind any effect of UV (all F1,35b0.1, allPN0.7), or any 2-way or 3-way interactions between CO2, UV and time (allPN0.2). The 3-way ANOVA revealed a 3-way interaction amongst time, UV and CO2on the potency of the alarm cues (F1,64= 22.1,Pb0.001, Fig. 4). After 15 min, we found an interaction between UV and CO2 (F1,29= 17.4,Pb0.001). In conditions of reduced UV and ambient CO2, the alarm cue was still potent, whilst the addition of UV, CO2or both re-duced the alarm cues' potency to a similar level (no difference amongst the 3 groups: F2,22= 2.0,P= 0.16). When each group was compared to the no-avoidance level, we found thatfish exposed to alarm cues degrading with either factor still showed some avoidance (one-sample
t-test: UV:t8=−3.1,P= 0.015; CO2:t8=−2.4,P= 0.049), whilst fish exposed to cues degrading with both factors did not significantly avoid the alarm cue side (one-samplet-test:t7= 2.7,P= 0.8).
After 5 min, there was no interaction between CO2and UV on the potency of alarm cues (F1,35= 2.6,P= 0.12,Fig. 4), but both an increase in CO2(F1,35= 291,Pb0.001) and UV (F1,35= 110,Pb0.001) reduced the potency of alarm cues, with increased CO2alone reducing the po-tency more than the presence of UV alone (post-hoc test,P= 0.001). When both factors were present, the alarm cues were completely de-graded in that time period, withfish spending equal time in either arm of theflume (one-samplet-test:t8=−1.3,P= 0.23).
4. Discussion
We know very little about temporal dynamics of prey risk assessment using chemosensory information because we have minimal information about the rate at which chemical cues degrade under natural conditions. The results of our study demonstrate that degradation can be surprisingly quick under natural conditions and changes in ocean chemistry and UV radiation have the potential to dramatically influence temporal dynamics of risk assessment infishes.
Ourfirst experiment showed that elevated CO2increased alarm cue breakdown. Under ambient CO2, alarm cues remained active for 30 min, whilst under elevated CO2, there was no avoidance of the cues at the 30 min point. This experiment was completed late in the day, under conditions of minimal UVR. Experiment 3 revealed that the cues actually broke down faster (within 15 min in the absence of UVR). The mechanism responsible for this CO2effect is unknown. We added alarm cues to the pail with CO2water and mixed the water. Water immediately taken from the pail caused an antipredator response in the damselfish, indicat-ing that there was no immediate chemical reaction that deactivated the alarm cue. In freshwater systems, alarm cues of Atlantic salmon (Salmo salar) can be immediately deactivated by a drop in pH to 6.4 (Leduc et al., 2008) and alarm cues of woodfrog tadpoles (Lythobates slyvatica) can be immediately deactivated upon mixing with agricultural pesticides (Moore, Chivers and Ferrari unpub data). If degradation occurred through a chemical reaction, then that reaction was rather slow, perhaps taking up to 15 min. Another possibility is that the change in CO2caused a change in
Time
30 min
0 min
Mean proportion time spent on AC side
.6
.5
.4
.3
.2
.1
.0
No avoidance
Fig. 3.Mean (±SE) proportion of time spent in the alarm cue arm of the choiceflume for
fish exposed to ambient (black bars) or reduced UVR (grey bars). Experiments were com-pleted during mid-day when UVR is at its peak.
Mean proportion time spent on AC side
.6
.5
.4
.3
.2
.1
.0
Ambient UV
Reduced UV
.6
.5
.4
.3
.2
.1
.0
Time
5 min
15 min
No avoidance
Fig. 4.Mean (±SE) proportion of time spent in the alarm cue arm of the choiceflume for
thefish's perception of the cues. In this study we usedfish as a bioassay tool and relied on their behavioural response to determine whether the cues had degraded. A change in thefish's perception seems unlikely given thatMunday et al. (2010)have shown that it takes 2 days for damselfish exposed to this level of CO2to exhibit an impaired response to chemosensory cues. In our experimentfish were exposed to CO2 water for 2 min prior to the start of our data collection. Perhaps a more likely explanation for CO2affecting degradation was that the change affected the biofauna in the sand and water column and this biotic-mediated effect was responsible for changing the rate of breakdown.
Our work has clear implications for researchers trying to understand the effects of OA on reef communities. We know that ocean acidification dramatically changes predation rates in mesocosm experiments (Ferrari et al., 2011b) and that impaired responses to alarm cues have been im-plicated as one of the major causes of such effects (Ferrari et al., 2011a). The 905μatm CO2we used in this experiment matches projected end of century climate change scenarios (Collins et al., 2013; Meinshausen et al., 2011). However, even without any anthropogenic increases in
pCO2, our work suggests that the rate of breakdown of alarm cues would vary dramatically over the course of the day, given thatpCO2 on coral reefsfluctuates on a daily basis due the net effects of photosyn-thesis, respiration and calcification (Gagliano et al., 2010; Ohde and van Woesik, 1999; Shamberger et al., 2011; Shaw et al., 2013). The fastest rate of breakdown of alarm cues would likely occur just before dawn when thepCO2is at its highest. ThepCO2on reefs can increase several hundredμatm overnight (Shamberger et al., 2011); however, the mag-nitude of thefluctuations will be dependent on tidal cycles, as well as water depth and coral type.Shaw et al. (2013)predict that reefflats on the Great Barrier Reef could hit 2100μatm by the turn of the century. This means that the rate of alarm cue breakdown will be temporally and spatially variable, adding considerable complexity to temporal risk assessment using chemosensory information.
In our second experiment we saw evidence that UVR is a major driver of alarm cue breakdown during the day. In the ambient UVR exposure group,fish showed a strong avoidance of alarm cues at time 0, but when the cues had aged for 30 min, there was no longer avoidance of the cues. This is in stark contrast to the reduced UV treatment. In these trials we observed significant avoidance of the alarm cue arm of the
flume at 30 min, thereby demonstrating that UVR was necessary for the breakdown of cues over this time period. In experiment 3 we docu-mented that breakdown of alarm cues actually occurred within 15 min in the presence of UVR. A rather surprisingfinding in our study was the slight attraction for the alarm cue side of theflume at 30 min in experiment 1. This may indicate that in the absence of alarm cues, the odour of skin contains chemical constituents that are attractive tofish. They may be using amino acids as a means to locate potential food sources.
Given that UVR appears to be a major driver of alarm cue breakdown, we can easily imagine that the temporal dynamics of risk assessment may vary naturally with changes in water depths, time of the day, and season and will even vary with the weather conditions (i.e. cloud cover) on any given day. Anthropogenic change would add to this natural variation. Indeed, any factor that influences UV exposure may influence breakdown of alarm cues. For example, we have seen a tremendous increase in disturbance to costal marine habitats and with that there have been con-siderable increases in turbidity and dissolved organic carbon both of which are associated with a reduction in UVR (Wenger and McCormick, 2013). Over the past several decades we have seen considerable decreases in ozone depletion, particularly in the southern hemisphere (Smith et al., 1992). This raises the question about whether there has been an increase in the rate of breakdown of alarm cues that has accom-panied this change in UVflux. Has the temporal aspects of risk assess-ment in damselfish changed over the past several decades? Major changes in UVflux are expected to occur by the end of the 21st century: depending on latitude, UVR is projected to be anywhere from 3% higher to 20% lower than its peak in the 1980s (McKenzie et al., 2011).
Damselfishes are amongst the most commonfishes on coral reefs and have a wide geographical distribution. Depending on where they live, the UVR they received in recent decades and what they will experience in the future is somewhat unclear. With so much anthropogenic change in UVflux, and a scientific community that has virtually abandoned re-search on UVR, we suggest that future experiments will need to examine how the magnitude of these natural and anthropogenic changes in UVR affects organisms. Our results provide clear evidence that temporal risk assessment will be seriously impacted.
In addition to providing morefine-tuned quantification of degrada-tion times, our third experiment revealed the interactive effects of UV and CO2.We have clear evidence that if UVR levels are maintained at current levels andpCO2increases we will have much faster deactivation of alarm cues in oceans in the future. Alarm cue deactivation was much faster in the presence of ambient UV and elevated CO2than in the other treatments. The increased rate of deactivation could have serious con-sequences for risk assessment and ultimately the stability of preda-tor–prey interactions.
Despite the fact there are only a handful of studies that have exam-ined the temporal aspects of chemosensory risk assessment, we see tre-mendous variation in scale. For example,Fraker (2009)concluded that greenfrog (Rana clamitans) tadpoles responded to cues of dragonfly pred-ators aged up to 48 h but not 72 h. Likewise,Peacor (2006)found that the time period that bullfrogs (Rana catesbeiana) responded to odours of predatory larval dragonflies (Anax junius) was in the order of 2–4 days. Hazlett (1999)showed that alarm cues of crayfish (Orconectes virilis) can be detectable by conspecifics for more than 6 hours. Likewise, Wisenden et al. (2009)demonstrated that alarm cues of amphipods (Gammarus lacustris) and freshwaterfish (fathead minnows, Pimephales promelas) may last at least 3 h but not more than 6 h. Finally, alarm cues of frogs last between 5 min and 2 h, and damselfish alarm cues last no longer than 15 to 30 min [this study andChivers et al. (2013)]. Much of the research aimed at understanding temporal dynamics of risk assessment have suffered from a lack of ecological realism in that they have examined the rate of cue breakdown under conditions where natural photodegradation and biodegradation would be minimal. Inter-estingly, the 4 exceptions [this study,Chivers et al. (2013),Ferrari et al. (2007b)andWisenden et al. (2009)] show the shortest degradation times. We need to insist that future studies of temporal risk assessment be conducted under natural conditions where alarm cues are exposed natural solar radiation and temperature along with substrates and water sources that allow natural biodegradation. Even subtle changes from natural conditions could influence rates of breakdown of chemical cues. For example,Peacor (2006)showed that the rate of breakdown of dragonfly odour was much faster in pond water than ground water.
Our experiments were completed at ambient temperature condi-tions, but we saw a bit of variation between experiments that corre-spond with changes in ocean temperature. With oceans expected to increase by 3 °C by the end of the next century (Collins et al., 2013), understanding the effect of temperature on chemical information is a logical extension of our current work. Future experiments need to consider temporal aspects of risk assessment in order to gain a full ap-preciation of the importance of chemical sources of information. We have seen surprisingly quick degradation of cues in our study. If we add dilution effects that are caused by water currents to this fast degra-dation process, we may end up concluding that the long held assump-tion that chemical cues are long lasting indicators of risk is blatantly false. In some cases, chemicals cues may indicate risk to prey in real time, much like visual cues.
trophic chain (Preisser et al., 2005). In ecosystems such as coral reefs, a number of anthropogenic factors has threatened or already altered the trophic balance in the communities, and these fragile ecosystems have seen the emergence of meso-predator release following the extirpation of top predators (Estes et al., 2011). Our study provides further evidence that climate change and pollution are potentially co-driving these alter-ations in the structure of aquatic ecosystems.
Acknowledgements
Funding was provided to MF and DC from the Natural Sciences and Engineering Council of Canada, to MF, DC and MM from the Australian Research Council and to MM from the ARC Centre of Excellence for Coral Reef Studies. DC, MF and MM conceived the study. RR, MF and DC conducted the experiment, S-AW and US analysed CO2and UV levels, MF analysed the behavioural data, and DPC and MF wrote the
first draft of paper. All authors commented on thefinal version of the paper.
References
Anthony KRN, Kline DI, Diaz-Pulido G, Dove S, Hoegh-Guldberg O.Ocean acidification causes bleaching and productivity loss in coral reef builders. Proc Natl Acad Sci U S A 2008;105:17442–6.
Appleton RD, Palmer AR.Water-borne stimuli released by predatory crabs and damaged prey induce more predator-resistant shells in a marine gastropod. Proc Natl Acad Sci U S A 1988;85:4387–91.
Brönmark C, Miner JG.Predator-induced phenotypical change in body morphology in crucian carp. Science 1992;258:1348–50.
Carpenter KE, Abrar M, Aeby G, Aronson RB, Banks S, Bruckner A, et al.One-third of reef-building corals face elevated extinction risk from climate change and local impacts. Science 2008;321:560–3.
Chivers DP, Brown GE, Smith RJF.The evolution of chemical alarm signals: attracting predators benefits alarm signal senders. Am Nat 1996;148:649–59.
Chivers DP, Kiesecker JM, Marco A, DeVito J, Anderson MT, Blaustein AR. Predator-induced life history changes in amphibians: egg predation induces hatching. Oikos 2001;92:135–42.
Chivers DP, Dixson DL, White JR, McCormick MI, Ferrari MCO.Degradation of chemical alarm cues and assessment of risk throughout the day. Ecol Evol 2013;3:3925–34.
Chivers DP, McCormick MI, Nilsson GE, Munday PL, Watson S-A, Meekan MG, et al.
Impaired learning of predators and lower prey survival under elevated CO2: a conse-quence of neurotransmitter interference. Glob Chang Biol 2014;20:515–22.
Collins M, Knutti R, Arblaster J, Dufresne J-L, Fichefet T, Friedlingstein P, et al.Long-term climate change: projections, commitments and irreversibility; 2013.
Dixson DL, Munday PL, Jones GP.Ocean acidification disrupts the innate ability offish to detect predator olfactory cues. Ecol Lett 2010;13:68–75.
Doak DF.Source‐sink models and the problem of habitat degradation: general models and applications to the Yellowstone grizzly. Conserv Biol 1995;9:1370–9.
Estes JA, Terborgh J, Brashares JS, Power ME, Berger J, Bond WJ, et al.Trophic downgrading of planet earth. Science 2011;333:301–6.
Fabry VJ, Seibel BA, Feely RA, Orr JC.Impacts of ocean acidification on marine fauna and ecosystem processes. ICES J Mar Sci 2008;65:414–32.
Ferrari MCO, Brown MR, Pollock MS, Chivers DP.The paradox of risk assessment: comparing responses of fathead minnows to capture-released and diet-released alarm cues from two different predators. Chemoecology 2007a;17:157–61.
Ferrari MCO, Messier F, Chivers DP.Degradation of chemical alarm cues under natural conditions: risk assessment by larval woodfrogs. Chemoecology 2007b;17:263–6.
Ferrari MCO, Wisenden BD, Chivers DP.Chemical ecology of predator–prey interactions in aquatic ecosystems: a review and prospectus. Can J Zool 2010;88:698–724.
Ferrari MCO, Dixson DL, Munday PL, McCormick MI, Meekan MG, Sih A, et al.Intrageneric variation in antipredator responses of coral reeffishes affected by ocean acidification: implications for climate change projections on marine communities. Glob Chang Biol 2011a;17:2980–6.
Ferrari MCO, McCormick MI, Munday PL, Meekan MG, Dixson DL, Lonnstedt O, et al.
Putting prey and predator into the CO2equation—qualitative and quantitative effects of ocean acidification on predator–prey interactions. Ecol Lett 2011b;14:1143–8.
Fraker ME.Perceptual limits to predation risk assessment in green frog (Rana clamitans) tadpoles. Behaviour 2009;146:1025–36.
Gagliano M, McCormick MI, Moore JA, Depczynski M.The basics of acidification: baseline variability of pH on Australian coral reefs. Mar Biol 2010;157:1849–56.
Gattuso J-P, Kunshan G, Lee K, Rost B, Schulz KG.Approaches and tools to manipulate the carbonate chemistry. In: Riebesell U, Fabry VJ, Hansson L, Gattuso J-P, editors. Guide to best practices for ocean acidification research and data reporting. Luxembourg: Publications Office of the European Union; 2010.
Goreau T, McClanahan T, Hayes R, Strong A.Conservation of coral reefs after the 1998 global bleaching event. Conserv Biol 2000;14:5–15.
Hassellöv I-M, Turner DR, Lauer A, Corbett JJ.Shipping contributes to ocean acidification. Geophys Res Lett 2013;40:2731–6.
Hazlett BA.Responses to multiple chemical cues by the crayfishOrconectes virilis. Behaviour 1999;136:161–77.
Hoekstra JM, Boucher TM, Ricketts TH, Roberts C.Confronting a biome crisis: global disparities of habitat loss and protection. Ecol Lett 2005;8:23–9.
Hoey AS, McCormick MI.Selective predation for low body condition at the larval–juvenile transition of a coral reeffish. Oecologia 2004;139:23–9.
Hoverman JT, Auld JR, Relyea RA.Putting prey back together again: integrating predator-induced behaviour, morphology and life history. Oecologia 2005;144:481–91.
Hughes TP, Baird AH, Bellwood DR, Card M, Connolly SR, Folke C, et al.Climate change, human impacts, and the resilience of coral reefs. Science 2003;301:929–33.
Kats LB, Dill LM.The scent of death: chemosensory assessment of predation risk by prey animals. Ecoscience 1998;5:361–94.
Kroeker KJ, Kordas RL, Crim RN, Singh GG.Meta-analysis reveals negative yet variable effects of ocean acidification on marine organisms. Ecol Lett 2010;13:1419–34.
Leduc A, Lamaze FC, McGraw L, Brown GE.Response to chemical alarm cues under weakly acidic conditions: a graded loss of antipredator behaviour in juvenile rainbow trout. Water Air Soil Pollut 2008;189:179–87.
Lima SL.Stress and decision making under the risk of predation: recent developments from behavioral, reproductive, and ecological perspectives. Stress Behav 1998;27:215–90.
Lonnstedt OM, McCormick MI, Meekan MG, Ferrari MCO, Chivers DP.Learn and live: predator experience and feeding history determines prey behaviour and survival. Proc R Soc B Biol Sci 2012;279:2091–8.
McKenzie RL, Aucamp PJ, Bais AF, Björn LO, Ilyas M, Madronich S.Ozone depletion and climate change: impacts on UV radiation. Photochem Photobiol Sci 2011; 10:182–98.
Meekan MG, Wilson SG, Halford A, Retzel A.A comparison of catches offishes and inverte-brates by two light trap designs, in tropical NW Australia. Mar Biol 2001;139:373–81.
Meinshausen M, Smith SJ, Calvin K, Daniel JS, Kainuma MLT, Lamarque JF, et al.The RCP greenhouse gas concentrations and their extensions from 1765 to 2300. Clim Change 2011;109:213–41.
Miller O, Frank J.Effect of ocean acidification on the speciation of metals in seawater. Oceanography 2009;22:72.
Mitchell MD, McCormick MI, Ferrari MCO, Chivers DP.Coral reeffishes rapidly learn to identify multiple unknown predators upon recruitment to the reefs. PLoS ONE 2011;6:e15764.
Munday PL, Dixson DL, McCormick MI, Meekan M, Ferrari MCO, Chivers DP.Replenishment offish populations is threatened by ocean acidification. Proc Natl Acad Sci U S A 2010; 107:12930–4.
Murphy KE, Pitcher TJ.Predator attack motivation influences the inspection behaviour of European minnows. J Fish Biol 1997;50:407–17.
Nilsson GE, Dixson DL, Domenici P, McCormick MI, Sorensen C, Watson S-A, et al.
Near-future CO2levels alterfish behaviour by interfering with neurotransmitter function. Nat Clim Chang 2012;2:201–4.
Ohde S, van Woesik R.Carbon dioxideflux and metabolic processes of a coral reef, Okinawa. Bull Mar Sci 1999;65:559–76.
Peacor SD.Behavioural response of bullfrog tadpoles to chemical cues of predation risk are affected by cue age and water source. Hydrobiologia 2006;573:39–44.
Preisser EL, Bolnick DI, Benard MF.Scared to death? The effects of intimidation and consumption in predator–prey interactions. Ecology 2005;86:501–9.
Rohr JR, Kerby JL, Sih A.Community ecology as a framework for predicting contaminant effects. Trends Ecol Evol 2006;21:606–13.
Salo P, Korpimäki E, Banks PB, Nordström M, Dickman CR.Alien predators are more dangerous than native predators to prey populations. Proc R Soc B Biol Sci 2007; 274:1237–43.
Shamberger KEF, Feely RA, Sabine CL, Atkinson MJ, DeCarlo EH, Mackenzie FT, et al.
Calcification and organic production on a Hawaiian coral reef. Mar Chem 2011; 127:64–75.
Shaw EC, McNeil BI, Tilbrook B, Matear R, Bates ML.Anthropogenic changes to seawater buffer capacity combined with natural reef metabolism induce extreme future coral reef CO2conditions. Glob Chang Biol 2013;19:1632–41.
Smith RC, Prezelin BB, Baker KS, Bidigare RR, Boucher NP, Coley T, et al.Ozone depletion: ultraviolet-radiation and phytoplankton biology in antarctic waters. Science 1992; 255:952–9.
Stankowich T, Blumstein DT.Fear in animals: a meta-analysis and review of risk assessment. Proc R Soc B Biol Sci 2005;272:2627–34.
Vavrek MA, Elvidge CK, DeCaire R, Belland B, Jackson CD, Brown GE.Disturbance cues in freshwater preyfishes: do juvenile convict cichlids and rainbow trout respond to ammonium as an‘early warning’signal? Chemoecology 2008;18:255–61.
Wenger AS, McCormick MI.Determining trigger values of suspended sediment for behavioural changes in a coral reeffish. Mar Pollut Bull 2013;70:73–80.
Widdicombe S, Spicer JI.Predicting the impact of ocean acidification on benthic biodiversity: what can animal physiology tell us? J Exp Mar Biol Ecol 2008;366:187–97.
Wilkinson C.Status of coral reefs of the worldIn: Science AIoM, editor. 2002. [Townsville, Australia].
Wisenden BD, Chivers DP.The role of public chemical information in antipredator behaviour. In: Ladich F, Collin SD, Moller P, Kapoor PG, editors. Communication infishes. New-Jersey: Science Publishers; 2006. p. 259–78.
Wisenden BD, Chivers DP, Smith RJF.Early warning in the predation sequence—a disturbace pheromone in Iowa darters (Etheostoma exile). J Chem Ecol 1995;21: 1469–80.