www.ann-geophys.net/27/3691/2009/
© Author(s) 2009. This work is distributed under the Creative Commons Attribution 3.0 License.
Annales
Geophysicae
Aerosol and rainfall variability over the Indian monsoon region:
distributions, trends and coupling
R. Gautam1,2, N. C. Hsu2, K.-M. Lau2, and M. Kafatos3
1Goddard Earth Science and Technology Center, University of Maryland Baltimore County, Baltimore, MD 21228, USA 2Laboratory for Atmospheres, NASA Goddard Space Flight Center, Greenbelt, MD 20771, USA
3Center of Excellence in Earth Observing, Schmid College of Science, Chapman University, Orange, CA 92866, USA
Received: 30 March 2009 – Revised: 23 July 2009 – Accepted: 7 September 2009 – Published: 30 September 2009
Abstract. Aerosol solar absorption over the Indian soon region has a potential role of modulating the mon-soon circulation and rainfall distribution as suggested by re-cent studies based on model simulations. Prior to the on-set of the monsoon, northern India is influenced by signif-icant dust transport that constitutes the bulk of the regional aerosol loading over the Gangetic-Himalayan region. In this paper, a multi-sensor characterization of the increasing pre-monsoon aerosol loading over northern India, in terms of their spatial, temporal and vertical distribution is presented. Aerosol transport from the northwestern arid regions into the Indo-Gangetic Plains and over the foothills of the Hi-malayas is found to be vertically extended to elevated alti-tudes (up to 5 km) as observed from the space-borne lidar measurements (CALIPSO). In relation with the enhanced pre-monsoon aerosol loading and the associated solar ab-sorption effects on tropospheric temperature anomalies, this paper investigates the monsoon rainfall variability over India in recent past decades from an observational viewpoint. It is found that the early summer monsoon rainfall over India is on the rise since 1950s, as indicated by historical rainfall data, with over 20% increase for the period 1950–2004. This large sustained increase in the early summer rainfall is led by the observed strengthening of the pre-monsoon tropospheric land-sea thermal gradient over the Indian monsoon region as indicated by microwave satellite measurements (MSU) of tropospheric temperatures from 1979–2007. Combined anal-ysis of changes in tropospheric temperatures and summer monsoon rainfall in the past three decades, suggest a future possibility of an emerging rainfall pattern of a wetter mon-soon over South Asia in early summer followed by a drier period.
Correspondence to: R. Gautam (ritesh.gautam@nasa.gov)
Keywords. Atmospheric composition and structure (Aerosols and particles; Pollution – urban and regional) – Meteorology and atmospheric dynamics (Precipitation)
1 Introduction
The INDOEX field campaign was particularly successful in recognizing the importance of aerosols over the surround-ing oceanic regions off the subcontinent. Prior to the IN-DOEX, several studies of aerosol characterization in the form of field experiments have also been conducted in southern In-dia as part of the InIn-dian Space Research Organization (ISRO) Indian Middle Atmosphere Program (Krishnamoorthy et al., 1999; Sikka, 2002). However, over northern India, specif-ically in the IGP, the importance of aerosols and their vari-ous climatic effects have been little known despite the heavy pollution in the region. Moreover, the Gangetic plains are densely populated with about 600 million people relying on the various hydrological and agricultural resources. With the aid of satellite data, several studies have recently mapped the extent and magnitude of the aerosol loading over IGP. The more common aerosol loading indicator, i.e. Aerosol Optical Depth (AOD), has been used in several studies to elucidate the high pollution levels in the region (Massie et al., 2004; Girolamo et al., 2004; Prasad et al., 2004). The detailed char-acterization of seasonal aerosol loading over single location in IGP, Kanpur (26.45◦N, 80.34◦E), has been documented (Singh et al., 2004) which has been made possible through NASA’s AERONET program (Holben et al., 1998). In gen-eral, a large sustained increasing aerosol loading trend has been found over northern India in the IGP with the analysis of NASA TOMS data in the past two decades (Massie et al., 2004; Habib et al., 2006; Sarkar et al., 2007; Bollasina et al., 2008).
In this paper, we focus our study on the pre-monsoon season when the regional aerosol loading is strongly influ-enced by the transport of dust outbreaks originating in the Thar Desert in northwestern India and in the Arabian Penin-sula. Dust storms over India are major synoptic events and due to the valley-type regional topography, dust particulates accumulate largely over the IGP and significantly influence the aerosol optical properties (Dey et al., 2004; Singh et al., 2004; El-Askary et al., 2006; Prasad and Singh, 2007; Gau-tam et al., 2009a) as well as the regional radiation budget (Singh et al., 2005; Prasad et al., 2007; Pandithurai et al., 2008). The importance of dust solar absorption has been recognized as a potential forcing in altering rainfall distribu-tion globally (Miller et al., 2004) and more specifically over South Asia (Lau et al., 2006a ,b). With the growing attention on the potential effects of aerosol radiative forcing on the In-dian monsoon rainfall and circulation in recent years (Menon et al., 2002; Ramanathan et al., 2005; Lau et al., 2006; Meehl et al., 2008), here we analyze the pre-monsoon aerosol load-ing and the monsoon rainfall variability from long-term ob-servations over India.
2 Data
Inter-annual variability of aerosol loading is studied from the Aerosol Index (AI) dataset obtained from the Nimbus 7 and
Earth Probe Total Ozone Mapping Spectrometer (TOMS) satellite measurements for the period 1979–1992 and 1997– 2001, respectively. The TOMS AI dataset is the longest record for studying the spatial and temporal variability of aerosols on regional and global scales. It has been highly successful in detecting absorbing aerosols particularly over desert regions which have demonstrated the feasibility and success of the TOMS AI dataset (Hsu et al., 1999; Pros-pero et al., 2002). We use the most recent version re-leased to date, i.e. version-8 AI dataset (Wellemeyer et al., 2004; Ahmad et al., 2006). Although, TOMS AI data are available till 2005, however due to calibration issues asso-ciated with sensor degradation, trend analysis of the data after 2001 is not recommended as per the NASA TOMS science team (http://daac.gsfc.nasa.gov/guides/GSFC/guide/ tomsl3 dataset.gd.shtml) and other available documentation (Kiss et al., 2007; Bollasina et al., 2008). Hence, we re-strict the trend analysis of AI data till 2001. In addition to the Nimbus 7 and Earth Probe TOMS data, AI is also ob-tained from the Ozone Monitoring Instrument (OMI) aboard NASA’s Aura satellite. The OMI AI dataset is also derived using the version-8 TOMS methodology and is consistent in its derivation using same wavelength channel with respect to TOMS (Ahmad et al., 2006; Li et al., 2009). More details about the consistency between the TOMS and OMI retrievals are given in Sect. 4.
We also use aerosol loading information from the space borne Moderate Resolution Imaging Spectroradiome-ter (MODIS) instrument over both vegetated as well as arid regions (Hsu et al., 2004; Levy et al., 2007). Aerosol ver-tical distribution information is obtained from the Cloud-Aerosol Lidar with Orthogonal Polarization (CALIOP) in-strument that provides global vertically-resolved measure-ments of aerosol and clouds in the atmosphere (Winker et al., 2003). The CALIOP can observe aerosol over bright sur-faces and beneath thin clouds as well as in clear sky condi-tions. We use the Level 1B data that contains a half orbit (day or night) of calibrated and geo-located single-shot (highest resolution) lidar profiles, including 532 nm and 1064 nm at-tenuated backscatter and depolarization ratio at 532 nm. The vertical resolution for both the profile specific and fixed alti-tude arrays is 30 m.
Figure 1
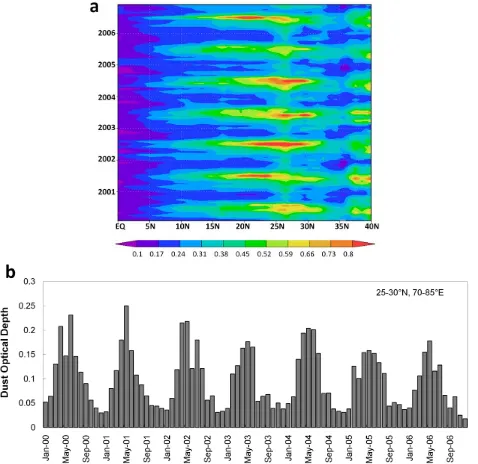
Fig. 1. (a) Inter-annual variability of MODIS AOD over India
(zonal mean: 60–100◦E) from 2001 to 2006; the AOD peaks during the pre-monsoon season and, (b) dust optical depth from GOCART model outputs over northern India region (25–30◦N, 70–85◦E).
combines satellite and gauge measurements. The Version 2 satellite-gauge precipitation estimates were obtained from 1979 to present on a 2.5 degree grid spatial resolution. These data were obtained from http://ingrid.ldeo.columbia. edu/SOURCES/.NASA/.GPCP/.V2/.
3 Aerosol scenario over the Gangetic-Himalayan region 3.1 Inter-annual variability
Aerosols over the IGP undergo strong seasonality in terms of the loading as well as aerosol type (Singh et al., 2004; Jethva et al., 2005; Lau et al., 2008). During spring and sum-mer seasons, dust aerosols are transported from the north-western arid regions to the IGP (Middleton, 1986; Prospero et al., 2002). On the other hand, fine-mode pollution parti-cles such as soot and sulfate form the bulk of the regional atmospheric loading resulting in dense haze and foggy con-ditions during winter months (Girolamo et al., 2004; Prasad et al., 2006; Gautam et al., 2007). Heavy dust loading re-sults in maximum column AOD during pre-monsoon period, while contribution of fine mode pollution aerosols to the to-tal optical depth, such as sulfate and soot, is highest during the post-monsoon and winter period. Figure 1a shows the inter-annual variability of monthly mean AOD over the en-tire Indian subcontinent (eq–40◦N, 60–100◦E) (zonal mean) for the period 2001–2006. As indicated by MODIS
observa-tions, higher AOD persists in the pre-monsoon season over India which is most pronounced over northern India (20– 30◦N), associated with the enhanced dust transport into the IGP. The maximum dust influx from the northwestern arid re-gion peaks during May which is also suggested by high dust optical depths (Fig. 1b) from aerosol transport model outputs (Goddard Global Ozone Chemistry Aerosol Radiation Trans-port, or GOCART, see Chin et al., 2002).
3.2 Spatial distribution
The aerosol transport and loading over this region is strongly governed by the background prevailing meteorology. Dust transport, driven by pre-monsoon westerlies, is clearly mapped by MODIS observations (see Fig. 2: mean AOD for the pre-monsoon period 2003–2006; Gautam et al., 2009b). Not only are the plains influenced with heavy aerosol load-ing, but due to enhanced convection, aerosols are vertically advected to elevated altitudes as well (>3 km) against the foothills of the Himalayas as seen in the climatological mean AOD (Fig. 2). With the onset of rainy season (the Arabian Sea and Bay of Bengal branches of the southwest summer monsoon), the heavy dust loading significantly diminishes due to aerosol washout from the atmosphere. While the sum-mer monsoon is an intense large-scale synoptic phenomenon characterized by heavy rainfall, the northeast monsoon dur-ing winter months (also referred to as the retreat of the mon-soon) accounts for very little rainfall associated with light winds from the subcontinent towards the ocean and marks the beginning of dry season in India. Ground-based mea-surements from sunphotometer deployed at Kanpur in central IGP, part of the AERONET, have indicated significant sea-sonal variations in particle size in different seasons (Singh et al., 2004).
The spatial extent of the dust-laden regions is also clearly visible in Fig. 3 which represents the climatological mean of TOMS AI for May and June from 1979 to 2001 with a gap of satellite data availability (1993–1996). The desert regions of Pakistan, Afghanistan, Iran and Thar Desert in North-western India as well as the dust-transported regions such as the IGP exhibit significantly high aerosol index (greater than 2). Long-range transport of dust from the Arabian Penin-sula over the northern Arabian Sea also results in high values of AI. The spatial extent of aerosol loading over the north-ern Arabian Sea appears to be higher in June due to the strong monsoon wind-blown dust aerosols. Another dust-laden hotspot is the Taklimakan desert, north of the Tibetan Plateau, which is one of the major sources of dust emissions in the atmosphere and significantly affects the air quality and climate over China (Xuan and Sokolik, 2002).
[image:3.595.50.289.63.295.2]Figure 2
Fig. 2. Climatological mean of Aerosol Optical Depth during pre-monsoon season overlaid onto the surface topography (from Gautam et al.,
2009b). Passage of dust transport is clearly visible from the western desert/arid regions into the alluvium of the IGP. Dashed arrows indicate pre-monsoon westerlies and black arrows indicate the passage of moisture transport from Arabian Sea/Indian Ocean into southern India and from Bay of Bengal into the eastern parts of the subcontinent during monsoon season.
Figure 3
Fig. 3. TOMS Aerosol Index Climatology for May (left) and June
(right).
observed over the Hindu Kush Mountains and the desert re-gions to the South. Over northern India, in contrast to the high aerosol loading over western IGP and the Thar Desert, the eastern IGP in comparison is associated with significantly low AI values. According to the onset dates of the sum-mer monsoon, reported by the Indian Meteorological Depart-ment, the eastern IGP receives rainfall earlier compared to western regions. The Bay of Bengal branch of south-west monsoon brings rainfall to regions in the southern slopes of Eastern Himalayas as early as in the first week of June. It is
also a widely held fact that the cumulative monsoon rainfall is highest in the North-East regions in the Indian subconti-nent. The excess rainfall in the first half of June may be responsible for the aerosol washout resulting in decrease in the total column loading of natural or anthropogenic particles and hence the drop in AI.
3.3 Aerosol vertical distribution
[image:4.595.50.285.421.540.2]Figure 4
Fig. 4. (a) Depolarization ratio profile across the Thar Desert and over the Gangetic-Himalayan region, and (b) mean cloud-screened
CALIOP backscatter profile for April–May 2008 over IGP.
due to aerosols at elevated altitudes (∼5 km). The depo-larization ratio indicates the type of particles and is a good proxy to distinguish between spherical (such as sulfate) and non-spherical (such as dust) aerosols. It is defined as the ratio of the perpendicular and parallel components of the attenu-ated backscatter signal (Liu et al., 2008). Higher depolariza-tion suggests the presence of large concentradepolariza-tions of dust or non-spherical particles in the layer in cloud-free conditions. Gautam et al. (2009a) used the depolarization ratio exten-sively over the Indian subcontinent to infer the contribution
of dust during pre-monsoon season and separate that with other anthropogenic emissions in this region.
[image:5.595.128.467.63.534.2]spherical particles resulting from anthropogenic pollution. This sharp contrast in the depolarization ratio, across the ver-tical cross-section in Fig. 4a, appears to be more pronounced due to the relatively stable atmosphere during nighttime. It should be noted though that the high depolarization ratio ob-served over the Himalayas-Tibetan Plateau and the southern slopes (32–36◦N along the transect) are possibly associated with cloud attenuation, most likely due to the presence of ice crystals, which are also non-spherical in shape. Thus, the feature over the Himalayas should not be interpreted as aerosol layer as also indicated by the CALIPSO vertical fea-ture mask (not shown).
We analyzed CALIPSO Level-1b attenuated backscatter profiles over the IGP during April–May 2008. An essential pre-processing step to analyze aerosol vertical distribution is to cloud-screen the profiles. The Level-2 cloud-layer product was utilized to filter out cloud contamination in the backscat-ter profiles, where cloud top and bottom are reported for each cloud layer found in a single vertical profile. Backscatter profiles for April–May 2008 were averaged to a 5-km hori-zontal resolution (15 lidar shot averaging) in order to make those consistent with the 5-km resolution cloud-layer prod-uct to screen the signal due to the attenuation by clouds. The resulting cloud-free backscatter profiles over a selected re-gion in the IGP (25–27◦N, 80–85◦E) were averaged to rep-resent the mean vertical distribution of aerosols. Figure 4b shows the mean backscatter profile over the IGP where the aerosol transport is characterized by large attenuation associ-ated with dust particles (most likely mixed with heavy local pollution) at elevated altitudes peaking around 3 km and ex-tends up to 5 km. The knowledge of aerosol vertical extent is important as it influences radiative heating rates and may in-fluence the stability of the atmosphere. Over northern India and the foothills of the Himalayas, enhanced aerosol radia-tive heating may potentially strengthen the monsoon circula-tion by atmospheric-driven feedbacks (Lau et al., 2006). The following section discusses the role of aerosol solar absorp-tion and its possible influence on the Indian summer mon-soon rainfall variability in connection with the tropospheric warming associated with the aerosol forcing over northern India.
4 Aerosol and monsoon rainfall variability over India 4.1 Potential role of aerosols in altering rainfall
distribution
Of the greatest importance to large populations and to the poor, the Indian summer monsoon is the biggest source of freshwater resource. More than 70% of the annual precipita-tion over India occurs during the summer monsoon season (June-July-August-September) (Parthasarathy and Mooley, 1978; Dash et al., 2009). The subcontinent heats rapidly dur-ing the pre-monsoon months, while the Indian Ocean
warm-ing is relatively less compared to the landmass. The result-ing meridional thermal contrast (latitudinal gradient across the Indian landmass and the northern Indian Ocean, i.e. from equator to 40◦N) causes strong moisture-laden winds from the oceanic regions to the landmass leading to heavy rainfall during the monsoon period.
Against the backdrop of increasing aerosol concentrations, recent studies have recognized the potential role of aerosols inducing changes in the monsoon circulation and rainfall over India. There are two major approaches in the recent lit-erature that demonstrate these aerosol effects as documented in Lau et al. (2008).
4.1.1 Surface dimming effect
This mechanism proposed by Ramanathan et al. (2005) fo-cuses on the northern Indian Ocean region where thick haze, consisting of dust, BC, sulfate, fly ash aerosols (referred to as Atmospheric Brown Clouds), is transported from South Asia towards the India Ocean. It has been shown by Satheesh and Ramanathan (2000) that the widespread haze causes sig-nificant perturbations in the regional radiation budget with large reductions in the solar insolation at the ocean surface. The reduction of sunlight cuts the evaporation rates which further suppress convection from the ocean surface leading to reduced moisture transport towards the subcontinent dur-ing the peak monsoon season. This mechanism suggests the weakening of monsoon circulation and reduction of monsoon rainfall with the future possibility of frequent droughts. 4.1.2 Elevated Heat Pump (EHP) hypothesis
Lau et al. (2006a) proposed the EHP mechanism which rests on the heavy aerosol loading over northern India, primar-ily the IGP and over the foothills of the Himalayas, prior to the onset of the monsoon. Enhanced dust loading mixed with carbonaceous soot aerosols are vertically advected to el-evated altitudes and pile up against the southern slopes of the Himalayas and cause significant warming in the middle and upper troposphere. The enhanced aerosol solar absorption creates a temperature anomaly which amplifies the overturn-ing of the meridional circulation and thus causes to draw in more moisture from the Indian Ocean. This mechanism has been hypothesized in the advancement and intensification of the early summer monsoon.
aerosol indirect effects are more likely to come into play dur-ing the rainy period and are also dependent on the prevaildur-ing meteorological conditions.
4.2 TOMS aerosol index
In relation with the potential role of aerosol solar absorption on the monsoon as discussed above, we analyze the monsoon rainfall variability in relation with increasing aerosol load-ing over the Indian subcontinent, particularly, dust-transport in the Gangetic-Himalayan region during pre-monsoon sea-son. The atmospheric pollution, in general over India, has significantly increased as indicated by emission inventories (Guttikunda et al., 2003; Habib et al., 2006). The TOMS satellite measurements in the past two decades have also indicated large sustained increasing aerosol loading trend (based on AI data), particularly over the IGP (Habib et al., 2006; Sarkar et al., 2007). A significant positive trend was found in the winter AI data over northern India due to the increasing anthropogenic/industrial emissions (Massie et al., 2004), concentrated over this region, mostly consist-ing of fine-mode carbonaceous and sulfate aerosols. The pre-monsoon aerosol loading over northern India, associated with dust-dominant aerosol type, has also experienced an in-crease since late 1970s as indicated by TOMS measurements (Habib et al., 2006; Bollasina et al., 2008). Even though there exists data gaps in the TOMS AI record, above cited studies have demonstrated the feasibility of inferring the in-creasing aerosol loading tendency in a qualitative manner. The increasing dustiness has also been reported from other indirect studies using isotopically inferred temperatures from ice cores in the Himalayas-Tibetan Plateau (Thompson et al., 2000).
Figure 5a shows the TOMS derived absorbing aerosol in-dex over northern India encompassing the IGP and the Thar Desert with an upward trend during the pre-monsoon season (March-April-May) for the period 1979–1990 from the Nim-bus 7 platform. Due to the data gap thereafter until 1996, the Earth Probe TOMS AI variations are shown as a continuation in Fig. 5a. The TOMS data beyond 1990 (from Nimbus 7) and 2001 (from Earth Probe) are not used in this study due to calibration issues associated with sensor degradation (as dis-cussed in Sect. 2). In addition, the spatial distribution from the Nimbus 7 and Earth Probe TOMS indicates a strong pos-itive pre-monsoon aerosol loading trend over the Thar Desert with enhanced dust-transport activity into the IGP (Gautam et al., 2009b). Figure 5a also includes the pre-monsoon AI variations obtained from the Ozone Monitoring Instrument (OMI) data from 2005 to 2008.
As previously discussed in Sect. 2 about the consistency between the TOMS and OMI retrievals, we also perform an inter-comparison of AI data from Earth Probe/TOMS and OMI sensors for the only available overlapping pre-monsoon period of 2005 averaged over the IGP and the Thar Desert region. The results show close agreement between
the two measurements (r2=0.8 exceeding 99% confidence) with TOMS AI values overestimating that from OMI par-ticularly for low aerosol loading days (Fig. 5b). The bias could be a result of the calibration issues associated with the TOMS sensor after 2001 and needs to be investigated fur-ther. Unfortunately, there is no overlapping period between Nimbus 7 and Earth Probe TOMS for which the AI data can be inter-compared. However, a recent rigorous study, by Li et al. (2009), on the temporal and spatial variability of AI concludes that the monthly mean Earth Probe TOMS AI and OMI annual cycles agree very well with monthly mean Nim-bus 7 TOMS AI both globally and regionally, indicating that the AI product is a consistent absorbing aerosol record (Li et al., 2009). The results of Li et al. (2009) also provide a basis for combined studies using TOMS and OMI data in future. It should also be noted that the AI greatly depends on aerosol vertical distribution and is less sensitive to near-surface or boundary layer aerosols (Hsu et al., 1999). This aspect of altitude dependence should be less pertinent to our study which focuses on the pre-monsoon season when wind-blown dust aerosols prevail, as compared to other seasons especially during the winter haze period when aerosols over the IGP are trapped within the boundary layer with relatively stable atmospheric conditions. Nevertheless, using the three AI datasets here, it is not intended to quantitatively construe an increasing trend in the pre-monsoon aerosol loading from 1979 to 2008, especially when OMI is a hyperspectral sen-sor as opposed to the multispectral channels in TOMS with different spectral response functions. However, the version-8 TOMS and OMI retrievals of aerosols are consistent with each other in terms of the derivation of AI from same wave-lengths (Ahmad et al., 2006; Li et al., 2009), thus suggest-ing an upward tendency of aerosol loadsuggest-ing dursuggest-ing this period (Fig. 5a).
4.3 Monsoon rainfall variability
Figure 5
Fig. 5. (a) Inter-annual variations of pre-monsoon Absorbing Aerosol Index from Nimbus 7/TOMS (1979–1992), EarthProbe/TOMS (1997–
2001) and OMI (2005–2008) over northern India ((25–35◦N, 69–82◦E), and (b) inter-comparison of AI data from Earth Probe/TOMS and OMI sensors for the only available overlapping pre-monsoon period of 2005 averaged over the IGP and the Thar Desert region.
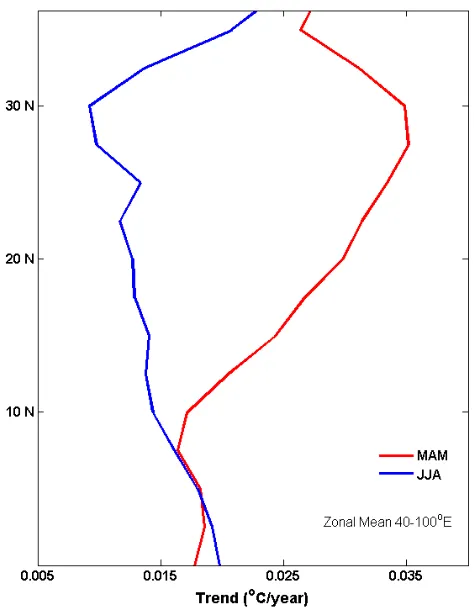
Figure 6 shows the temperature trends for the entire pre-monsoon (March-April-May) and monsoon (June-July-August) periods over the Indian Monsoon region (eq–40◦N, 40–100◦E) with zonal mean temperature trend (derived from the anomaly) for the two seasons in the past three decades. As a consequence of the anomalous Himalayan tro-pospheric warming (Gautam et al., 2009b), there is an ob-served strengthening of the meridional land-sea tropospheric temperature gradient in the past three decades (Fig. 6).
Since the land-sea thermal gradient is crucial to the on-set and intensity of the Indian summer monsoon, it is rea-sonable to anticipate that a strengthened temperature gradi-ent may influence the monsoon rainfall, particularly the early summer rainfall. In order to investigate any influence of the observed strengthening of the pre-monsoon land-sea tropo-spheric temperature gradient on the monsoon rainfall vari-ability in recent decades, we analyze the historical record
Figure 6
Fig. 6. Zonal mean (40–100◦E) latitudinal profile of
mid-tropospheric temperature trend for the pre-monsoon season (March-April-May, or MAM in red) and monsoon season (June-July-August, or JJA in blue) from 1979 to 2007.
GPCP, indicates strong upward trends over the Indian Mon-soon region including the Arabian Sea and the Bay of Bengal (Fig. 8). The spatial rainfall pattern also resembles the char-acteristic large-scale rainfall pattern associated with the EHP effect (Lau and Kim, 2006).
In contrast to the steadily increasing June rainfall in re-cent decades, all the remaining monsoon months, from July to September, are characterized by rainfall deficit since the late 1950s (Fig. 7). Table 1 shows the trends with their significance level for each monsoon month during the long-term period 1950–2004 averaged over the entire Indian sub-continent from the IITM dataset. Apparently, as the MSU data show, the strengthened pre-monsoon land-sea tempera-ture gradient significantly weakens during June-July-August (Fig. 6). The land-sea tropospheric temperature gradient ap-pears to be rather stabilized with very little warming recorded over the arid regions to the west of the Himalayas as well. In fact, oceanic regions south of 10◦N exhibit upward trends comparable to the continental regions to the north and are even higher compared to the Indian subcontinent (which is associated with weak negative-neutral trends). Following the reduced warming, the observed deficit from July to
Septem-Table 1. Trend values and their significance of monsoon rainfall
over India calculated from the All-India monsoon rainfall data from IITM for June, July, August and September for the period 1950– 2004.
1950–2004 Trend Confidence
June 0.49 94%
July −0.80 98%
August −0.32 NS
September −0.53 91%
NS denotes trend not significant.
ber appears to have compensated the marked rainfall increase in June resulting in a weak weakening trend of the recent composite JJAS rainfall. Increased rainfall in the early mon-soon season may lead to regional atmosphere-land feedback that cools the land surface (Bollasina et al., 2008) subse-quently reducing rainfall during the peak monsoon months (July–August).
[image:9.595.358.496.120.197.2]Figure 7
Fig. 7. Time series and linear trends of monthly separated All India Monsoon Rainfall for June, July, August and September from 1979 to
2004. June rainfall exhibits a characteristic increasing trend, while all remaining monsoon months show a significant weakening trend in recent past decades.
Figure 8
Fig. 8. Spatial trend analysis of June rainfall, from gauge and
satel-lite measurements, indicates strong upward trends over the Indian Monsoon region including the Arabian Sea and the Bay of Bengal from 1979 to 2007 (Units: mm/day/year).
and other important forcing including the El Nino Southern Oscillation (Kumar et al., 1999).
5 Summary
Asian landmass. Although it is difficult to predict future composite JJAS rainfall trends (Goswami et al., 2006), how-ever, our findings raise the intriguing possibility that if the tropospheric temperature trends continue, then in the com-ing years, the South Asian region could experience a wetter monsoon in early summer followed by a drier period. Our findings also have important bearings on agricultural prac-tices and crop productivity which is vital to the South Asian socio-economic infrastructure.
It is thus imperative to monitor aerosols both over the source as well as sink regions in the monsoon dominated regions, especially when the role of aerosols on the hydro-logical cycle is being widely recognized in recent years with number of modeling efforts dedicated to this subject (Menon et al., 2002; Miller et al., 2004; Ramanathan et al., 2005; Lau et al., 2006; Meehl et al., 2008; Collier and Zhang, 2009). The observational results of monsoon rainfall vari-ability in recent decades as presented in this paper comple-ment the modeling results of Lau et al. (2006). However, reliable and more accurate information of the absorbing na-ture of aerosols is needed, particularly, of the pre-monsoon aerosols of which dust is a major component. Quantita-tive measurements of aerosol single scattering albedo is cru-cial in understanding the associated tropospheric warming and surface dimming; and thus their ramifications on the monsoon circulation and rainfall variability. Sophisticated ground-based measurements of aerosols, clouds and trace gases together with satellite A-Train series observations over the Asian monsoon regions as coordinated under the Joint Aerosol Monsoon Experiment (JAMEX) (Lau et al., 2008) framework would specifically provide detailed information about aerosol optical and radiative properties and will help reduce uncertainties associated with aerosol radiative forc-ing. Accurate information of aerosol absorption, incorpo-rated into general circulation models, is required for reliable projections of aerosol forcing in order to examine their net response on tropospheric temperatures.
Acknowledgements. This work is supported by NASA Interdisci-plinary Investigation Program, managed by Hal Maring. We also acknowledge support by the NASA Grant: NNX06AF30G – Global Environmental Change-hazards and regional impacts, and support by the technical officers Don Anderson and Lucia Tsaoussi. GO-CART model outputs were obtained from the Giovanni web portal. We are grateful to the anonymous reviewers and the Editor for their constructive comments.
Topical Editor F. D’Andrea thanks three anonymous referees for their help in evaluating this paper.
References
Ahmad, S. P., Torres, O., Bhartia, P. K., Leptoukh, G., and Kempler, S. J.: Aerosol Index from TOMS and OMI Measurements, Proc. of the 86th AMS Annual Meeting, February 2006.
Allen, M. R. and Ingram, W. J.: Constraints on future changes in climate and the hydrological cycle, Nature, 419, 224–232, 2002.
Bollasina, M., Nigam, S., and Lau, K.-M.: Absorbing aerosols and summer monsoon evolution over South Asia: An observational portrayal, J. Climate, 21, 3221–3239, 2008.
Collier, J. C. and Zhang, G. J.: Aerosol direct forcing of the sum-mer Indian monsoon as simulated by the NCAR CAM3, Clim. Dynam., 32, 313–332, doi:10.1007/s00382-008-0464-9, 2009. Dash, S. K., Kulkarni, M. A., Mohanty, U. C., and Prasad, K.:
Changes in the characteristics of rain events in India, J. Geophys. Res., 114, D10109, doi:10.1029/2008JD010572, 2009.
Dey, S., Tripathi, S. N., Singh, R. P., and Holben, B. N.: In-fluence of dust storms on the aerosol optical properties over the Indo-Gangetic plains, J. Geophys. Res., 109, D20211, doi:10.1029/2004JD004924, 2004.
El-Askary, H., Gautam, R., Singh, R. P., and Kafatos, M.: Dust Storms Detection over the Indo-Gangetic Plains using Multi Sen-sor Data, Adv. Space Res., 37, 728–733, 2006.
Fu, Q., Johanson, C. M., Warren, S. G., and Seidel, D. J.: Contri-bution of stratospheric cooling to satellite-inferred tropospheric temperature trends, Nature, 429, 55–58, 2004.
Gautam, R., Hsu, N. C., Kafatos, M., and Tsay, S.-C.: Influences of winter haze on fog/low cloud over the Indo-Gangetic plains, J. Geophys. Res., 112, D05207, doi:10.1029/2005JD007036, 2007. Gautam, R., Liu, Z., Singh, R. P., and Hsu, N. C.: Two contrasting dust-dominant periods over India observed from MODIS and CALIPSO data, Geophys. Res. Lett., 36, L06813, doi:10.1029/2008GL036967, 2009.
Gautam, R., Hsu, N. C., Lau, K.-M., Tsay, S.-C., and Kafatos, M.: Enhanced pre-monsoon warming over the Himalayan-Gangetic region from 1979 to 2007, Geophys. Res. Lett., 36, L07704, doi:10.1029/2009GL037641, 2009.
Girolamo, L., Bond, T. C., Bramer, D., Diner, D. J., Fettinger, F., Kahn, R. A., Martonchik, J. V., Ramana, M. V., Ramanathan, V., and Rasch, P. J.: Analysis of Multiangle Imaging Spec-troRadiometer (MISR) aerosol optical depths over greater In-dia during winter 2001–2004, Geophys. Res. Lett., 31, L23115, doi:10.1029/2004GL021273, 2004.
Goes, J. I., Thoppil, P. G., Gomes, H. do R., and Fasullo, J. T.: Warming of the Eurasian landmass is making the Arabian Sea more productive, Science, 308, 545–547, 2005.
Goswami B. N., Venugopal, V., Sengupta, D., Madhusoodanan, M. S., and Xavier, P. K.: Increasing trend of Extreme Rain Events over India in a Warming Environment, Science, 314, 1442–1445, 2006.
Guttikunda, S. K., Carmichael, G. R., Calori, G., Eck, C., and Woo, J. H.: The contribution of mega cities to regional sulfur pollution in Asia, Atmos. Environ., 37, 11–22, 2003.
Habib, G., Venkataraman, C., Chiapello, I., Ramachandran, S., Boucher, O., and Reddy, M. S.: Seasonal and interannual vari-ability in absorbing aerosols over India derived from TOMS: Re-lationship to regional meteorology and emissions, Atmos. Envi-ron., 40, 1909–1921, 2006.
Held, I. M. and Soden, B. J.: Robust responses of the hydrological cycle to global warming, J. Climate, 19, 5686–5699, 2006. Herman, J. R., Bhartia, P. K., Torres, O., Hsu, C., Seftor, C., and
Celarier, E.: Global distribution of UV-absorbing aerosols from Nimbus 7/TOMS data, J. Geophys. Res., 102, 16911–19922, 1997.
Biomass Burning Smoke from TOMS Measurements, Geophys. Res. Lett., 23, 745–748, 1996.
Hsu, N. C., Herman, J. R., Torres, O., Holben, B. N., Tanre, D., Eck, T. F., Smirnov, A., Chatenet, B., and Lavenu, F.: Comparisons of the TOMS aerosol index with Sun-photometer aerosol optical thickness: Results and applications, J. Geophys. Res., 104(D6), 6269–6279, 1999.
Hsu, N. C., Tsay, S. C., King, M. D., and Herman, J. R.: Aerosol properties over bright-reflecting source regions, IEEE Trans. Geosci. Remote Sens., 42, 557–569, 2004.
Hsu, N. C., Tsay, S. C., King, M. D., and Herman, J. R.: Deep blue retrievals of Asian aerosol properties during ACE-Asia, IEEE Trans. Geosci. Remote Sens., 44, 3180–3195, 2006.
Huebert, B. J., Bates, T., Russell, P. B., Shi, G., Kim, Y. J., Kawa-mura, K., Carmichael, G., and Nakajima, T.: An overview of ACE-Asia: Strategies for quantifying the relationships between Asian aerosols and their climatic impacts, J. Geophys. Res., 108(D23), 8633, doi:10.1029/2003JD003550, 2003.
Jethva, H., Satheesh, S. K., and Srinivasan, J.: Seasonal variability of aerosols over the Indo-Gangetic plains, J. Geophys. Res., 110, D21204, doi:10.1029/2005JD005938, 2005.
Kaufman, Y. J. and Fraser, R. S.: The effect of smoke particles on clouds and climate forcing, Science, 277, 1636–1639, 1997. Krishna Moorthy, K., Niranjan, K., Narasimhamurthy, B., Agashe,
V. V., and Krishna Murthy, B. V.: ISRO-GBP Scientific Report, 03 99, 1999.
Kumar, K. K., Rajagopalan, B., and Cane, M. A.: On the weakening relationship between the Indian monsoon and ENSO, Science, 284, 2156–2159, 1999.
Lau, K. M., Kim, M. K., and Kim, K. M.: Asian monsoon anoma-lies induced by aerosol direct effects, Clim. Dynam., 26, 855– 864, doi:10.1007/s00382-006-0114-z, 2006a.
Lau K.-M. and Kim, K.-M.: Observational relationships between aerosol and Asian monsoon rainfall, and circulation, Geophys. Res. Lett., 33, L21810, doi:10.1029/2006GL027546, 2006b. Lau, K.-M., Kim, K.-M., Hsu, N. C., and Singh, R. P.: Seasonal
co-variability of aerosol and precipitation over the Indian monsoon and adjacent deserts, GEWEX News, 18(1), 4–6, 2008. Lau, K. M., Ramanathan, V., Wu, G.-X., Li, Z., Tsay, S. C., Hsu, C.,
Siika, R., Holben, B., Lu, D., Tartari, G., Chin, M., Koudelova, P., Chen, H., Ma, Y., Huang, J., Taniguchi, K., and Zhang, R.: the Joint Aerosol-Monsoon Experiment: A New Challenge in Monsoon Climate Research, B. Am. Meteorol. Soc., 89, 369– 383, doi:10.1175/BAMS-89-3-369, 2008.
Levy, R. C., Remer, L. A., Mattoo, S., Vermote, E. F., and Kauf-man, Y. J.: Second generation operational algorithm: Retrieval of aerosol properties over land from inversion of Moderate Resolu-tion Imaging Spectroradiometer spectral reflectance, J. Geophys. Res., 112, D13211, doi:10.1029/2006JD007811, 2007.
Li, Z., Xia, X., Cribb, M., Mi, W., Holben, B., Wang, P., Chen, H., Tsay, S.-C., Eck, T. F., Zhao, F., Dutton, E. G., and Dickerson, R. R.: Aerosol optical properties and their radia-tive effects in northern China, J. Geophys. Res., 112, D22S07, doi:10.1029/2006JD007382, 2007.
Li, J., Carlson, B. E., and Lacis, A. A.: A study on the tem-poral and spatial variability of absorbing aerosols using To-tal Ozone Mapping Spectrometer and Ozone Monitoring In-strument Aerosol Index data, J. Geophys. Res., 114, D09213, doi:10.1029/2008JD011278, 2009.
Liu, Z., Liu, D., Huang, J., et al.: Airborne dust distributions over the Tibetan Plateau and surrounding areas derived from the first year of CALIPSO lidar observations, Atmos. Chem. Phys., 8, 5045–5060, 2008,
http://www.atmos-chem-phys.net/8/5045/2008/.
Massie, S. T., Torres, O., and Smith, S. J.: Total Ozone Mapping Spectrometer (TOMS) observations of increases in Asian aerosol in winter from 1979 to 2000, J. Geophys. Res., 109, D18211, doi:10.1029/2004JD004620, 2004.
Meehl, G. A. and Arblaster, J. M.: Mechanisms for projected future changes in south Asian monsoon precipitation, Clim. Dynam., 21, 659–675, 2003.
Meehl, G. A., Arblaster, J. M., and Collins, W. D.: Effects of black carbon aerosols on the Indian monsoon, J. Climate, 21, 2869– 2882, 2008.
Menon, S., Hansen, J., Nazarenko, L., and Luo, Y.: Climate effects of black carbon aerosols in China and India, Science, 297, 2250– 2253, 2002.
Middleton, N. J.: A geography of dust storms in southwest Asia, Int. J. Clim., 6, 183–196, 1986.
Miller, R. L., Tegen, I., and Perlwitz, J.: Surface radiative forcing by soil dust aerosols and the hydrologic cycle, J. Geophys. Res., 109, D04203, doi:10.1029/2003JD004085, 2004.
Pandithurai, G., Dipu, S., Dani, K. K., Tiwari, S., Bisht, D. S., De-vara, P. C. S., and Pinker, R. T.: Aerosol radiative forcing dur-ing dust events over New Delhi, India, J. Geophys. Res., 113, D13209, doi:10.1029/2008JD009804, 2008.
Parthasarathy, B., Munot, A. A., and Kothawale, D. R.: Monthly and seasonal rainfall series for all-India homogeneous regions and meteorological subdivisions: 1871–1994, Research Report No. RR-065, Indian Institute of Tropical Meteorology, Pune, 113 pp, 1995.
Prasad, A. K. and Singh, R. P.: Changes in aerosol parameters dur-ing major dust storm events (2001–2005) over the Indo-Gangetic Plains using AERONET and MODIS data, J. Geophys. Res., 112, D09208, doi:10.1029/2006JD007778, 2007.
Prospero, J. M., Ginoux, P., Torres, O., Nicholson, S. E., and Gill, T. E.: Environmental characterization of global sources of at-mospheric soil dust identified with the Nimbus 7 Total ozone Mapping Spectrometer (TOMS) absorbing aerosol product, Rev. Geophys., 40, 1002, doi:10.1029/2000RG000095, 2002. Ramanathan, V., Chung, C., Kim, D., Bettge, T., Buja, L., Kiehl,
J. T., Washington, W. M., Fu, Q., Sikka, D. R., and Wild, M.: Atmospheric brown clouds: Impacts on South Asian climate and hydrological cycle, Proc. Natl. Acad. Sci. USA, 102, 5326–5333, 2005.
Rosenfeld, D., Rudich, Y., and Lahav, R.: Desert dust suppress-ing precipitation: A possible desertification feedback loop, Proc. Natl. Acad. Sci. USA, 98, 5975–5980, 2001.
Satheesh, S. K. and Ramanathan, V.: Large differences in tropical aerosol forcing at the top of the atmosphere and Earth’s surface, Nature, 405, 60–63, 2000.
Sikka, D. R.: Developments in tropospheric aerosol studies in India, Ind. J. Radio Space Phys., 31, 391–403, 2002.
Sikka, D. R.: Evaluation of monitoring and forecasting of summer monsoon over India and a review of monsoon drought of 2002, Proc. Indian Natl. Sci. Acad., Part A, 69, 479–504, 2003. Singh, R. P., Dey, S., Tripathi, S. N., Tare, V., and Holben, B.:
Geophys. Res., 109, D23206, doi:10.1029/2004JD004966, 2004. Singh, S., Nath, S., Kohli, R., and Singh, R.: Aerosols over Delhi during pre-monsoon months: Characteristics and effects on surface radiation forcing, Geophys. Res. Lett., 32, L13808, doi:10.1029/2005GL023062, 2005.
Shukla, J.: Interannual variability of monsoons, in: Monsoons, edited by: Fein, J. S. and Stephens, P. L., John Wiley & Sons, New York, pp. 399–463, 1987.
Thompson, L. G., Yao, T., Mosley-Thompson, E., David, M. E., Henderson, K. A., and Lin, P.-N.: A high-resolution millennial record of the South Asian monsoon from Himalaya ice cores, Science, 289, 1916–1919, 2000.
Wellemeyer, C. G., Bhartia, P. K., Taylor, S. L., Qin, W., and Ahn, C.: Version 8 Total Ozone Mapping Spectrometer (TOMS) al-gorithm, presented at the 20th Quad. Ozone Symp., edited by: Zerefos, C. S., Athens, Greece, 2004.
Wentz, F. J., Ricciardulli, L., Hilburn, K., and Mears, C.: How much more rain will global warming bring?, Science, 317, 233–235, 2007.
Winker, D. M., Pelon, J., and McCormick, M. P.: The CALIPSO mission: Spaceborne lidar for observation of aerosols and clouds, Proc. SPIE Int. Soc. Opt. Eng., 4893, 1–11, 2003.