CC S.. =
BY NC ND
http://doi.org/10.5114/bta.2019.90245
Yeast extract-mediated elicitation
of anti-cancerous compounds licoisoflavone B, licochalcone A,
and liquirtigenin in callus cultures of
Glycyrrhiza glabra
U.VIJAYALAKSHMI, ABHILASHA SHOURIE*
Department of Biotechnology, Faculty of Engineering & Technology, Manav Rachna International Institute of Research & Studies, Faridabad, India
Abstract
Licoisoflavone B, licochalcone A, and liquirtigenin are important flavonoids found in the medicinal plant
Glycyr-rhiza glabra and are known for their preventive and therapeutic potential against cancer. Extraction of these
flavo-noids in commercially viable quantities is a challenging task. Therefore, an attempt has been made to elicit the production of these flavonoids in tissue cultures of G. glabra. We investigated the effect of the biotic elicitor yeast extract (YE) on the production of three flavonoids in G. glabra callus cultures grown in a previously standardized nutrient medium consisting of Murashige and Skoog’s medium components supplemented with naphthalene acetic acid and benzyl amino purine. The YE elicitor was tested in the concentration range of 25–175 mg/l. At each elicitor concentration, a time-course analysis was also performed to determine the effect of the duration of YE treatment on flavonoid production. The effect of YE on the key enzyme of the phenylpropanoid pathway, phenylalanine ammonia lyase (PAL), antioxidant enzymes, polyphenoloxidase (PPO), and peroxidase (POD) was also observed. The results revealed that 75 mg/l concentration of YE was most suitable for elicitation of biosynthe-sis of flavonoids in G. glabra cultures and more than a 2-fold increase in the production of all the three flavonoids was obtained. The activities of the enzymes, PAL, PPO, and POD, also increased significantly, suggesting that the stress response was elicited by YE. These results provide evidence of activation of phenylpropanoid meta-bolism and regulation of its key enzymes by YE, eventually leading to enhanced production of anti-cancerous fla-vonoids licoisoflavone B, licochalcone A, and liquirtigenin.
Key words: Glycyrrhiza glabra, licoisoflavone B, licochalcone A, liquirtigenin, yeast extract, elicitation
Introduction
Cancer continues to remain the most daunting and life-threatening disease world-wide (Ma and Yu, 2006). Despite numerous advances and giant leaps in antican-cer drug discovery, the search for safe and effective anti-cancer compounds still continues. Numerous studies have been conducted on the use of phytochemicals and natural compounds in the prevention of cancer (Ma and Yu, 2006; Wang et al., 2012; Iqbal et al., 2017; Jacobs,
2018). Glycyrrhiza glabra (G. glabra is a perennial herb
known for its antioxidant, antitumor, anti-cancerous, and other health-protective bioactivities which are attributed to the presence of phytochemicals, especially flavonoids
(Vispute and Khopade, 2011). Licochalcone A, liquirti-genin, and licoisoflavone B are among the major
flavo-noids of G. glabra possessing anti-cancerous properties
(Vispute and Khopade, 2011).
Licochalcone A is capable of inducing apoptosis and arresting cancer cell division and has been widely stu-died for its anti-cancerous activity and is now being used in cancer treatment (Shreya Dave et al., 2016). The com-pound has been reported to induce intrinsic and extrin-sic apoptosis via erk1/2 and p38 phosphorylation-media-ted trail expression in head and neck squamous carci-noma (Park et al., 2015). Licochalcone A is a selective c-Jun N-terminal kinase (JNK1) inhibitor which has a
tical role in inhibiting the growth of colon cancer cells and prevents pancreatic carcinogenesis (Yao et al., 2014). Licochalcone A prevents the growth of HepG2 cells through cell proliferation arrest and subsequent induction of apoptosis (Chen et al., 2017). It also causes G2 and late G1 phase arrests in androgen-independent PC-3 prostate cancer cells (Fu et al., 2004). Licochal-cone A is reported to have exerted antitumor activity in studies involving bladder cancer cell lines, and mice mo-dels (Yang-Zhang et al., 2016).
Liquirtigenin belongs to the chiral flavanone family and its cancer-preventive mechanism has been studied by various researchers. Zhou et al. (2010) reported
a significant in vivo inhibitory activity of liquirtigenin
against hepatoma tumors. It has also exhibited inhibitory
activity against tumor growth in the mouse model of Hela cells by inducing cellular apoptosis via the mito-chondrial pathway, which is associated with p53 up-regu-lation, release of cytochrome c and elevated activity of caspase-9 and caspase-3 (Liu et al, 2011). It was also reported to induce tumor cell death through mitogen – activated protein kinase mediated pathway in hepato-cellular carcinoma cells in mice model (Wang et al., 2014). Licoisoflavone B exhibits anti-mutagenic activity against carcinogenic mutagen N-methyl-N-nitrosourea
and other N-nitroso compounds, by preventing DNA
da-mage caused by them. (Inami et al., 2017). Isoflavones were reported to be involved in the modulation of cell proliferation, regulation of cell cycle, apoptosis, angio-genesis, and tumor cell metastasis (Wuttke et al., 2010).
The three flavonoids, licoisoflavone B, licochalcone A, and liquirtigenin are much-needed due to their potential medicinal properties and prospective use as anticancerous drugs. These flavonoids are produced mainly in the roots of G. glabra plants and are extracted usually after their complete uprooting (Vijayalakshmi and Shourie, 2017). Their yield, however, is not very consistent because it is affected by numerous environmental factors (Panche et al., 2016). Thus, the production of these flavonoids in tissue cultures can be seen as a promising option. This research focuses on obtaining desirable quantities of licoisoflavone B, licochalcone A, and liquirtigenin from
callus cultures of G. glabra by using yeast extract (YE)
elicitation and presents the very first report on si-multaneous elicitation of three flavonoids. This study also gives an insight into probable mechanisms involved
in the elicitation of G. glabra tissue cultures.
Materials and methods
Callus culture
Authentic G. glabra plants were obtained from the
fo-rest nursery, Faridabad in the month of August and the young leaves were used as explants. The callus culture was developed using a previously standardized culture medium (Vijayalakshmi and Shourie, 2016a) which is
further referred to in this paper as G. glabra callus
cul-ture (GCC) medium. All the inoculations were carried out in a laminar air flow chamber and the cultures were incubated at a controlled light intensity of 2000 Lux for
a 16-hour light and 8-hour dark photoperiod at 25 ± 2EC.
Callus growth was assessed by measuring the weight of the callus at the time of initiation and at the end of each week after inoculation for 8 weeks. Assessment of callus growth was done on the basis of growth index (GI).
GI = (final fresh weight ! initial fresh weight) / / initial fresh weight
(Vijayalakshmi and Shourie, 2016a).
Elicitor preparation and elicitation of callus cultures of G. glabra
YE was prepared by the ethanol precipitation method (Chen and Chen, 2001), in which YE was first dissolved in distilled water and then precipitated in 80% ethanol.
After incubation at 4EC for 4 days, the precipitate was
redissolved in distilled water, autoclaved at 121EC for
15 min and the final volume was adjusted to obtain the required YE concentrations ranging from 25 mg/l to 175 mg/l. In all the experiments, YE was supplemented to the standardized GCC medium in defined doses.
Extraction, qualitative analysis, and quantitative estimation of flavonoids
The elicited and non-elicited callus cultures were har-vested, shade-dried, powdered in a mechanical grinder
and extracted in 70% ethanol at 85EC for 4 h with
helium as a carrier gas at a flow rate of 1.21 ml/min,
85.4 kPa inlet pressure and 250EC temperature. Mass
spectra were recorded at 70 eV with a scan interval of 0.5s (Vijayalakshmi and Shourie, 2016b).
Phenylalanine ammonia-lyase (PAL)assay
PAL was extracted from callus tissues by
homogeni-zing it with 0.05 M Tris–HCl(pH 8.0), 0.8 mM β
-mer-captoethanol, and 1% w/v polyvinyl pyrrolidone. Sub-strate phenylalanine (10 mM) was added to the enzyme
extract and incubated for 1 h at 37EC. The reaction was
stopped by the addition of 0.1 ml 1 N HCl, and absor-bance was read at 290 nm in ultraviolet – visible spectro-photometer. The enzyme activity was expressed in
terms of the formation of 1 μM of trans-cinnamic acid
per min per mg of enzyme (Syklowska-Baranek et al., 2012). The protein content was determined according to the Bradford method (Bradford, 1976) with a standard curve prepared using bovine serum albumin (BSA) (Sigma-Aldrich).
Polyphenoloxidase (PPO) enzyme assay
The PPO enzyme assay was carried out according to the method described by Soffan et al. (2014). One gram of callus was homogenized in 2 ml of 0.1 M sodium phos-phate buffer (pH 6.5). The homogenate was centrifuged at 20 000 rpm for 15 min. The supernatant served as en-zyme extract.
The reaction mixture consisted of 0.1 M sodium phosphate buffer (pH 6.5), 0.1 M catechol as a sub-strate, and the enzyme extract obtained from the callus tissue. The PPO activity was expressed as change in ab-sorbance per min per mg of protein at 495 nm at 30 s in-tervals for 5 min. The protein content was determined according to the Bradford method (Bradford, 1976), with a standard curve prepared using bovine serum albumin.
Peroxidase (POD) enzyme assay
Peroxidase activity was determined by measuring the appearance of brown color resulting from oxidation of guaiacol as a substrate in the presence of hydrogen per-oxide according to the method of Zieslin and Ben-Zaken (1993). The reaction mixture consisting of 0.02 M
guaia-col, 0.38 M H2O2, and 0.2 M sodium phosphate buffer
(pH 5.8), was added to 50 μl of enzyme extract. The
ab-sorbance was measured after every 1 min for 5 min at 470 nm, and enzyme activity was determined on the
basis of the increase in absorbance by 1.0 at 470 nm per
min at 25EC and the specific activity of POD was
expres-sed as unit per mg protein. The protein content was de-termined according to the Bradford method (Bradford, 1976), with a standard curve prepared using BSA.
2,2-diphenyl-1-picrylhydrazyl (DPPH)• radical scavenging activity
The antioxidant activity of the callus extracts was
measured on the basis of its DPPH• radical scavenging
potential as outlined by Yu et al. (2003). Calli were in-cubated with 3.5 ml of freshly prepared DPPH methanol solution in a dark at room temperature for 30 min, and the absorbance was measured at 517 nm using a
spectro-photometer. The inhibition of DPPH• in percentage (I%)
of each sample was calculated from the decrease of ab-sorbance according to the following formula (Savatovic et al., 2012):
I% = [(Ablank! Asample) / Ablank ] × 100
Where, Ablank is the absorbance of the blank consisting of
DPPH in aqueous methanol; Asample is the absorbance of
different extracts.
Reducing power assay
Callus extracts were tested for their reducing power
by assessing the amount of reduction of the Fe3+ into
Fe2+ according the method described by Hinneburg et al.
(2006). One ml of enzyme extracts was mixed with
200 mM phosphate buffer (pH 6.6) and 1% potassium
ferricyanide, and incubated at 50EC for 20 min. The
mix-ture was supplemented with 10% trichloroacetic acid and centrifuged at 3000 rpm for 10 min. An aliquot of super-natant was mixed with 2.5 ml of distilled water and 0.1%
FeCl3 and the absorbance was measured
spectrophoto-metrically at 700 nm. A higher absorbance of the re-action mixture indicated a higher reductive potential. The absorbance of the reaction mixture was considered as a direct measure of its reducing power.
Statistical analysis
All data were analyzed by one-way ANOVA. Tukey’s test was used to separate the means, where the effects of
the treatments were statistically significant (P # 0.05).
Results and discussion
Elicitation of anticancerous compounds licochalcone A, liquirtigenin, and licoisoflavone B
This is the very first report of the elicitation of anti-cancerous compounds licoisoflavone B, licochalcone A,
and liquirtigenin from G. glabra callus cultures. The
re-tention time, fragmentation pattern (m/z) and significant ions from mass spectra of licoisoflavone B, licochal-cone A, and liquirtigenin obtained through GC-MS
ana-lysis of G. glabra callus are shown in Table 1.
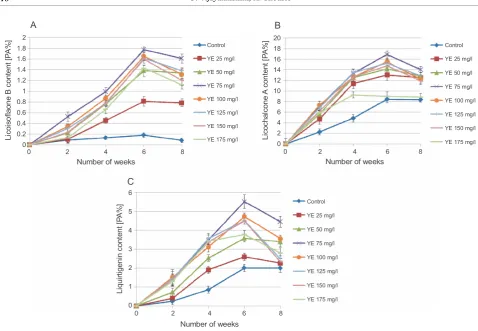
The production of all the three compounds was signi-ficantly enhanced by eliciting the callus cultures with YE. Licoisoflavone B, licochalcone A, and liquirtigenin pro-duction increased with increasing concentrations of the YE and maximized at 75 mg/l YE treatment (Table 2). There was a remarkable increase in the licoisoflavone B production (9.86-fold) as compared to that of the untrea-ted callus, whereas the production of licochalcone A and liquirtigenin showed an increase of 2 and 2.69-folds, res-pectively (Fig. 1). Beyond 75 mg/l YE concentration, the production of flavonoids was either not much affected, or decreased. The optimum YE concentration that signifi-cantly favored the production of the three anti-cancerous flavonoids was found to be 75 mg/l. Further increasing the concentrations of YE for elicitation did not affect the
flavonoid production in callus cultures of G. glabra, and
the use of more than 150 mg/l YE inhibited the growth of callus.
YE has been used as an elicitor in many studies, to enhance the production of various secondary
metabo-lites in tissue cultures of G. glabra and Glycyrrhiza
echi-nata. Flavonoid production in cultured cells of G.
echi-nata was reported to be promoted by the addition of YE (Ayabe et al., 1986). Hyashi et al. (2003 and 2005) repor-ted that YE promorepor-ted butulinic acid accumulation in
cultured cells of G. glabra. In many studies, YE has also
been used to enhance the production of various secondary metabolites in tissue cultures of other plants (Cakir and Ari, 2008; Hong et al., 2012; EI-Nabarawy et al., 2015). These reports also state that very high concentrations of YE do not favor secondary metabolite production which is in accordance with the results obtained in this study.
The production of anti-cancerous compounds
licoiso-flavone B, licochalcone A, and liquirtigenin in G. glabra
callus was not only influenced by the elicitor concentra-tion but was also found to depend on the time duraconcentra-tion
of elicitor treatment (Vijayalakshmi and Shourie, 2015). This led us to perform the timecourse analysis of flavo-noid production at all the tested concentrations of YE
(Fig. 2). In vitro production of all three flavonoids
star-ted within two weeks of the elicitor treatment as com-pared to the control. Maximum production was achieved at 6 weeks, beyond which a slow decrease in the produc-tion of licoisoflavone B, licochalcone A, and liquirtigenin was observed. Moreover, samples treated with 125 mg/l and 150 mg/l of yeast extracts showed a drastic decrease (2-fold) in liquirtigenin production after 7 weeks. These results indicate that prolonged stress due to elicitor treatment adversely affects the viability of callus cells, leading to the deterioration of the culture and a con-sequent decrease in metabolite production. A feedback inhibition of the flavonoid biosynthesis pathway by the three product flavonoids licoisoflavone B, licochalcone A, and liquirtigenin can also be one of the probable reasons for the reduction in flavonoid production.
Effect of YE on callus growth
The addition of YE to the GCC medium had a remar-kable effect on callus growth. The GI of callus was signi-ficantly increased when treated with YE within the con-centration range of 25–150 mg/l, as compared to that of untreated cultures (Fig. 3). A noticeably high GI (9.42) was obtained with 150 mg/l YE which was obtained at 6 weeks of culture. Due to its high amino acid content YE is commonly used as a supplement to promote plant growth (George et al., 2008), and as a biotic elicitor for the induction and enhancement of secondary metabolite production (Naik and Al-Khayri, 2016). In this study, YE concentration up to 150 mg/l promoted the callus growth but a higher concentration (175 mg/l) inhibited further growth, and decreased GI (GI = 5.54), which was probably due to nitrogen toxification and chlorosis, indi-cating biotic stress in the callus (Abass, 2016).
The callus treated with YE concentration of 175 mg/l showed signs of serious morphological abnormalities such as chlorosis, tissue browning, and rapid sene-scence. Such types of abnormalities were also detected
in tissue cultures of Curcuma mangga (Abraham et al.,
2011) and in Glehnia littoralis tissue culturesafter they
were exposed to higher concentrations of YE, while the production of secondary metabolite caffeic acid and feru-lic acid increased in appreciable amounts (more than
1 2
3
Table 1. Retention time, fragmentation pattern (m/z), and significant ions from mass spectra
of licoisoflavone B, licochalcone A, and liquirtigenin
Compound [min]RT Molecular ion[M+] Significant ions [m/z]
Licoisoflavone B 27.1 352 139, 151, 165, 193, 222, 250, 27, 280, 352 Licochalcone A 30.3 338 121, 177,189, 277,307, 308, 323, 338 Liquirtigenin 30.7 256 39, 51, 69, 104, 124, 152, 179, 238, 256
Table 2. Influence of different concentrations of yeast extract (YE) on the production of flavonoids licoisoflavone B,
licochalcone A, and liquirtigenin in a callus culture of G. glabra with maximum growth index YE
concentration [mg/l]
Licoisoflavone B
[Peak area %] Licochalcone A[Peak area %] [Peak area %]Liquirtigenin
0 0.18 ± 0.013a 8.43 ± 1.131a 2.05 ± 0.417a
25 0.812 ± 0.226b 13.02 ± 2.253b 2.60 ± 0.525b
50 1.384 ± 0.295c 14.15 ± 2.173b 3.58 ± 0.311c
75 1.776 ± 0.204d 16.86 ± 4.524c 5.51 ± 0.403d
100 1.654 ± 0.132de 15.52 ± 2.452d 4.73 ± 0.254e
125 1.614 ± 0.411de 15.23 ± 3.496d 4.51 ± 0.278e
150 1.60 ± 0.261e 14.73 ± 1.266b 4.49 ± 0.726e
175 1.43 ± 0.231f 9.23 ± 2.781a 3.78 ± 0.887c
Values represent mean ± SD (n = 3); means followed by different letters are significantly different at α = 0.05
Fig. 1. Comparative gas chromatography mass spectrometry
profile of control (black) and treated (pink) (75 mg/l yeast extract (YE) samples of Glycyrrhiza glabra callus; peaks 1, 2, and 3 represent licoisoflavone B (RT = 27.1), licochalcone A
(RT = 30.3), and liquirtigenin (RT = 30.7)
Effect of the YE on PAL
PAL is an entry-point enzyme of the phenylpropanoid pathway (Zhang and Liu, 2015). An increase in PAL activity in plants has been shown to be an immediate response to pathogens, elicitors, and adverse environ-mental factors (Zhang and Liu, 2015). A rapid synthesis of phenolic compounds, including flavonoids, is
sugges-ted to be an important plant defense response against such factors (Kulbat, 2016); therefore, it is expected that PAL activity changes in plants will affect phenylpropa-noid biosynthesis.
In this study, a significant increase in PAL activity in
the samples as compared to that of control (P < 0.05)
was observed, especially at concentrations 100 mg/l, 125 mg/l, and 150 mg/l with PAL activity of 9.32, 9.77,
and 9.76 U mg!1 protein, respectively (Fig. 4A). The
time-course analysis of PAL activity for all elicitor
treat-ments revealed that the maximum activity (9.77 U mg!1
protein) was attained with 125 mg/l YE treatment at 6 weeks (Fig. 4B). An increase in PAL activity could often be considered as a marker of plant cell response towards stress induced by exogenous treatment of YE, which is known to elicit certain genes involved in flavo-noid synthesis (Ramakrishna and Ravishankar, 2011).
Effect of the YE on PPO and POD activities
2 1.8 1.6 1.4 1.2 1 0.8 0.6 0.4 0.2 0
0 2 4 6 8
Number of weeks
Li
coi
so
fla
on
e B
c
on
te
nt
[P
A
%
]
Number of weeks
0 2 4 6 8
Control
YE 25 mg/l
YE 50 mg/l
YE 75 mg/l
YE 100 mg/l
YE 125 mg/l
YE 150 mg/l
YE 175 mg/l Control
YE 25 mg/l
YE 50 mg/l
YE 75 mg/l
YE 100 mg/l
YE 125 mg/l
YE 150 mg/l
YE 175 mg/l Li
co
ch
al
co
n
e A
c
on
ten
t [
P
A%
] 20 18 16 14 12 10 8 6 4 2 0
Control
YE 25 mg/l
YE 50 mg/l
YE 75 mg/l
YE 100 mg/l
YE 125 mg/l
YE 150 mg/l
YE 175 mg/l
0 2 4 6 8
Number of weeks
6
5
4
3
2
1
0
Li
qu
irt
igen
in
c
ont
en
t [
P
A%
]
C
A B
Control
YE 25 mg/l
YE 50 mg/l
YE 75 mg/l
YE 100 mg/l
YE 125 mg/l
YE 150 mg/l
YE 175 mg/l
0 1 2 3 4 5 6 7 8 12
10
8
6
4
2
0
Gr
o
w
th
in
d
ex
[
G
I]
Number of weeks
Fig. 2. Time-course analysis of A) licoisoflavone B; B) licochalcone A;
C) liquirtigenin production at different concentrations of yeast extract treatment
Fig. 3. Effect of different concentrations of YE on callus growth; values are represented as mean ± SD (n = 2 0); values marked with different letters are significantly different from
each other and from the control
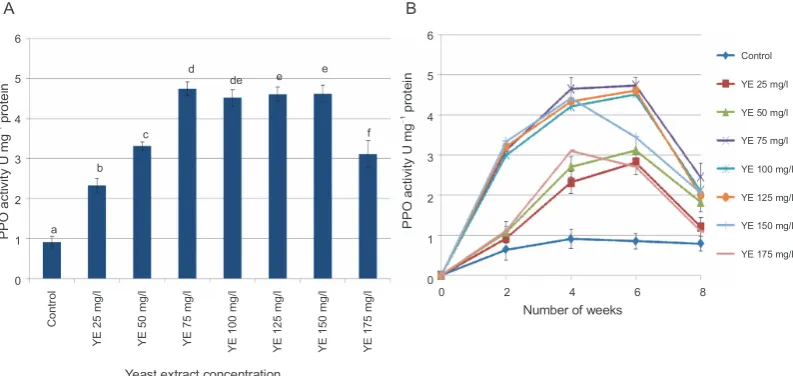
in PPO activity in response to YE treatment are shown in Figure 5. PPO activity increased as compared to that of control in all the treated callus cultures. The
maxi-mum increase in the PPO enzyme activity (4.74 U mg!1
protein) was observed in callus samples elicited with 75 mg/l YE, followed by a very slight decrease at higher
concentrations of the elicitor. At 150 mg/l (3.25 U mg!1
protein), and 175 mg/l (2.71 U mg!1 protein) of YE
sup-plementation, the decrease was observed quite early, within 4 weeks.
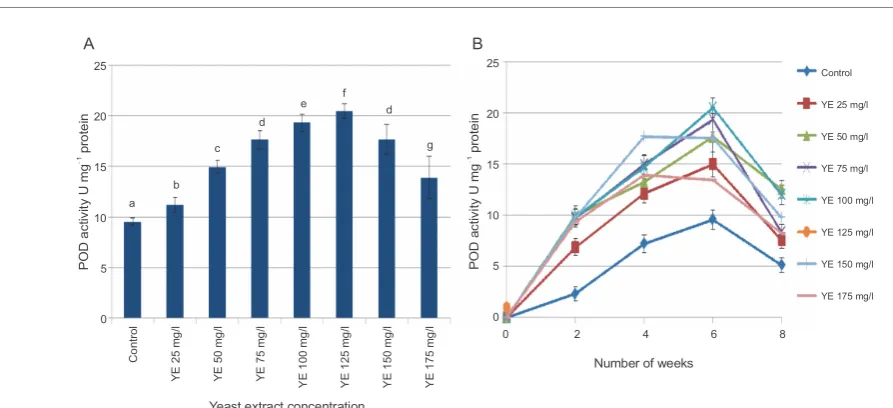
POD is another antioxidant enzyme that contributes to the formation of defense barriers against stress by scavenging hydrogen peroxide and reducing oxidative stress (Pourcel et al., 2007). In GCCs treated with YE, the POD activity was greatly affected at all elicitor con-centrations. There was a gradual increase in the peroxi-dase activity with increasing concentrations of YE from 25 mg/l up to 125 mg/l. The POD activity nearly doubled
(20 units mg!1 protein) at 125 mg/l YE when compared
to that of control (9.56 U mg!1 protein). Peroxidase
acti-vity started decreasing at higher concentrations of YE
(150 mg/l and 175 mg/l) to 16.5 U mg!1, and 13.2 U mg!1
Control
YE 25 mg/l
YE 50 mg/l
YE 75 mg/l
YE 100 mg/l
YE 125 mg/l
YE 150 mg/l
YE 175 mg/l
0 2 4 6 8
Number of weeks
12 10 8 6 4 2 0 P A L ac tiv ity U m g p ro te in ! 1 10 8 6 4 2 0 a a b c
d e e d
Yeast extract concentration
C ont ro l Y E 25 m g/ l Y E 50 m g/ l Y E 75 m g/ l Y E 100 m g/ l Y E 125 m g/ l Y E 150 m g/ l Y E 175 m g/ l P A L ac tiv ity U m g pr ot e in ! 1
A B
0 2 4 6 8
Number of weeks
Yeast extract concentration
Cont ro l Y E 25 mg/ l Y E 50 mg/ l Y E 75 mg/ l Y E 100 mg/ l Y E 125 mg/ l Y E 150 mg/ l Y E 175 mg/ l Control
YE 25 mg/l
YE 50 mg/l
YE 75 mg/l
YE 100 mg/l
YE 125 mg/l
YE 150 mg/l
YE 175 mg/l
P P O ac tiv ity U m g p rot ei n ! 1 P P O a cti vi ty U m g p ro te in ! 1 6 5 4 3 2 1 0 6 5 4 3 2 1 0 a b c d
de e e
f
A B
Fig. 4. A) Effect of different concentrations of YE treatment on phenylalanine ammonia lyase (PAL) activity; B) Time-course
changes in PAL activity at different concentrations of YE; values represent mean ± SD (n = 3); values marked with different letters are significantly different from each other and from the control
Fig. 5. A) Effect of different concentrations of YE treatment on polyphenoloxidase (PPO) activity; B) time-course changes in
PPO activity at different concentrations of YE; values represent mean ± SD (n =3); values marked with different letters are significantly different from each other and from the control
Changes in the POD activity of all YE treated samples were significantly different from those of the control (Fig. 6A). Time-course analysis revealed that the maxi-mum POD activity was observed at 6 weeks with all YE
concentrationsranging from 25mg/l to 125mg/l (Fig. 6B).
At YE concentrations of 150 mg/l and 175 mg/l, POD
acti-vities started to decline (19.7 Umg!1 and 17.2 Umg!1
pro-tein, respectively) after 4 weeks (Fig. 6B).
Such an early decrease in the activities of the anti-oxidant enzymes PPO and POD at higher concentrations (150 mg/l and 175 mg/l ) of YE might be due to the fact
that the callus cultures are adversely affected at high concentrations of YE. The stress posed by the YE eli-citor proves to be detrimental and impacts many vital proteins involved in the metabolism, disrupting defense processes such as antioxidant enzyme activities and declining flavonoid production.
Effect of YE on the antioxidant activity of G. glabra callus extracts
Yeast extract concentration Cont ro l Y E 2 5 m g/l Y E 5 0 m g/l Y E 7 5 m g/l Y E 10 0 m g/ l Y E 12 5 m g/ l Y E 15 0 m g/ l Y E 17 5 m g/ l Control
YE 25 mg/l
YE 50 mg/l
YE 75 mg/l
YE 100 mg/l
YE 125 mg/l
YE 150 mg/l
YE 175 mg/l
0 2 4 6 8
Number of weeks
DP P H a cti vi ty [I % ] DP P H a ct iv ity [ I% ] 100 90 80 70 60 50 40 30 20 10 0 100 90 80 70 60 50 40 30 20 10 0 a b
c c d
a e
f
A B
P O D ac tiv ity U m g p rot ei n ! 1 P O D ac tiv ity U m g p ro te in ! 1 25 20 15 10 5 0 25 20 15 10 5 0
Yeast extract concentration
Co nt ro l Y E 2 5 m g /l Y E 5 0 m g /l Y E 7 5 m g /l Y E 1 00 m g /l Y E 1 25 m g /l Y E 1 50 m g /l Y E 1 75 m g /l
Number of weeks
0 2 4 6 8 Control
YE 25 mg/l
YE 50 mg/l
YE 75 mg/l
YE 100 mg/l
YE 125 mg/l
YE 150 mg/l
YE 175 mg/l a
b c
d
e f d
g
A B
Fig. 6. A) Effect of different concentrations of YE treatment on peroxidase (POD) activity; B) time-course changes in POD
activity at different concentrations of YE; values represent mean ± SD (n =3); values marked with different letters are significantly different from each other and from the control
Fig. 7. A) Effect of different concentrations of YE treatment on 2,2-diphenyl-1-picrylhydrazylscavenging activity; B) time-course
changes in radical scavenging activity at different concentrations of YE; values represent mean ± SD values marked with different letters are significantly different from each other and from the control
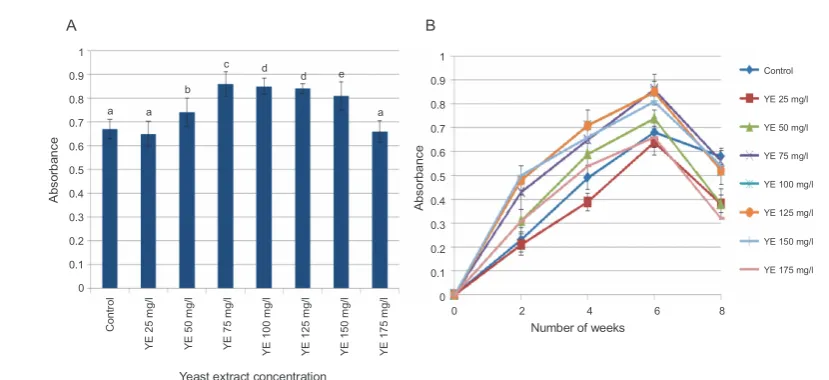
properties (Panche et al., 2016). DPPH• radical
scaven-ging activity of flavonoids was used as a direct measure of the antioxidant potential of flavonoids in elicited callus
cultures of G. glabra. Callus extracts treated with YE
concentrations (from 25 to 125 mg/l) showed a
signifi-cant increase in DPPH• radical scavenging activity when
compared to that of control and the highest DPPH•
radical scavenging activity (I % = 88) was obtained with 75 mg/l YE (Fig. 7A). Time-course analysis showed that
the maximum DPPH• scavenging potential (I% = 73.1) of
the callus extracts treated with 25 mg/l YE was observed at 8 weeks, and for the rest of the treatments at 6 weeks of culture (Fig. 7B).
The YE-treated callus were also examined for their reducing power by assessing the amount of the
reduc-tion of Fe3+ to Fe2+ (Fig. 8). The reducing power of the
patho-Yeast extract concentration
Con
tr
ol
Y
E
2
5 m
g
/l
Y
E
5
0 m
g
/l
Y
E
7
5 m
g
/l
Y
E
10
0 m
g
/l
Y
E
12
5 m
g
/l
Y
E
15
0 m
g
/l
Y
E
17
5 m
g
/l
A
bs
or
b
an
ce
A
bso
rb
an
ce
1
0.9
0.8
0.7
0.6
0.5
0.4
0.3
0.2
0.1
0
1
0.9
0.8
0.7
0.6
0.5
0.4
0.3
0.2
0.1
0
0 2 4 6 8
Number of weeks
Control
YE 25 mg/l
YE 50 mg/l
YE 75 mg/l
YE 100 mg/l
YE 125 mg/l
YE 150 mg/l
YE 175 mg/l
a a
b
c d
d e
a
A B
Fig. 8. A) Effect of different concentrations of YE treatment on reducing power; B) time-course change in reducing power at
different concentrations of YE; values represent mean ± SD (n = 3); values marked with different letters are significantly different from each other and from the control
gen attack or a wound signal which triggers the defense response in plants by inducing oxidative burst (Mani-vannan et al., 2016). The oxidative perturbation in the cells further results in the accumulation of reactive
oxy-gen species (O2G and H2O2). Antioxidants provide the
first line of defense against elevated levels of ROS. Therefore, the elicitor increased the accumulation of major antioxidant compounds such as flavonoids in cal-lus cultures. In the present study, the result of the free radical scavenging activity was in accordance with flavo-noid contents, which suggests that these are potent anti-oxidants and free radical scavengers.
Conclusions
The elicitation of GCCs with the biotic elicitor YE caused an early and direct defense response due to the activation of phenylpropanoid metabolism and signi-ficantly enhanced the synthesis of therapeutically im-portant flavonoids licoisoflavone B, licochalcone A, and liquirtigenin. It has been previously reported that sup-plementation of YE as an elicitor in callus not only en-hanced the production of flavonoids and phenolic com-pounds, but also induced PAL activity (Al-Gendy et al., 2016). In the present research, the secondary
metabo-lism in G. glabra callus was effectively upregulated while
supplementing 75 mg/l YE as elicitor, and more than 2-fold increase in each of the three anti-cancerous flavo-noids was obtained. The maximum production of these flavonoids occurred at the callus age of 6 weeks when
the cultures were at their highest GI and showed the highest levels of metabolic activity. An exogenous appli-cation of the YE elicitor triggered a defense response in plants by inducing an oxidative burst, consequently elici-ting the activity of antioxidant enzymes PPO and POD. The oxidative perturbation in the cells also resulted in the over-production and simultaneous accumulation of the three flavonoids, which could scavenge the free radi-cals and combat the elicitor stress.
Higher concentrations of YE (125–175 mg/l) not only induced apoptotic events strongly, but were also instru-mental in expediting the senescence and decline of the cultures, resulting in decrease in the production of the flavonoids. Thus, it was concluded that 75 mg/l of YE proved to be the most effective elicitor concentration for obtaining enhanced production of anti-cancerous flavo-noids licoisoflavone B, licochalcone A, and liquirtigenin in G. glabra callus cultures.
Acknowledgments
The authors are thankful to Mr. Ajai Kumar, Advanced mentation Research Facility (AIRF), University Science Instru-mentation Centre, JNU, New Delhi, for his support which enabled us to carry out the GC-MS analysis of the sample.
References
Abass M.H. (2016) Responses of date palm (Phoenix
dactyli-fera L.) callus to biotic and abiotic stresses. Emirates J.
Food Agric. 11: 66–74.
pro-liferation, morphology and antioxidant activity of Curcuma
mangga in vitro plantlets. Afr. J. Biotechnol. 10: 7787–7795.
Adam A.L., Bestwick C.S., Barna B., Mansfield J.W. (1995) En-zymes regulating the accumulation of active oxygen spe-cies during the hypersensitive reaction of bean to
Pseudo-monas syringae pv. Phaseolicola.Planta 97:240–249.
Al-Gendy A.A., Ali R.M., Hamdan D.I. and Abdel-Ghani A.E.S. (2016) Elicitation induced flavonoids, phenolic constituents, antioxidant and cytotoxic activities of Artemisia
mono-sperma callus cultures. J. Med. Plants Res. 10: 717–731.
Ayebe S., Iida K., Furaya T. (1986) Stress-induced formation of echinatin and a metabolite, 5-prenyl-licodione, in
cultu-red Glycyrrhiza echinata cells. Phytochem. 25: 2803–2806.
Bradford M.M. (1976) A rapid and sensitive method for the quantitation of microgram quantities of protein utilizing
the principle of protein-dye binding. Analyt. Biochem. 72:
248–254.
Cakir O., Ari S. (2009) Defensive and secondary metabolism in Astragalus chrysochlorus cell cultures, in response to
yeast extract stressor. J. Environ. Biol. 30: 51–55.
Chen H., Chen F., Chiu F.C.K., Lo C.M.Y. (2001) The effect of yeast elicitor on the growth and secondary metabolism of
hairy root cultures of Salvia miltiorrhiza. Enzym. Microb.
Technol. 28: 100–105.
Chen X., Liu Z., Meng R., Shi C., Guo N. (2017) Antioxidative and anticancer properties of Licochalcone A from lico-rice. J. Ethnopharmacol. 198: 331–337.
Chittoor J.M., Leach J.E., White F.F. (1997) Differential in-duction of a peroxidase gene family during infection of rice
by Xanthomonas oryzae pv. oryzae. Mol. Plant Microbe
Interact. 1: 861–871.
El-Nabarawy M.A., El-Kafafi S.H., Hamza M.A., Omar M.A. (2015) The effect of some factors on stimulating the growth and production of active substances in Zingiber
officinale callus cultures. Ann. Agricult. Sci. 60: 1–9.
Fu Y., Hsieh T.C., Guo J., Kunicki J., Lee M.Y., Darzynkiewicz Z., Wu J.M. (2004) Licochalcone-A, a novel flavonoid isolated from licorice root (Glycyrrhiza glabra), causes G2 and late-G1 arrests in androgen-independent PC-3 prostate cancer
cells. Biochem. Biophys. Res. Commun. 322: 263–270.
George E.F., Hall M.A., Klerk G.J. (2008) The components of plant tissue culture media II: organic additions, osmotic
and pH effects, and support systems. [in:] Plant
propaga-tion by tissue culture. Ed. George E.F., Hall M.A., De
Klerk G.J., 3rd ed. Springer: 115–173.
Hayashi H., Huang P., Inoue K. (2003) Up-regulation of soya-saponin biosynthesis by methyl Jasmonate in cultured cells
of Glycyrrhiza glabra. Plant Cell Physiol. 44: 404–411.
Hayashi H., Hiraoka N., Ikeshiro Y. (2005) Differential regula-tion of soyasaponin and betulinic acid producregula-tion by yeast
extract in cultured licorice cells. Plant Biotechnol. 22:
242–244.
Hinneburg I., Dorman H.D., Hiltunen R. (2006) Antioxidant activities of extracts from selected culinary herbs and spi-ces. Food chem. 97: 122–129.
Hong M.L.K., Bhatt A.R.V.I.N.D., Ping N.S., Keng C.L. (2012)
Detection of elicitation effect on Hyoscyamus niger L. root
cultures for the root growth and production of tropane
alkaloids. Rom. Biotech. Lett. 17: 7340–7351.
Inami K., Mine Y., Tatsuzaki J., Mori C., Mochizuki M. (2017)
Isolation and characterization of antimutagenic compo-nents of Glycyrrhiza aspera against
N-methyl-N-nitro-sourea. Genes Environment. 39: 5.
Ishikava A., Kitamura Y., Ozeki Y., Watanabe M. (2007) Diffe-rent responses of shoot and root cultures of Glehnia
litto-ralis to yeast extract. J. Nat. Med. 61: 30–37.
Iqbal J., Abbasi B.A., Mahmood T., Kanwal S., Ali B., Shah S.A., Khalil A.T. (2017) Plant-derived anticancer agents: A
green anticancer approach. Asian Pacific J. Tropical
Bio-med. 7: 1129–1150.
Jacobs E.C. (2018) Potential therapeutic effects of phytoche-micals and medicinal herbs for cancer prevention and
treatment. Arch. General Internal Med. 2: 44–48.
Liu C., Wang Y., Xie S., Zhou Y., Ren X., Li X., Cai Y. (2011)
Liquiritigenin induces mitochondria-mediated apoptosis via cytochrome c release and caspases activation in HeLa
Cells. Phytother. Res. 25: 277–283.
Ma X., Yu H. (2006) Cancer issue: global burden of cancer. The Yale J. Biol. Med. 79: 85–96.
Milosevic N., Slusarenko A.J. (1996) Active oxygen meta-bolism and lignification in the hypersensitive response in
bean. Physiol. Mol. Plant Pathol. 49: 143–158.
Naik P.M., Al–Khayri J.M. (2016) Abiotic and biotic elicitors – role in secondary metabolites production through in
vitro culture of medicinal plants. [in:] Abiotic and biotic
stress in plants-recent advances and future perspectives.
IntechOpen.
Panche A.N., Diwan A.D., Chandra S.R. (2016) Flavonoids: an
overview. J. Nutrit. Sci. 5: 11–19.
Park M.R., Kim S.G., Cho I.A., Oh D., Kang K.R., Lee S.Y., Moon S.M., Cho S.S., Yoon G., Kim C.S., Oh J.S. (2015)
Licochalcone-A induces intrinsic and extrinsic apoptosis via ERK1/2 and p38 phosphorylation-mediated TRAIL expression in head and neck squamous carcinoma FaDu
cells. Food Chem. Toxicol. 77: 34–43.
Pourcel L., Routaboul J.M., Cheynier V., Lepiniec L., Debeau-jon I. (2007) Flavonoid oxidation in plants: from
biochemi-cal properties to physiologibiochemi-cal functions. Trends Plant Sci.
12: 29–36.
Ramakrishna A., Ravishankar G.A. (2011) Influence of abiotic
stress signals on secondary metabolites in plants. Plant
Signal. Behavior 6: 1720–1731.
Savatovic S.M., Cetković G.S., Canadanović-Brunet J.M., Sjilas S.M. (2012) Kinetic behaviour of the DPPH
radical-sca-venging activity of tomato waste extracts. J. Serb. Chem.
Soc.77: 1381–1389.
Schneider S., Ullrich W.R. (1994) Differential induction of re-sistance and enhanced enzyme activities in cucumber and tobacco caused by treatment with various abiotic and
bio-tic inducers. Physiol. Mol. Plant Pathol. 45: 291–304.
Shreya Dave H.A., Jain N.K. (2016) Assessment of anticancer
properties of few medicinal plants. J. Pharmacogn.
Soffan A., Alghamdi S.S., AldawoodA.S.(2014) Peroxidase and polyphenol oxidase activity in moderate resistant and su-sceptible Vicia faba induced by Aphis craccivora
(Hemi-ptera: Aphididae) infestation. J. Insect Sci. 14: 285.
Stewart R.J., Sawyeer B.J.B., Bucheli C.S., Robinson S.P. (2001) Polyphenol oxidase is induced by chilling and
woun-ding pineapple. Aust. J. Plant Physiol. 28 :181–191.
Vijayalakshmi U., Shourie A. (2015) Elicitor induced flavonoid production in callus cultures of Glycyrrhiza glabra and re-gulation of genes encoding enzymes of the
phenylpropa-noid pathway. Der Pharmacia Lett. 7: 156–166.
Vijayalakshmi U., Shourie A. (2016a) Cinnamic acid supple-mentation regulates the production of licochalcone A, liquirtigenin and licoisoflavone B in Glycyrrhiza glabra
cal-lus cultures. Internat. J. Phytomed. 8: 343–352.
Vijayalakshmi U., Shourie A. (2016b) Remedial effect of ascor-bic acid and citric acid on oxidative browning of
Glycyr-rhiza glabra callus cultures. BioTechnologia 97: 179–186.
Vijayalakshmi U., Shourie A. (2017) Standardization of con-ditions for extraction of flavonoids from Glycyrrhiza glabra
callus cultures. Int. J. Pharma. Bio. Sci. 8: 272–277.
Vispute S., Khopade A. (2011) Glycyrrhiza glabra Linn. –
“Klitaka”: a review. Int. J. Pharma. Bio. Sci. 2: 42–51.
Wang H., Oo Khor T., Shu L., Su Z.Y., Fuentes F., Lee J.H., Tony Kong A.N. (2012) Plants vs. cancer: a review on na-tural phytochemicals in preventing and treating cancers
and their druggability. Anti-Cancer Agents Med. Chem. 12:
1281–1305.
Wang D., Lu J., Liu Y., Meng Q., Xie J., Wang Z., Teng L. (2014) Liquiritigenin induces tumor cell death through mitogen-activated protein kinase-(MPAKs-) mediated
path-way in hepatocellular carcinoma cells. BioMed Res.
Inter-nat. 2: 234–248 .
Wuttke W., Jarry H., Seidlová-Wuttke D. (2007) Isoflavones –
safe food additives or dangerous drugs. Ageing Res.
Rev. 6: 150–188.
Yao K., Chen H., Lee M.H., Li H., Ma W., Peng C., Song N.R., Lee K.W., Bode A.M., Dong Z., Dong Z. (2014) Licochal-cone A, a natural inhibitor of c-Jun N-terminal kinase 1.
Cancer Prevent. Res. 7: 139–149.
Zhang Y.Y., Huang C.T., Liu S.M., Wang B., Guo J., Bai J.Q., Fan X.J., Jia Y.S (2016) Licochalcone A exerts antitumor
activity in bladder cancer cell lines and mice models.
Tropical J. Pharmaceut. Res. 15: 1151–1157.
Zhang X., Liu C.J. (2015) Multifaceted regulations of gateway enzyme phenylalanine ammonia-lyase in the biosynthesis
of phenylpropanoids. Mol. Plant. 8: 17–27.
Zhou M., Higo H., Cai Y. (2010) Inhibition of hepatoma 22
tumor by Liquiritigenin. Phytother. Res. 24: 827–833.