1. Introduction
unctional Magnetic resonance imaging (fMRI), a modern technique of imaging, is a powerful non-invasive and safe tool which is used for the study of the function of the brain based on measure of the brain neural activation (Farah, 2002). The fMRI can localize the lo-cation of activity in the brain which is caused due to sensory stimulation or cognitive function (Gabral,
Sil-veira, & Figueredo, 2011). In clinical field, fMRI allows
the researchers to study how are the healthy brain func-tions, how different diseases affect the brain funcfunc-tions, how healthy brain function is recovered after damage and how drugs can control the diseases effect on the
brain activity (Daliri & Behroozi, 2012). In the research field it allows to address these questions: how cognitive
states are encoded in the brain activities and how the human brain represents the conceptual knowledge. The answers to these questions require some softwares for
analysis the fMRI data to extract information about the
different stimuli (Matthews, Shehzad, & Kelly, 2006).
Generated data from fMRI have very large amount. The handling, processing, analysis and visualization of fMRI data are not feasible without computer-based methods. Useful neural information from fMRI data is extracted with research, development, and operation of these methods. Reconstruction, fundamental analysis (motion correction) and visualization tools are embed-ded in softwares controlling modern MRI scanners. Research and development of advanced methods for analysis of accurate activation patterns, physiological modeling based on reality, etc., makes a lively space for development of the large number of fMRI data analysis
tools (Poldrack, Mumford, & Nichols, 2011).
To extract the information from fMRI data it is nec-essary to do global data analysis, and since there are many available options for the data analysis, the fMRI research groups prefer to consider, ‘‘which available
Software Tools for the Analysis of Functional Magnetic
Resonance Imaging
Mehdi Behroozi1,2, Mohammad Reza Daliri1*
1. Biomedical Engineering Department, Faculty of Electrical Engineering, Iran University of Science and Technology (IUST), Tehran, Iran. 2. School of Cognitive Sciences (SCS), Institute for Research in Fundamental Science (IPM), Niavaran, Tehran, Iran.
* Corresponding Author:
Mohammad Reza Daliri, PhD
Biomedical Engineering Department, Faculty ofElectrical Engineering, Iran University of Science andTechnology (IUST), Tehran, Iran. Tel: +98-21-73225738/ Fax: +98-21-73225777
E-mail: [email protected]
Functional magnetic resonance imaging (fMRI) has become the most popular method for imaging of brain functions. Currently, there is a large variety of software packages for the analysis of fMRI data, each providing many features for users. Since there is no single package that can provide all the necessary analyses for the fMRI data, it is helpful to know the features of each software package. In this paper, several software tools have been introduced and they have been evaluated for comparison of their functionality and their features. The description of each program has been discussed and summarized.
A B S T R A C T
Article info:Received: 12 July 2012
First Revision: 7 August 2012
Accepted: 25 August 2012
F
Key Words:
fMRI Software Packages, Preprocessing,
software package will be useful for their needs?’’. In this article, we review the features of different available software packages for fMRI.
The major paradigm for fMRI analysis is the hypoth-esis-driven and voxel-based approach. In this method activation responses to a brain function between the subjects are determined. Normally the multi-step pro-cessing plan is required for the analyses of the fMRI data where the typical steps involve: 1) spatial realign-ment of the individual fMRI scans for head motion correction; 2) co-registration between functional (T2* weighted) and anatomical (T1 weighted image with high spatial resolution) scans; 3) spatial normalization of the subjects involved in the study into standard brain atlas (multi subject analysis), e.g., based on anatomical MRs of different subjects; 4) spatial smoothing; 5) per-forming the statistical parametric maps in which they show the effect of a behavioral brain function in each
voxel; 6) finally using a statistical test on these effects
and reporting the activated voxels. A number of pub-licly available packages have functions for most of the necessary processing steps: SPM, FSL, AFNI, DPTools, BrainVoyager, VoxBo and etc. (see Table 1).
The features of software package that must be consid-ered for the fMRI data analysis include:
• Address/availability: the URL for each software package involves information whether the package is commercially or freely available or shareware.
• Platform/operating system: which software and hardware is required for each package installation.
• Preprocessing: Before statistical analysis and sig-nal detection, it is necessary to convert the fMRI raw data to a form known by each software package and to improve the signal quality by preprocessing the raw data obtained from the MRI scanner, including artifact detection, baseline correction, realignment, movement correction, co-registration, normalization, and smoothing.
• Input of data: the software is able to load the 2D, 3D, and 4D images.
• Image display: this feature includes image manipu-lation tools, output options(e.g. regions, locations, and size), summary statistics, post hoc analyses, and whether the image cloud be viewed in three orthogo-nal planes.
• Region of interest (ROI) analysis: in this method
brain activity signal is extracted from specific region
of interest and each area of the brain is analyzed sepa-rately.
• Statistical model: which statistical methods are used for the analysis: parametric models or the non-parametric methods?
In this study we evaluated several software packages that are used for the analysis of the fMRI data.
2. SPM (Statistical Parametric Mapping)
Statistical Parametric Mapping is a statistical technique to determine the difference in recorded brain activity by construction of spatially extended statistical processes used to test hypotheses during the functional neuroimag-ing experiments usneuroimag-ing neuroimagneuroimag-ing technologies (Penny et al., 2006). These ideas have been included in a software that is called SPM. Brain imaging data sequences are ap-plied to SPM software for the analysis. The sequences can be a series of images from different subjects, or time-series from the same subject. The current package is designed for the analysis of fMRI, PET1, SPECT2 , EEG3 and MEG4 . SPM was developed by members and collaborators of the Wellcome Trust Centre for Neuroimaging for analyz-ing functional imaganalyz-ing data. SPM is made freely available to the neuroimaging community across laboratories. The software is a complete analysis package that represents the implementation of the theoretical concepts of Statistical Parametric Mapping. The SPM software is a MATLAB (The MathWorks, Inc) based functions and subroutines with some externally compiled C routines. The current version of SPM is SPM8. It is available for all versions, both 32 and 64 bit version of MATLAB.
2.1. SPM Analysis Steps (Fig 1)
2.1.1. Temporal Processing:
This Step Includes the Following Operation
• Slice timing: in this step, sessions are corrected for the differences in image acquisition time between the slices. The parameters that we need to know for do-ing this session are number of slice, TR 5, TA 6, slice order, and reference slice.
2.1.2. Spatial Processing:
This Step May Include
• Realign: in this session all time-series of images are
realigned to the first functional image, so that the po -sition of the brain during the time is same. For doing 1. Positron emission tomography
2. Single-photon emission computed tomography 3. Electroencephalography
4. Magnitoencphalograhy 5. Time Repetition
this step a least squares approach with a 6 parameter (rigid body) spatial transformation is used. A rigid-body transformation (in 3D) can be parameterized by three translation and three rotation parameters about the different axes. The aim is primarily to remove movement artifact in fMRI data (Friston et al., 1995).
• Co-registration: in this session time-series of func-tional images are aligned into the anatomical images within-subjects. Doing this session needs a rigid-body model. You get the options of estimating the trans-formation, re-slicing images according to some rig-id-body transformations, or estimating and applying rigid-body transformations (Collignon et al., 1995).
• Segmentation: This function is used for the bias correction, spatially normalizing or segmenting the
fMRI data (Ashburner & Friston, 2005).
• Normalization: Vvarious subjects have differ-ent brain size. In group analysis it is necessary that all brains have the same size and orientation so that brains can be compared in these conditions
(Ashburn-er & Friston 1997).
• Smoothing: for doing this session, image volumes
are convolved with a Gaussian kernel of a specified
width that is caused to increase the overlap of
activa-tion between subjects. It is used as a preprocessing step in multi subject analysis.
2.1.3. fMRI Statistics:
This Step Can Consider the Following Issues
• fMRI model specification: Statistical analysis of fMRI data uses a mass-univariate approach based on General Linear Models (GLMs). It comprises the
following steps (1) specification of the GLM design matrix, fMRI data files and filtering (2) estimation
of GLM parameters using classical or Bayesian ap-proaches and (3) interrogation of results using con-trast vectors to produce Statistical Parametric Maps (SPMs) or Posterior Probability Maps (PPMs) (Lazar 2008).
• fMRI model estimate: Model parameters can be estimated using classical (ReML - Restricted Maxi-mum Likelihood) or Bayesian algorithms (Friston et al., 2002).
3. Brain Voyager
BrainVoyager QX is a powerful neuroimaging
soft-ware package (Goebel, Esposito, & Formesano, 2006).
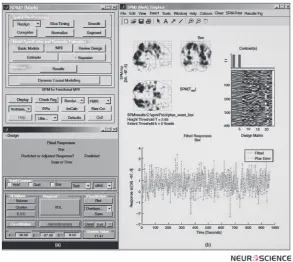
Figure 1. A screen shot of SPM. (a) Two windows used as an interface for design specification and analysis. (b) The activa
-tion map (as a maximum intensity projec-tion, corrected for multiple comparisons using FDR correc-tion (P < 0.05), a graphical
It started as a tool for the analysis of anatomical and functional MRI data sets but it could develop during the years into a multi-modal analysis tool for fMRI, DTI7, TMS8, EEG and MEG data. The software includes univariate (hypothesis driven) and multivariate (data driven) analyses of fMRI time series, several methods to correct for multiple comparisons, and tools to run multi-subject volume and surface-based region of inter-est (ROI) analyses. The software also contains extreme-ly fast and highextreme-ly optimized 2D and 3D anaextreme-lysis and
visualization routines; a comprehensive set of efficient
pre-processing tools, including motion correction,
high-pass filtering and slice scan time correction; volume and
cortex-based hypothesis-driven statistical data analy-sis using the General Linear Model (GLM); random-effects ANCOVA analysis for advanced multi-factorial designs and correlation with external (e.g. behavioral) variables; multi-voxel pattern analysis (MVPA) tools, including support vector machines (SVMs) and recur-sive feature elimination (RFE); analysis of Diffusion-Weighted Imaging (DWI) including combined
visu-alization of tracked fiber bundles with structural and
functional MRI; dynamic statistical thresholding using the False Discovery Rate (FDR) approach for correc-tion of multiple comparisons; cluster-size thresholding for correction of multiple comparisons for volume and surface maps; multi-subject Volume-of-Interest (VOI) and surface Patch-of-Interest (POI) analysis; volume and cortex-based data-driven analysis using Indepen-dent Component Analysis (ICA) performing single run as well as group analyses; cortical thickness analysis for advanced morphometry; automatic co-registration of functional and diffusion-weighted data with high-res-olution 3D anatomical data sets advanced methods for automatic brain segmentation; surface reconstruction,
cortex inflation and flattening; cortex-based inter-subject
alignment based on gyral / sulcal pattern of individual brains going beyond standard volumetric normalization approaches such as Talairach transformation; advanced visualizations of anatomical and functional data sets with real-time GPU-based volume rendering; a real-time neuronavigation module as part of the TMS Neuronavi-gator system.
The software is highly optimized and user friendly running on all major computer platforms including Windows (XP/Vista/7), Linux (i.e. Ubuntu, SUSE, Fe-dora) and Mac OS X (10.6 or higher). It is available for all platforms both a 32 and a 64 bit versions. To ob-tain maximum speed on each platform, BrainVoyager QX has been completely programmed in C++ with op-7. Diffusion tensor image
8. Transcranial magnetic simulation
timized and highly efficient statistical, numerical, and
image processing routines.
BrainVoyager QX provides a comprehensive cross-platform solution embodied in a single product. Data analyzed on one platform - for example Windows - can be moved to another platform - for example Mac OS X on Intel or PowerPC hardware - and processed further without any problem.
3.1. BrainVoyager Analysis Steps (see fig. 2 for a view of the software)( http://support.brainvoy-ager.com/)
3.1.1. Analysis in original space –FMR-STC projects
This step explains how to create BrainVoyager project from raw data. This step may include
• Creation of a functional project: FMR project files are simple text files containing the information defining
a functional project created from raw MRI data, typi-cally from EPI sequences. The actual time course data is
contained in STC ("slice time course") files, which are referenced in the FMR file.
• Creation of the stimulation protocol: stimulation
protocol defines the events at the lengths of presenta -tion of stimuli.
• Statistical tests and time courses: this step
ex-plains how to use statistical test for define which areas of brain active on the FMR file (2D image).
• Preprocessing of FMR projects: a series of math-ematical operations is typically performed prior to statistical data analysis to reduce artifact and noise-related signal components. The most essential steps of these preprocessing operations are: removal of
global signal fluctuations, slice scan timing correc -tion, head motion detection and correc-tion, spatial and temporal smoothing of the data, removal of linear and non-linear trends in voxel time courses (Behroozi et al., 2011).
• Statistical analysis with the General Linear Mod-el (GLM): this step explains how to use GLM to ana-lyze the fMRI data. The GLM goes beyond simple correlation or t-tests by allowing for specifying ad-vanced statistical models containing many explana-tory variables also called “predictors”. In addition, the
fit tells us whether one or more individual explanatory variables contribute significantly to explain the voxel
pre-dictor A is significantly larger (or smaller) than the
estimated effect of a variable B.
3.1.2. Analysis is standard 3D Space-VMR-VTC projects:
This step may include
• Creation of 3D anatomical project: this step ex-plains how to create 3D anatomical projects. The 3D data set will be used in the next step for co-registra-tion with the funcco-registra-tional data.
• Co-registration of functional and anatomical data: this step explains how to align functional slice-based data of an FMR project with a 3D data set. This allows for relating brain activity more easily to ana-tomical locations and it prepares the transformation of the functional data into stereotaxic (Talairach) space.
• Talairach transformation: this step explains how to transform a recorded 3D data set into Talairach space, which is a commonly used “standard” space for reporting locations of activated brain regions and for averaging data across subjects. This step is needed in multi subject analysis.
• 3D-3D alignment: Several experimental designs are needed for acquiring data of one subject in mul-tiple scanning sessions. In this case it is necessary to align the data of all sessions to one high-quality ana-tomical data set. Therefore, this step explains how to automatically align two anatomical 3D data sets with
each other. This allows us to find a mapping between
the intra-session 3D data set and the extra-session high-quality 3D data set. This mapping is another im-portant piece of information to transform our func-tional data into Talairach space.
• Talairach transformation of functional data: this step explains how to transform our functional data into Talairach space. The result of this process is a VTC9 file, containing the data from a corresponding FMR project.
• Statistical analysis of 3D functional data: this step explains how to run statistical tests with VTC func-tional data.
3.1.3. Surface Space Analysis –SRF_MTC projects:
This step may include
• Surface reconstruction of head: this step explains how to invoke a surface module window. The surface module of BrainVoyager QX can be used to create 9. volume time course
advanced 3D renderings and to apply various
surface-based techniques like cortical flattening. Here we will
learn how to create a 3D model of a subject’s head from a 3D MRI data set. The resulting visualizations are in-structive in it-self but they are also important for ad-vanced applications such as the spatial co-registration of a subject’s MRI 3D coordinate system with that ob-tained from other imaging modalities like EEG or MEG.
• Navigation in the surface module window: this step explains how to navigate within the surface window.
• Slicing a polygon: this step explains how to slice a loaded or created polygon mesh. Sliced views of the head or brain provide useful information about the spatial relation of 3D renderings and the 2D images from which they have been built.
• Automatic cortex segmentation: this step explains how to automatically segment and reconstruct the cortex of both hemispheres of the brain.
• Cortex inflation: this step explains how to inflate a
mesh representing the cortical sheet and how to show curvature information of the folded cortex on the
in-flated cortex representation.
• Statistical maps on cortex meshes: this step
ex-plains how to visualize statistical maps on inflated cortex meshes. We will also learn how to define sur -face patches as regions-of-interest, and to invoke time course plots for these regions.
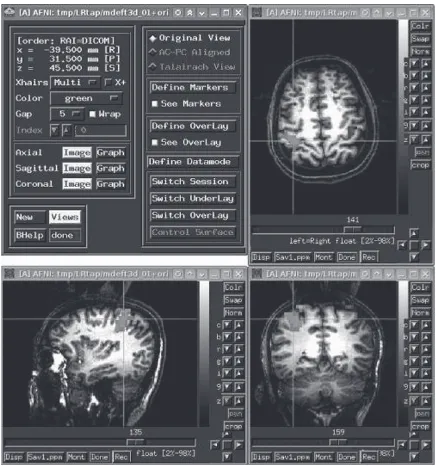
4. AFNI (Analysis of Functional NeuroImages)
The idea of AFNI software was expressed by Robert
Cox for the first time, which was originally developed
and is currently maintained by him at the NIH (see Fig. 3). AFNI is a rich software package for processing and displaying fMRI data (Robert, 1996). AFNI is a power-ful package of C programs that is described for process-ing, analyzprocess-ing, and visualization of three dimensional human brain functional magnetic resonance imaging (fMRI) results. The software can map the neural activa-tion onto higher resoluactiva-tion anatomical scans with differ-ent colors. Slices in each cardinal plane can be viewed simultaneously. Manual placement of markers on ana-tomical landmarks allows transformation of anaana-tomical and functional scans into stereotaxic (Talairach-Tourn-oux) coordinate. Several statistical analysis methods for 3D functional datasets are available in this software. This software has an interface for AC-PC alignment and transformation to Talairach coordinates. It can map the fMRI activation pattern onto 2D and 3D structural (ana-tomical) images. Here, temporal data processing and visualization is utilized. There are different plug-ins for
Fourier and wavelet filtering, real-time fMRI analysis,
histogram generation, and etc.
The programs are written in ANSI C and Motif 1.2. Software can run on UNIX+X11+Motif systems, includ-ing SGI, Solaris, Linux, and Mac OS X. It is available in both source code and binary executable for download. It is freely available software (in C source code format, and some precompiled binaries) for research purposes.
4.1. AFNI Analysis Steps
4.1.1. Preprocessing
The goal of preprocessing is to eliminate different kinds of artifacts such as motion correction.
Pre-pro-cessing consist of spatial or temporal filtering of fMRI
data and improving the image resolution. For apply-ing various processes onto images, initially they must be converted to the format that the software can read them. The raw functional image format from fMRI set is .dcm or .IMA. In AFNI Functional images format are
converted to p-files. After converting, the raw data have
low resolution (64x64) and for statistical analysis, they need to be reconstructed, renamed, made into 3D bricks, reregistered (to head motion correction), deconstructed,
formatted into another type of image file, and normal -ized with MGH and Matlab routines. Although, all the preprocessing steps are the same for Block and Event-Related designs. It is necessary to have programs that
can reconstruct the raw fMRI files and rename them,
so the grecons5x is used for this purpose. The
afnireg-2bshort script can be used to translate files from AFNI
format to MGH format (http://cnl.web.arizona.edu/afni-preprocess.htm).
4.1.2. Anatomical Preprocessing and Centering
These are high resolution (256x256 output) *.MR
files. There are generally 2 series: series 2 with ~ 17 images; series 4 with ~124 images. These *.MR files
are used to make the 3D volume (http://cnl.web.arizona. edu/afnianat.htm).
4.1.3.
4.1.4. Standard Analysis
Standard Analysisis available for analysis of two dif-ferent types of stimulus designs (Block analysis, Event related Analysis) which are used in the studies of fMRI.
4.1.5. Special Analyses
This step may include
• Talairach Realignment: Talairach realignment aligns an individual brain to a standard atlas. Ideally, this allows one to identify anatomical structures based on their absolute Talairach coordinates. This step is needed in multi subject analysis.
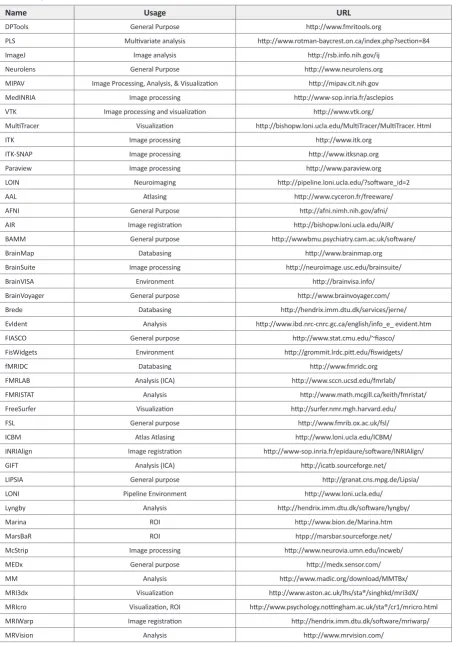
Name Usage URL
DPTools General Purpose http://www.fmritools.org
PLS Multivariate analysis http://www.rotman-baycrest.on.ca/index.php?section=84
ImageJ Image analysis http://rsb.info.nih.gov/ij
Neurolens General Purpose http://www.neurolens.org
MIPAV Image Processing, Analysis, & Visualization http://mipav.cit.nih.gov
MedINRIA Image processing http://www-sop.inria.fr/asclepios
VTK Image processing and visualization http://www.vtk.org/
MultiTracer Visualization http://bishopw.loni.ucla.edu/MultiTracer/MultiTracer. Html
ITK Image processing http://www.itk.org
ITK-SNAP Image processing http://www.itksnap.org
Paraview Image processing http://www.paraview.org
LOIN Neuroimaging http://pipeline.loni.ucla.edu/?software_id=2
AAL Atlasing http://www.cyceron.fr/freeware/
AFNI General Purpose http://afni.nimh.nih.gov/afni/
AIR Image registration http://bishopw.loni.ucla.edu/AIR/
BAMM General purpose http://wwwbmu.psychiatry.cam.ac.uk/software/
BrainMap Databasing http://www.brainmap.org
BrainSuite Image processing http://neuroimage.usc.edu/brainsuite/
BrainVISA Environment http://brainvisa.info/
BrainVoyager General purpose http://www.brainvoyager.com/
Brede Databasing http://hendrix.imm.dtu.dk/services/jerne/
EvIdent Analysis http://www.ibd.nrc-cnrc.gc.ca/english/info_e_ evident.htm
FIASCO General purpose http://www.stat.cmu.edu/~fiasco/
FisWidgets Environment http://grommit.lrdc.pitt.edu/fiswidgets/
fMRIDC Databasing http://www.fmridc.org
FMRLAB Analysis (ICA) http://www.sccn.ucsd.edu/fmrlab/
FMRISTAT Analysis http://www.math.mcgill.ca/keith/fmristat/
FreeSurfer Visualization http://surfer.nmr.mgh.harvard.edu/
FSL General purpose http://www.fmrib.ox.ac.uk/fsl/
ICBM Atlas Atlasing http://www.loni.ucla.edu/ICBM/
INRIAlign Image registration http://www-sop.inria.fr/epidaure/software/INRIAlign/
GIFT Analysis (ICA) http://icatb.sourceforge.net/
LIPSIA General purpose http://granat.cns.mpg.de/Lipsia/
LONI Pipeline Environment http://www.loni.ucla.edu/
Lyngby Analysis http://hendrix.imm.dtu.dk/software/lyngby/
Marina ROI http://www.bion.de/Marina.htm
MarsBaR ROI htpp://marsbar.sourceforge.net/
McStrip Image processing http://www.neurovia.umn.edu/incweb/
MEDx General purpose http://medx.sensor.com/
MM Analysis http://www.madic.org/download/MMTBx/
MRI3dx Visualization http://www.aston.ac.uk/lhs/sta®/singhkd/mri3dX/
MRIcro Visualization, ROI http://www.psychology.nottingham.ac.uk/sta®/cr1/mricro.html
MRIWarp Image registration http://hendrix.imm.dtu.dk/software/mriwarp/
MRVision Analysis http://www.mrvision.com/
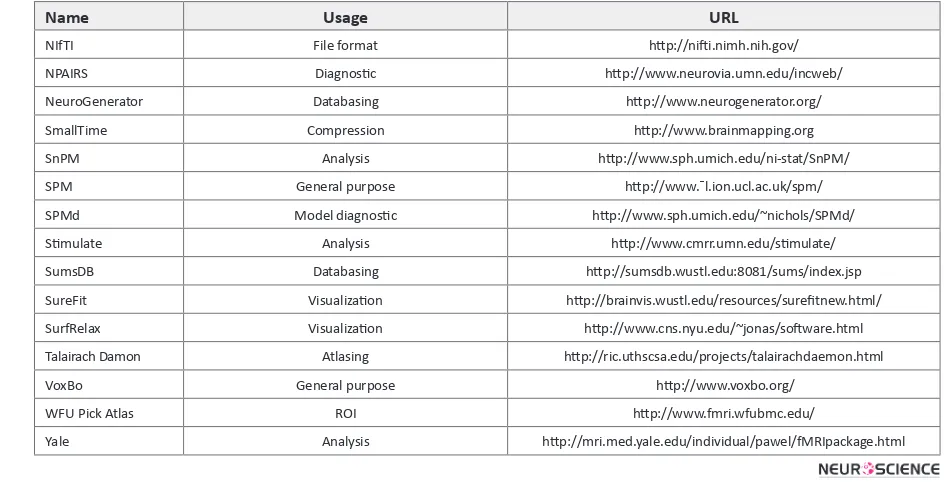
Name Usage URL
NIfTI File format http://nifti.nimh.nih.gov/
NPAIRS Diagnostic http://www.neurovia.umn.edu/incweb/
NeuroGenerator Databasing http://www.neurogenerator.org/
SmallTime Compression http://www.brainmapping.org
SnPM Analysis http://www.sph.umich.edu/ni-stat/SnPM/
SPM General purpose http://www.¯l.ion.ucl.ac.uk/spm/
SPMd Model diagnostic http://www.sph.umich.edu/~nichols/SPMd/
Stimulate Analysis http://www.cmrr.umn.edu/stimulate/
SumsDB Databasing http://sumsdb.wustl.edu:8081/sums/index.jsp
SureFit Visualization http://brainvis.wustl.edu/resources/surefitnew.html/
SurfRelax Visualization http://www.cns.nyu.edu/~jonas/software.html
Talairach Damon Atlasing http://ric.uthscsa.edu/projects/talairachdaemon.html
VoxBo General purpose http://www.voxbo.org/
WFU Pick Atlas ROI http://www.fmri.wfubmc.edu/
Yale Analysis http://mri.med.yale.edu/individual/pawel/fMRIpackage.html
Software Name (Reference to the original paper) Number of References
SPM: Statistical parametric maps in functional imaging: A general linear approach(K.J. Frinston, 1995) 6095
AFNI: Software for analysis and Visualization of Functional Magnetic Resonance Neuroimages.(Robert W. Cox, 1996) 3055
FSL: Advance in functional and structural MR image analysis and implementation as FSL. (Stephen M. Smith, 2004) 1909
AIR: Automated Image Registration: I. General Methods and Instrasubject, Intramodality Validation.
(Roger P. Woods, 1998) 1422
FreeSurfer: Whole brain segmentation: automated labeling of neuroanatomical structures in the human brain.
(B. Fischel, 2002) 1039
MRICRO: Stereotaxi display of brain lesions. (C. Rorden, 2000) 946
fMRLAB: An ICA toolbox for fMRI data analysis(J. R. Duann, 2002) 348
BrainVoyager: Analysis of FIAC data with BrainVoyager QX: From single-subject to cortically aligned group GLM
analysis and self-organizing group ICA. (R. Geobel, 2006) 295
VOXBO: Viewing facial expressions of pain engages cortical areas involved in the direct experience of pain.
(M Botvinick, 2005) 254
PLS: Partial least squares analysis of neuroimaging data applications and advances.(A. R. McIntosh,2004) 236
BrainVISA: software platform for visualization and analysis of multi-modality brain data(Y. Cointeps, 2001) 71
DPTools: Whole Brain quantitative CBF and CBV measurement using MRI blus tracking: comparison of
methodologies.(Anne M. Smith, 2000) 58
Neurolens: NeuroLens: an integrated visualization and analysis platform for functional and structural neuroimaging.
(R.D. Hoge, 2004) 6
el displays a pattern (of intensity variation) through time that indicates the blood oxygen level variation in that particular location at a particular time. These patterns can be compared with the predicted hemo-dynamic response associated with a task. AFNI 1-D
files are files that include predicted hemodynamic
responses to be correlated to actual hemodynamic patterns displayed by our functional analyses. For identifying the locations/voxels in the brain that
ap-pear to be activated during the task, the correlations between the predicted pattern and the pattern in each voxel can be used. Waver is the program that is used
to make these 1-D files.
• Group Analysis (Averaging): standard group analysis of fMRI data rely on spatial and temporal averaging of individuals.
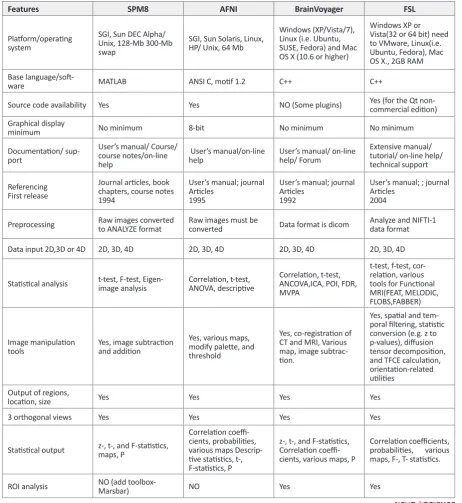
Features SPM8 AFNI BrainVoyager FSL
Platform/operating
system
SGI, Sun DEC Alpha/
Unix, 128-Mb 300-Mb
swap
SGI, Sun Solaris, Linux, HP/ Unix, 64 Mb
Windows (XP/Vista/7), Linux (i.e. Ubuntu, SUSE, Fedora) and Mac OS X (10.6 or higher)
Windows XP or
Vista(32 or 64 bit) need
to VMware, Linux(i.e. Ubuntu, Fedora), Mac OS X., 2GB RAM
Base language/soft
-ware MATLAB ANSI C, motif 1.2 C++ C++
Source code availability Yes Yes NO (Some plugins) Yes (for the Qt non-commercial edition)
Graphical display
minimum No minimum 8-bit No minimum No minimum
Documentation/ sup
-port
User’s manual/ Course/
course notes/on-line help
User’s manual/on-line
help User’s manual/ on-line help/ Forum
Extensive manual/
tutorial/ on-line help/ technical support
Referencing
First release
Journal articles, book
chapters, course notes 1994
User’s manual; journal Articles
1995
User’s manual; journal Articles
1992
User’s manual; ; journal Articles
2004
Preprocessing Raw images converted to ANALYZE format Raw images must be converted Data format is dicom Analyze and NIFTI-1 data format
Data input 2D,3D or 4D 2D, 3D, 4D 2D, 3D, 4D 2D, 3D, 4D 2D, 3D, 4D
Statistical analysis t-test, F-test, Eigen-image analysis Correlation, t-test, ANOVA, descriptive Correlation, t-test, ANCOVA,ICA, POI, FDR,
MVPA
t-test, f-test,
cor-relation, various tools for Functional MRI(FEAT, MELODIC, FLOBS,FABBER)
Image manipulation
tools Yes, image subtraction and addition
Yes, various maps,
modify palette, and
threshold
Yes, co-registration of
CT and MRI, Various map, image
subtrac-tion.
Yes, spatial and tem
-poral filtering, statistic
conversion (e.g. z to
p-values), diffusion tensor decomposition, and TFCE calculation, orientation-related utilities
Output of regions,
location, size Yes Yes Yes Yes
3 orthogonal views Yes Yes Yes Yes
Statistical output z-, t-, and F-statistics, maps, P
Correlation coeffi
-cients, probabilities,
various maps
Descrip-tive statistics, t-, F-statistics, P
z-, t-, and F-statistics, Correlation coeffi -cients, various maps, P
Correlation coefficients, probabilities, various maps, F-, T- statistics.
ROI analysis NO (add toolbox- Marsbar) NO Yes Yes
5. AIR (Automated Image Registration)
AIR was developed by Roger P. Woods at the UCLA School of Medicine and includes routines for register-ing images of the same and differregister-ing imagregister-ing modalities (Woods et al., 1998). AIR was designed for automated registration of 3D (and 2D) images within and across subjects and within and sometimes across imaging mo-dalities. AIR was implemented to be compatible across platforms. AIR source code is written in C language and it is available to the research community freely for download. The code can be compiled for UNIX, PC or Macintosh platforms. Only source code is available (no executable) for this package. CLP 10 in the AIR is nec-essary for linear and nonlinear image registration and image preprocessing utilities for re-slicing, re-orienting, re-sizing, and averaging, and etc.6. BrainVisa
BrainVisa/Anatomist was developed as a collabora-tive effort between L’Institut Fédératif de Recherche 49 (IFR49) and the Frederic Joliot Hospital Service (Coin-tepas, 2010). BrainVisaISA is a software, which was designed for image processing. The BrainVisa control panel is very simple and allows the user to be able to trigger some sequences of handlings on series of im-ages. The sequences of handlings are performed by calls to command lines provided by different laboratories. It is distributed with a toolbox of building blocks devoted to the segmentation of T1-weighted MR images. This software package includes various options such as:
grey/white classification for voxel based morphometry,
meshes of each hemisphere surface for visualization purpose, spherical meshes of each hemisphere white matter surface, a graph of the cortical folds, a labeling of the cortical folds according to a nomenclature of the main sulci. BrainVisa has tools for fMRI, MEG/EEG, and MR diffusion imaging analysis as well as
measur-ing cortical thickness, gyrification index, sulcal length,
and sulcal depth. Superior feature of the BrainVisa is its own Anatomist software to visualize data and analysis results.
7. FMRLab
FMRLab was developed by Duann at the University of California, San Diego for fMRI data analysis using Independent Component Analysis (ICA) (Perlbarg,
Bel-lec, & Anton, 2007). In FMRLab software, users work
in single framework and can complete the analysis with-out switching between softwares. It has an integrated 10. cleft lip and palate
surrounding to accomplish processes and analyses of the fMRI data in a single framework. Since fMRI data analysis is a complex procedure, including digital image processing, statistical analysis and data visualization, an integrated framework with all processing options is desired eagerly by users in the neuroimaging com-munity. Recently, large numbers of software tools for data analysis and visualization have been developed for this purpose which most of these tools use model-based statistical methods. They assume that the users know the hemodynamic response (HR) for their paradigm in advance and can specify a reasonable HR model, but of-ten, accurate or reasonable response HR models are un-available. To address this problem, an alternative
data-driven method, infomax ICA (McKeown & Sejnowski,
1998), was proposed. This method does not require a priori the HR model, instead deriving HRs of spatially independent components of the entire data set from the higher-order statistics of the data themselves. FMRLab is a toolbox running under MATLAB containing nec-essary components for data-driven fMRI data analysis using the highly reliable infomax ICA algorithm,
nor-malized (Amari, 1999), and extended (Lee, Cirolami, &
Sejnowski, 1999). In addition, it provides an interactive MATLAB graphic user interface (GUI) environment to manage, process, and analyze fMRI data in a single framework. All the necessary processes to apply ICA to fMRI data and review its results can be run from the graphic interface. The FMRLab processing steps are straightforward. FMRLab has been developed under MATLAB 6.1 running on Red Hat Linux. The
soft-ware includes: flexible data importing; computation
-ally efficient; defined FMRI data structure; independent
component browser; smooth (transparent component exporting and spatial normalization process); interface with other software for further analysis or visualization; and SPM-style component plots (MIP, 2-D slice overlay and 3-D).
8. DPTools
DPTools was developed at the Laboratoire d’Imagerie Médicale Expérimentale et Clinique for fMRI data anal-ysis. It provides a suite of functional and structural MRI processing utilities (Ducreux et al., 2005). Since the software has not been FDA approved, you cannot use DPTools for clinical purposes. This software contains: a GUI-based environment; analysis for fMRI, diffu-sion, and perfusion imaging; a visualization tools for all forms of analysis; tools for registration and
segmenta-tion; measuring MR flow; performing brain extracsegmenta-tion;
9. FreeSurfer
FreeSurfer is a biomedical image analysis software that was developed as collaboration between CorTechs and the Athinoula A. Martinos Center (Fischl et al., 2002). This software is able to analyze and visualize the structural and functional brain imaging data re-corded from neuroimaging technologies, as well as for reconstructing the brain’s cortical surface from struc-tural MRI data and overlaying fMRI data onto the re-constructed surface. The main data type that is used in this software is divided to two types: volumetric data (volumes of voxels) and surface data (polygons that tile a surface). In the Freesurfer, for making the best
visu-alization, image is available to be inflated and/or flat -tened. It contains a fully automatic structural imaging stream for processing cross sectional and longitudinal data. FreeSurfer provides many functional and ana-tomical analysis tools, including: ROI analysis, group analysis, multi model integration, representation of the cortical surface between white and gray matter, repre-sentation of the pial surface, segmentation of white mat-ter from the rest of the brain, skull stripping, B1 bias
field correction, nonlinear registration of the cortical
surface of an individual with a stereotaxic atlas, labeling of regions of the cortical surface, statistical analysis of group morphometry differences, labeling of subcortical brain structures, measuring cortical thickness, methods for volume-based and surface-based region labeling and surface-based statistical analyses.
FreeSurfer is available for the Linux and Mac OS X operating systems. It can also be used on Windows with VirtualBox (but runs a bit slower). It is freely available for research aims.
10. FSL (FMRIB Software Library)
FSL is functional neuroimaging analysis software that was written by members of the Analysis Group, FMRIB, Oxford, UK (Martino et al., 2009). FSL is an extensive library of GUI- and CLP-based image analysis and statistical tools for fMRI, MRI, and DTI brain imaging data. FSL functions that are available for neuroimaging data are: FET (Model-based fMRI analysis with straightforward but power GUI), ME-LODIC (Model-free fMRI analysis using probabilistic independent component analysis), FLOBS (Generation of optimal HRF basis function and Bayesian activation estimation), and SMM (Spatialmmixture modeling) for functional MRI; BET (brain extraction tool), SUSAN (nonlinear noise reduction), FAST (FMRIB’s automat-ed segmentation tool), FLIRT (FMRIB’s linear image
registration tool), FUGUE (unwarps geometric in EPI
images using B0 field maps), SIENA (structural brain
change analysis) for structural MRI; and FDT (FM-RIB’s diffusion toolbox), TBSS (tract-based spatial sta-tistics) for diffusion MRI. The features that are existing for this software are: fMRI preprocessing (e.g., motion
correction, de-noising and analysis, first-level time-se -ries analysis, and Bayesian mixed effects analysis meth-ods); a suite of structural MRI utilities like brain extrac-tion, tissue segmentaextrac-tion, linear and nonlinear inter and intra-modality registration, model-based segmentation, distortion correction, structural brain change analysis, voxel-based morphometry of gray matter, and nonlinear noise reduction; tools for diffusion MRI for diffusion parameter reconstruction, tractography, and voxel wise analysis of multi subject data.
FSL is available for Apple and PCs (Linux and Win-dows), and is very easy to install. Most of the tools can be run both from the command line and as GUIs.
11. MRIcro
MRIcro was developed by Chris Rorden at the
Univer-sity of South Carolina (Rorden & Brett, 2000). MRIcro
allows Windows and Linux computers view medical images. It is a standalone program, but includes tools to complement SPM (software that allows neuroimag-ers to analyze MRI, fMRI and PET images). MRIcro
allows efficient viewing and exporting of brain images.
In addition, it allows neuropsychologists to identify re-gions of interest (ROIs, e.g. lesions). MRIcro can create Analyze format headers for exporting brain images to other platforms. MRIcro allows users to view medical images in a stand-alone program. It includes: tools to complement the analysis tools available with SPM; con-verts medical images to SPM friendly Analyze format; view Analyze format images (big or little endian); cre-ate Analyze format headers (big or little endian); crecre-ate
3D regions of interest (with computed volume & inten -sity); overlap multiple regions of interest; rotate images to match SPM template images; export images to BMP, JPEG, PNG or TIFF format; yoked images: linked viewing of multiple images (e.g. view same coordinates of PET and MRI scans). This software is only for the visualization of fMRI data.
12. NeuroLens
envi-ronment for the analysis and visualization of functional neuroimages. It is intended to provide extremely fast and
flexible image processing, via an intuitive user interface
that encourages experimentation with analysis param-eters and detailed inspection of both raw image data and processing results. All processing operations in Neu-roLens are built around plug-in architecture, making it easy to extend its functionality. NeuroLens runs on Apple computers based on the G4, G5, or Intel chipsets and run-ning MacOSX 10.4 (Tiger) or later. It is available freely
for download for academic and non-profit research use.
This software includes: GUI-based environment; tools
for region painting; flexible viewing of numerous data -set types; volumetric time-series and cortical surfaces, in multiple windows; Input/output for many commonly used image formats in neuroimaging research.
13. PLS (Partial Least Squares)
PLS was developed by Randy McIntosh at the Rot-man Research Institute (Hulland, 1999). PLS is a popu-lar method for soft modeling in the industrial applica-tions. It is a method for constructing predictive models when the factors are many and highly collinear. PLS is a MATLAB toolkit for performing multivariate analysis of neuroimaging data. PLS is a method for extracting distributed signal changes related to changing task de-mands. It has also been applied to measuring distributed patterns that affect task performance and task-depen-dent changes in the relation between brain regions. PLS analysis has been used to characterize distributed sig-nals measured by neuroimaging methods such as PET, event-related fMRI, blocked fMRI, structural MRI, event-related potentials, and magnetoencephalography.
14. VoxBo
VoxBo was developed by Poldark at the Center for Functional Neuroimaging at the University of
Pennsyl-vania (Poldrack, Mumford, & Nichols, 2011). VoxBo is
one of the MRI data analysis programs which is used in many laboratories. It works a bit differently than most other programs. In most data analysis programs, or for that matter programs in general, you start the program,
open up a file, do some stuff with the data, and save some
sort of results. VoxBo is distinctly different. In VoxBo, you create a set of instructions (called "jobs"), then sit back and wait for them to be executed. This may sound a bit like programming or scripting (e.g. in MATLAB), but VoxBo doesn't work quite like that either. The actual work is done by a process which is always running in the background on every Linux computer. You set up a list of jobs, and the process gets around to
complet-ing them eventually. VoxBo is a free software package for the processing, analysis, and display of data from
functional neuroimaging (chiefly fMRI) experiments.
VoxBo includes preprocessing tools for structural and functional images.
15. Discussion
This paper provides a general view about the most available software packages that are used for the analy-sis of functional magnetic resonance imaging data. There are various software packages for fMRI data analysis (see Table 1). A software package has many options and a tool is selected based on need to a special analysis at the laboratory. Most laboratories are looking to use freel softwares. SPM and FSL are freel softwares that have been used in various studies for GLM analysis. In con-trast, BrainVoyager is commercially available software. It is expensive but it is very easy to use. The most striking feature of the Brainvoyager is having various models for analysis like, GLM, VOI, ROI, MVPA and etc.
In table 2, we summarized the number of references for each software, which shows, SPM, AFNI as free softwares and BrainVoyager as commercial software used conventionally. Based on this result, we summa-rized the number of features of these softwares in table 3 (Gold and et al, 1998).
References
Amari S. I.(1999). Newblock natural gradient learning for over- and under-complete bases in ICA. Neural Compuationt. 11(8): 1875-1883.
Ashburner J., Friston K.J.(2005). Unified segmentation. Neu -roImage, 26:839-851.
Ashburner J., Friston K.J.(1997). The role of registration and spatial normalization in detecting activations in functional imaging. Clinical MRI/Developments in MR, 7(1):26-28.
Behroozi M., Daliri M. R., Boyaci H. (2011). Statistical analysis methods for the fMRI data. Basic and Clinical Neuroscience. 2(4):67-74.
Bell A. J., Sejnowski T. J. (1995). An information-maximistation approach to blind separation and blind deconvolution. Neu-ral Computation. 7(6):1004-1034.
Cointepas, Y. (2010), ’The BrainVISA project: a shared soft-ware development infrastructure for biomedical imaging research’, In Proceedings of 16th HBM Meeting.
Cointepas, Y., Mangin,J.-F., Garnero, L., Poline J.-B., and Benali, H.(2001). BrainVISA: Software platform for visualiza-tion and analysis of multi-modality brain data. In Proc. 7th HBM, Brighton, United Kingdom, pages S98.
Clohery S. L., Mustari M. J., Rosa M. G. P., Ibbotson M. R. (2010). Effect of saccades on visual processing in primate MSTd. Vision Research. 50(21): 2683-2691.
Collignon A., Maes F., Delaere D., Vandermeulen D., Suetens P., Marchal G.(1995). Automated multi-modality image reg-istration based on information theory. In Y. Bizais, C. Barillot, and R. Di Paola, editors, Proc. Information Processing in Medical Imaging, 263-274. Dordrecht, the Netherlands, 1995. Kluwer Academic Publishers.
Daliri, M.R., Behroozi, M. (2012). fMRI: Clinical and Research Applications. OMICS J. Radiology. 1:e112.
Duann J. R. Jung T. P., Making S., Sejnowski T. J. (2002). fMR-LAB: An ICS toolbox for fMRI data analysis. Human Brain Mapping, Sendai, Japan. June 10-16.
Ducreux D., Huynh I., Fillard P., Renoux J., Lasjaunias P.
(2005). Brain MR diffusion tensor imaging and fiber tracking
to differentiate between two diffuse axonal injuries. Neuro-radiology. 47: 604-608.
Farah M., J. Emerging ethical issues in neuroscience.(2002). Na-ture Neuroscience, 5, 1123-1129.
Fischl B., Salat D.H., Busa E., Albert M., Dieterich M., Hasel-grove C., van der Kouwe A., Killiany R., Kennedy D., Klave-ness S., Montillo A., Makris N., Rosen B., Dale A.M. .(2002). Whole brain segmentation: automated labeling of neuroana-tomical structures in the human brain. Neuron, 33, 341–355.
Friston K. J., Frith C., Frackowiak R. S. J., Turner R.(1995). Char-acterizing dynamic brain responses with fMRI: A multivari-ate approach. NeuroImag, 2:166-172.
Friston K.J., Glaser D.E., Henson R.N.A., Kiebel S.J., Phillips C., Ashburner J.(2002) Classical and Bayesian inference in neu-roimaging: Applications. NeuroImage, 16:484-512.
Friston K. J., Holmes A. P., Worsley K. J., Poline J. P., Frith C. D., Frackowiak R. S. J. (1995). Statistical parametric maps in functional imaging: a general liner approach. Human Brain Mapping, 4(2) : 189-210.
Gabral C., Silveira M., and Figueiredo P. (2011). Decoding
vis-ual brain states from fMRI using an ensemble of classifiers.
Pattern Recognition, 44, 2984-2993.
Goebel R., Esposito F., Formisano E.(2006). Analysis of FIAC data with BrainVoyager QX: From single-subject to cortically aligned group GLM analysis and self-organizing group ICA. Human Brain Mapping. 27(5): 392-401.
Gold S., Christian B., Arndt S., Zeien G., Cizadlo T., Johnson D. L., Flaum M., Andreasen N. C.(1998). Functional MRI statis-tical spftware pakages: Acomarative analysis. Human Brain Mapping, 6:73-84.
Hoge D. R., Lissot A. (2004). NeuroLens: an integrated visu-alization and analysis platform for functional and structural neuroimaging. Proc. Intl. Soc. Mag. Reson. Med. 11.
Hulland J. (1999). Use of partial least squares (PLS) in Strategic management research: a review of four recent studies. Strate-gic Management Journal. 20(2): 195-204.
Lazar, N. (2008). The statistical Analysis of functional MRI data. springer science+business media, LLC , USA.
Lee T. W., Cirolami M., Sejnowski T. J.(1999). Independent component analysis using an extended infomax algorithm for mixed subgaussian and supergaussian sources. Neural Computation. 11:417-441.
Martino A. D., Shehzad Z., Kelly C., Roy A. K., Gee D. G.(2009). Relationship between cingulo-insular functional connectiv-ity and autistic traits in nurotypical adults. Am. J. Psychiatry. 166: 891-899.
Matthews P. M., Honey G. D., Bullmore E. T. (2006). Applica-tion of fMRI in translaApplica-tion medicine and clinical practice. Neuroimaging. 7: 732-744.
McKeown M. J., Sejnowski T. J. (1998). Independent Compo-nent Analysism of fMRI data Examining the assumptions. Human Brain Mapping. 6:368-372.
Mclntosh A. R., Lobaugh N. j. (2004). Partial least squares anal-ysis of neuroimaging data applications and advances. Neu-roimage, 23(1): S250-S263.
Nielsen F. A., Christensen M. S., Madsen K. H., Lund T., E. Hansen L. K. (2006). fMRI Neuroinfomatics.IEEE Engineer-ing in Medicen and Biology Magazine. 25(2):112-119.
Penny W. D., Friston K. J., Ashburner J. T., Kiebel S. J., Nichols T. E.(2006). Statistical Mapping: the analysis of functional brain imaging (1st edition). Academic Press.
Perlbarg V., Bellec P., Anton J. L. (2007). CORSICA: correction
structured noise in fMRI by automatic indentification of ICA
components. Magnetic Resonance Imaging, 25(1): 35-46.
Poldrack R. A., Mumford J. A., Nichols T. E. (2011). Handbook of functional MRI analysis. Cambridge University Press.
Robert W. C. (1996). AFNI: software for analysis and visualiza-tion of Funcvisualiza-tional Magnetic Resonance Neuroimages.Com-puter and Biomedical Research, 29:162-173.
Rorden C, Brett M. (2000). Stereotaxic display of brain lesions. Behavioral Neurology. 12(4): 191–200.
Smith S. M., Jenkinson M., Woolrich M. W., Beckmann C., F. and et al. (2004) Advances in functional and structural MR image analysis and implementation as FSL. Neuroimage, 23: S208-S219.
Smith A. M., Grandin C. B., Duprez T., Mataigne F. (2000). Whole Brain quantitative CBF and CBV measurement using MRI blus tracking: comparison of methodologies. Journal of Magnetic Resonance Imaging , 12 : 400 – 410.
Tae W. S., Kim S. S., Lee K. U., Nam E. C., Kim K. W.(2008). Validation of hippocampal volumes measured using a man-ual method and two automated methods (FreeSurfer and IBASPM) in chronic major depressive disorder. Neuroradi-ology. 50(7): 569-581.