Copyright © 2013 IJECCE, All right reserved
Performance Analysis of Open Loop Fractional Power
Control in LTE Network
Ibrahim Khider
Sudan University of Science andTechnology
Khalid Hamid Bilal
University of Science andTechnology
Anisa Khalf Allah
Sudan University of Science andTechnology
Abstract — Long Term Evolution is currently being standardized in 3GPP with the aim of more than twice the capacity over High-Speed Packet Access. The chosen multiple access for uplink is Single Carrier FDMA, which avoids the intra-cell interference typical of CDMA systems, but it is still sensitive to inter-cell interference. As a result, the role of the power control becomes decisive to provide the required SINR, while controlling at the same time the interference caused to neighboring cells. This is the target of the Fractional Power Control (FPC) algorithm lately approved in 3GPP.In the paper, the open loop power control (OLPC) is studied in details to obtain a reference performance, and then some techniques are studied with the aim of improving it. The techniques are implemented on a static simulator. The comparison of the result among the different techniques is carried out by considering key performance indicators like the cell outage and cell throughput.
Keywords — LTE Network, Power Control, Fractional Power Control, OLPC, Simulation.
I. I
NTRODUCTION3GPP LTE represents a major advance in cellular technology. LTE is designed to meet carrier needs for speed data and media transport as well as high-capacity voice support. It provides high-speed data; multimedia unicast and multimedia broadcast services.LTE infrastructure is designed to be as simple as possible to deploy and operate; through flexible technology that can be deployed in a wide variety of frequency bands.LTE have several important benefits ,LTE provides downlink peak rates of at least 300Mbps and uplink peak rates of 50Mbps in 20 MHz channel. LTE has very low latency period of <10ms and has very low control plane latency <100ms. LTE leverages advanced antenna techniques such as Multi Input Multi Output (MIMO), Space Division Multiple Accesses (SDMA) and beamforming, which provides benefits to users in both high and low signal strength areas [1]. LTE supports flexible carrier bandwidths, from below 5MHz up to 20MHz. It also supports both Frequency Division Duplex (FDD) and Time Division Duplex (TDD). Its radio network products will have a number of features that simplify the building and management of next-generation networks. For example, features like plug-and-play, self-configuration and self-optimization will simplify and reduce the cost of network roll-out and management. IP-based core and transport networks that are easier to build maintain and introduce services [1]. [2] In addition to mobile phones, many computer and consumer electronic devices, such as notebooks, ultra-portables, gaming devices and cameras, will incorporate
LTE embedded modules. Since it supports hand-over and roaming to existing mobile networks, all these devices can have ubiquitous mobile broadband coverage [1].
The capabilities of the evolved node-B (eNB) and the user equipment (UE) are obviously quite different, thus the LTE physical layer (PHY) downlink (DL) and uplink (UL) are different. Orthogonal Frequency Division Multiplexing (OFDM) is selected as the basic modulation scheme because of its robustness in the presence of severe multipath fading. Orthogonal Frequency Division Multiple Access (OFDMA) is employed as the multiplexing scheme in the downlink.LTE uplink requirements differ from downlink in several ways. Power consumption is a key consideration for UE terminals. High peak-to-average power ratio (PAPR) and related loss of efficiency with OFDM signaling are major concerns. As a result, an alternative to OFDMA was sought for use in the LTE uplink.PUSCH is used to carry user data. Resources for the PUSCH are allocated on a sub-frame basis by the uplink (UL) scheduler.
II. O
PEN LOOP ANDF
RACTIONALP
OWERC
ONTROLThe power is set at the mobile terminal using parameters and measures obtained from signals sent by the eNode-B (eNB) called open loop power control. In this case no feedback is sent to the BS regarding the power used for transmission as shown in figure.1,[3]
Copyright © 2013 IJECCE, All right reserved To study the PC techniques some assumptions and
simplifications are needed to focus on the link level. The objective is to study the foundation of PC technique, these assumptions are listed below:
: Fixed at 250 .
: Equal to all cells in the system. α: Also equal for all cells in the system.
: assumed to be equal to the UL path loss.
As a note, these same assumptions are used in reference work [4][5]to obtain results. These pursue the set of a scenario simple enough for the initial evaluation. The results obtained here thus, can be directly compared to them. Any user sets its power for transmission the starting point is the open loop term. It is designed funded on the principle of Fractional Power Control (FPC).
Few of the parameters are broadcast by the eNB i.e. same for all the users in that specific cell. The figure .2 shown below helps more in understanding the parameters signaled by the eNB towards the UEs [6].Figure.1 shows that the UE received parameters namely , α, and from the eNB. is the estimate of the path loss calculated at the UE based on reference symbol received power (RSRP). It is also indicated that few parameters are cell specific i.e. these parameters vary from cell to cell. Cell specific parameters indicate that they are same for all the UEs in that cell [7].
Fig.2. PUSCH power control parameters broadcasted From the RRM point of view, the scope of PC is to define the transmitting power in one PRB, letting the UE scale it to the assigned transmission bandwidth (BW). This implies that ultimately it will transmit with a constant power in each assigned PRB, or in other words, it will have a constant power spectral density over the transmission bandwidth. For this reason, the term can be extracted and also, from the RRM point of view the power limitation can be neglected since it corresponds to the UE to respect it. Finally, removing the closed loop term, the formula results in equation (1) which is referred to as the FPC formula [7].
This equation has the units according to the units of , however, it represents the total power contained in one PRB, and thus, is referred to -unvirtuously- PSD. The expressions written in dB units are shown in capital letters while the linear in non capital. Also, it is preferred to work
with the path gain information which is the linear inverse of the path loss. Then Equation (1) is re-written as Equation (2) in dB or as in Equation (3) in linear.
Where PG is the path gain of the user to the serving Base Station (BS). To explore the FPC concept, first the effect of the parameters and in Equations (2) and (3) is studied. It is understood that the system can be simulated once per each pair of them. It is first remarked that the is linearly dependent with , while α weights its dependency with the path gain. is constant for all users while the term varies for each UE according to its experienced pathgain. Attention is drawn to this, since it is the element that will differentiate the user’s performance. To extend the analysis of effects of these two parameters, more than just the needs to be analyzed. The user experienced SINR, expressed in Equation (4) is the first figure of interest.
Where denotes the SINR of user , is the received of user at its serving BS. I is the interference density while n is the thermal noise density level both perceived at the BS serving user . This and the following expressions are valid only for an instant on which none of the elements vary and when the densities are constant along all the transmission bandwidth. The received power density, can be simplified into equation (5), which is the transmitting over the transmission bandwidth multiplied by the total path gain .
Where is the power spectral density of user and pg is the total pathgain from user to its serving BS. If is known to be set according to FPC then the previous can be written as Equation (6), by substituting Equation (3) on (5).
Finally the SINR related to FPC is obtained as equation (7):
III. S
IMULATION DESCRIPTIONCopyright © 2013 IJECCE, All right reserved system is modeled as one cell. Network containing this
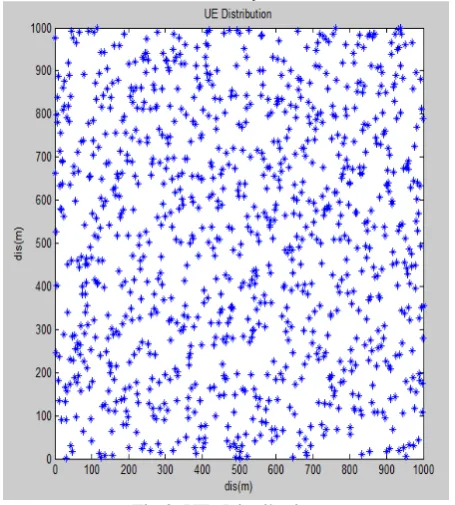
cell has radius equaled to 1000m. The operating bandwidth is divided in 50 PRBs with a bandwidth of 180 KHz each. The main simulation assumptions of the study can be seen in table .1.As shown in Figure.3, the user generation distribution. The calculations used in the study are listed in the next sections. The results of the algorithms proposed have been obtained through a static link level simulator and using inputs from a reference work [7]. The first is a simplified tool that focuses on the power control link level calculations that uses an input containing a list with information about UEs and BSs. This information regards the coordinates, related path loss, antenna patterns, and others. The static simulation offers low complexity and fast calculations, making it able to generate results faster than the system level simulator. The simulation used to evaluate the performance of the techniques a few Key Performance Indicators (KPI) have been chosen:
Cell throughput: It is the total UL throughput of users served by a given cell. In the paper it all users’ throughputs are considered at link level.
User SINR, Transmitting Power (Tx power): it are distributions of user transmitted power and experienced SINR.
The scope of using such KPIs is to provide with a quantitative measure of the gain of a specific PC scheme in terms of system as well as user performance.
The system level simulators are used to generate a random distribution of users as in figure .3, 1000 users are generated per cell, serving BS of a given UE is taken as the one that is associated with the lowest total path loss to it path loss. The default system simulation parameters are shown in Table 1. The simulations all assume Fixed Transmission Bandwidth (FTB) [7][8][9]. Thermal noise has been modeled, which has a constant power spectral density over the working frequency. Its level is N = −174dBm/Hz, which doesn’t vary in time [8].
Fig.3. UEs Distribution
Table 1: Default simulating Assumptions
IV. R
ESULTS AND DISCUSSIONCopyright © 2013 IJECCE, All right reserved Power Hosting Parameter ( )
Figure .5,shows that an increase in is mapped into a considerably lower rise in the experienced SINR since such power boosting also means increasing the power of all users, and the level of interference. Two examples of how the information is extracted from it are illustrator:
For =−65dBm, a randomly picked user has a 50 % probability of experiencing a SINR of 6 dBs. On the same case, 10 % of the users of the obtained distribution experience less than 1 dB on SINR.Increase of 5 dBs in , for example, does not result in the same SINR increase. In fact since is equal to all users in the system, an increase of it will raise their Tx power and thus, the interference perceived by all BSs. In this case the difference results around 1 dBs at the medium.
Pathloos Factor ( )
The FPC scheme partially compensates the path-loss, which means that not all the users have the same SINR requirements. The CDF of the experienced average SINR per-UE experienced average SINR is shown in Figure .6, for different path-loss compensation factor (α) values where is tuned so that the interference is kept constant. A change of α affects on each UE transmission power, increasing in α values resulting increase in transmission power. Graphically, a shift similar to that caused by should be observed. But as the result shows in Figure .6, it affects the spreaders of the distribution because the more it gets close to the value α = 1, the SINR becomes more correlated to PG. In the contrast case as it approximates to the correlation is lower. From Equation (7) for α = 1 (full compensation), all UEs are targeted to experience the same SINR by totally compensating for their path gain in the Tx psd distribution. The term is equal to 1. The distribution for the full compensation case is nearly 99 % around 4.9 -5 dB of SINR. It’s clearly identified how the less spreader caused by a high α, means that all users have the same performance. For α = 0.4 the UEs have different values of SINR, these values less than the values obtained by α = 1means that the improvement by α = 0.4 value is poor.
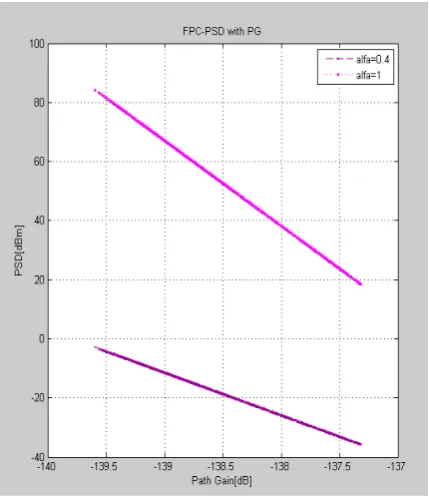
Fig.4. PSD compensation vs. Path gain
Fig.5. Effect of P0 on SINR distribution
Copyright © 2013 IJECCE, All right reserved Figure .6, shows that when α value is high increasing the
outage throughput while lower result in superior cell throughput. It is noted how the case of low α value drives a very low outage performance, a result that indicates that the interference levels are harming particularly this subset of UEs. The value α: 0.6 has been chosen in some reference work to be the optimum case (together with the value of that maximizes the outage throughput which differs slightly due to simulation assumptions), reason why it’s also chosen for reference in this work. α: 0.8 is also it proves a good performance when Compared to the α = 0.6 case. The peak of outage points for these two
chosen cases is located at −57dBm/PRB for α: 0.6 and −81dBm/ PRB for α: 0.8. Figure .7, show both outage and cell throughput a steady increase until the outage finds a peak at equal−157dBm/Hz.
Fig.7. Throughput vs Cell Throughput for FPC The operating points can use to explore the CDF of the user SINR distribution in the system. Figure .8, show SINR CDF distribution for FPC. The distribution is more spread, at 50% of the CDF the two cases crossing 5dB.
Figure 8: SINR distribution vs. cdf for FPC
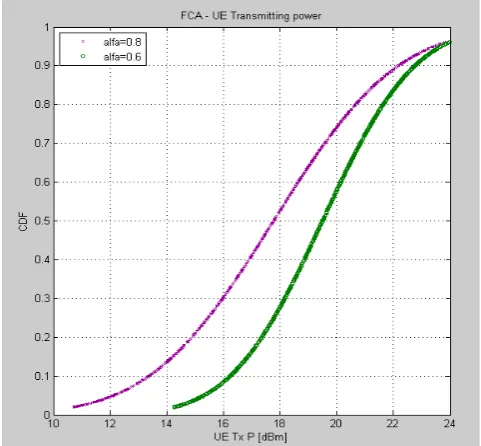
Figure.9, shows that the case of α=0.8 results in a lower power distribution. This is highly beneficial from a UE power consumption point of view. The biggest difference is in the Tx psd region where for the 50% probability up to 2 dB of difference are obtained whereas at high values they tend to be quite similar. It should also be noted how the amount of power limited UEs is the same for both cases. It is visualized as an arrived to a probability of 0.98 in 250mW = 23.97dBm.
Fig.9. UE Transmitting power distribution vs. cdf for FPC
V. C
ONCLUSIONThe paper is focused on the power control of a EUTRAN LTE cellular system, corresponding to the uplink direction of the 3GPP Long Term Evolution Project.In the current standardization process, the power control is specified to function both with open loop and closed loop mechanisms. The open loop functioning is based on the Fractional Power Control technique which is designed to allow for full or partial compensation for the path loss. The paper studied many power control techniques A tool is developed to model the system in a static way, neglect the effect of some of the RRM functionalities and focus on the power control. The standardized equation for FPC allows setting the user transmitting power according to the fraction of PG that the user has to compensate. The parameters and can be set in order to have an operating point on which cell performance and outage are accordingly compromised. Two cases are extracted to provide with reference, representative enough to compare further PC techniques.
R
EFERENCES[1] www. ericson.com
[2] Claudio Rosa, Preben E. Mogensen, Klaus I. Pedersen, Francesco D. Calabrese, Mohmmad Anas ,”Performance of a Radio Resource AllocationAlgorithm for UTRAN LTE Uplink ,65thIEEE vehicular technology conference,Dublin,Ireland,april
Copyright © 2013 IJECCE, All right reserved [3] Z. Kovacs, Klaus I. Pedersen, Naizheng Zheng, Malek Boussif,
Claudio Rosa, István Z. Kovács, Klaus I. Pedersen, Jeroen Wigard, Preben E. Mogensen: Uplink Coordinated Multi-Point for LTE-A in the Form of Macro-Scopic Combining. VTC Spring 2010.
[4] Weimi Xiao, Rapeepat Ratasuk, Amitava Ghosh, Robert. Love, Yakun Sun, and Ravi Nory, Uplink power control, interference coordination and resource allocation for 3gpp e-utran,electronic edition,2007.
[5] Haipeng Lei and Xiaoqiang Li Beijing Samsung Telecom R&D Center ,”System Level Study oF LTE Uplink Employing SC-FDMA and Virtual Mu-Mimo”,international conference on communication technology and applications,beijing,October 2009.
[6] Robert Müllner, Carsten F. Ball, Kolio Ivanov, Johann Lienhart and Peter Hric,”Performance of Uplink Fractional Power Control in UTRAN LTE”,Lecture Notes in Electrical Engineering, 2009, Volume 41, pages 175-184
[7] Malek Boussif , Nestor Quintero , Francesco D. Calabrese , Claudio Rosa , and Jeroen Wigard ,”Interference Based Power Control Performance in LTE Uplink “,IEEE international symposium on wireless communication systems. IEEE, 2008. p. 698 - 702.
[8] Naizheng Zheng, Per-Henrik Michaelsen, Jens Steiner, Claudio Rosa, Jeroen Wigard ,“Antenna Tilt and Interaction with Open Loop Power Control in Homogeneous Uplink”, international symposium on wireless communication systems. IEEE, 2008. p. 693-697.
A
UTHOR’
SP
ROFILEIbrahim Khider
was born 1974.he is an assistant professor at SUST ,deptt. of electronics since July 2009. His Ph.D. in communication and information system.
Khalid hamid
was born 1967. He is an assistant professor at UST , head of the dept. of communication engineering since august 2009. A Ph.D. in electrical engineering.