1-1-2017
An Examination of the Relationship Between Pre-K
Programming and Third-Grade Math and Reading
Achievement Outcomes in Oregon
Maria K. Drennen
This research is a product of the Doctor of Education (EdD) program at George Fox University.Find out moreabout the program.
This Dissertation is brought to you for free and open access by the Theses and Dissertations at Digital Commons @ George Fox University. It has been accepted for inclusion in Doctor of Education (EdD) by an authorized administrator of Digital Commons @ George Fox University. For more information, please [email protected].
Recommended Citation
Drennen, Maria K., "An Examination of the Relationship Between Pre-K Programming and Third-Grade Math and Reading Achievement Outcomes in Oregon" (2017).Doctor of Education (EdD). 103.
AN EXAMINATION OF THE RELATIONSHIP BETWEEN PRE-K PROGRAMMING AND THIRD-GRADE MATH AND READING ACHIEVEMENT OUTCOMES IN OREGON
by
MARIA K. DRENNEN
FACULTY RESEARCH COMMITTEE: Chair: Dane Joseph, PhD
Members: Karen Buchanan, EdD, Susanna Thornhill, PhD
Presented to the Doctor of Education Program and the School of Education, George Fox University
Abstract
This study examined the relationship between preschool program type, race/ethnicity,
socioeconomic status and measures of third-grade academic achievement outcomes, as measured by the standardized mathematics and English Language Arts assessments administered to third-grade students in Oregon. The study participants were fourth-third-grade students from a single participating school district in the Southern region of Oregon. Parents/guardians voluntarily consented to participation and provided a completed questionnaire specifying their child’s
preschool program type as attended the majority of the time (nine months or more) in the year prior to Kindergarten. Required statewide assessment in Mathematics and English Language Arts occur in third-grade. Therefore, post-hoc scores from the previous year’s assessment for the participants were utilized. A one-way ANOVA and independent samples t-test were employed to determine the difference between group means in order to answer the research questions, “What is the relationship between students’ Pre-K program type, race/ethnicity, family SES, and their third-grade Smarter Balanced Assessment Consortium scores for both mathematics and English Language Arts?” The results of this study point to differences in mean scores between preschool program types most notably in the area of mathematics, in which students whose preschool program type ‘In-Home Care’ outperformed their peers attending ‘Head Start’ or ‘Other’ types
ACKNOWLEDGEMENTS
The journey of completing this study has occurred against the backdrop of many life-transforming transitions, obstacles, and heartaches. As I reflect upon the past year and a half, I have an awareness that who I am at the end of this journey is much altered from who I was when I began this journey. I am reminded of Professor Patrick Allen’s comments to our cohort upon admittance into the program. He related the role of the EdD department to that of a Sherpa. As we made the ascent toward the top of the mountain, we would know that we were never alone and always had support and guidance should our feet falter on the arduous voyage known as completing a dissertation. For me, my Sherpa in this journey has been Dr. Dane Joseph. If it were not for Dane, I would have fallen off of the mountain in despair long ago. Tragedies in my personal life diminished my desire to continue on the path and severely hampered my drive and ambition to complete what I had started. Dane exercised tremendous patience with me and my process this past year and half, and he has been eternally positive and supportive, while also helping me take one more step towards the top of the mountain. I am sincerely humbled by the time and effort he invested to ensure I was successful.
This process became richer with guidance from those who invested their time to read and re-read my written word. The insight of both Dr. Susanna Thornhill and Dr. Karen Buchanan has given me pause and allowed me invaluable opportunities to reflect and make intentional
revisions to enhance the readability and flow of my document. I am grateful to both women for their unique perspective and for the high-quality, detailed feedback they offered me.
This study would not have been possible without the help of two educational leaders who wholeheartedly offered support in acquiring the data necessary to answer the research questions. To Dr. Todd Bloomquist, the Director of School Improvement in the participating school district, my appreciation is endless for agreeing to allow me access to students via their fourth-grade teachers in order to collect the unknown variable of preschool program type attended. Hope was ignited in my heart in the instant that he agreed to have the district participate in this study. Similarly, Brian Reeder, Assistant Superintendent for the Office of Research and Data Analysis at ODE, graciously supported my process by providing comprehensive data files organized neatly and concisely for each requested variable. He was meticulous in his approach and ensured that in the instances where district identification numbers were provided, such students were accurately matched to their state-given SSID number.
I would like to acknowledge the eighty-two parents/guardians who voluntarily chose to return study materials, as they recognized how their input might impact ECE policy and programming within Oregon by enhancing an understanding of how attending preschool
programs before Kindergarten may affect academic success in the early elementary grades. I am grateful for the support of the principals, teachers, and the students at the school sites for their willingness to deliver and manage study materials until the collection date.
Finally, I would like to thank my son, Brody, who has been very patient in enduring his mother’s preoccupation with homework many evenings of the past year and a half. I am joyful to
love given by Frank, Lori, and my mom have been immeasurable, and I am grateful to each of them.
TABLE OF CONTENTS
Abstract ………...2
Acknowledgements………..3
Table of Contents……….6
List of Tables……….10
CHAPTER 1………..11
Introduction………....11
Purpose of the Study………15
Research Questions………..16
Significance of the Study……….16
Limitations………...16
Summary………..18
CHAPTER 2………..19
Review of the Literature………19
Oregon’s Early Childhood Legislation………19
Preschool Selection……….20
Outcomes Associated with Preschool………...20
Outcomes Associated with Child-Care Centers………21
Outcomes with Head Start………22
Model Programs………..23
Matters of Program Quality………25
A National Focus on Kindergarten Readiness………27
Screening Indicators of Kindergarten Readiness………...30
Kindergarten Readiness Assessment in Oregon………...31
Preparing for the Kindergarten Transition………....31
Kindergarten Readiness Beliefs of Educators and Parents………...32
Preparing the School Environment………...33
The Formative Years Preceding Kindergarten………....34
Outcomes Associated with Socioeconomic Status………35
Outcomes Associated with Race/Ethnicity………37
The Importance of Program Quality and Monitoring………...37
Summary………...38
CHAPTER 3………..40
Methods………...40
Design………..…40
Sampling Design………..42
Instrumentation and Administration………....43
Data Analysis and Procedures……….44
Significance of the Study………46
IRB Approval………..46
Research Ethics………...47
CHAPTER 4………..48
Results………48
Data Linking………49
Independent Variable: Pre-K Program Type………...51
Independent Variable: Race/Ethnicity……….51
Independent Variable: Socioeconomic Status……….52
Summary of Demographic Characteristics………..52
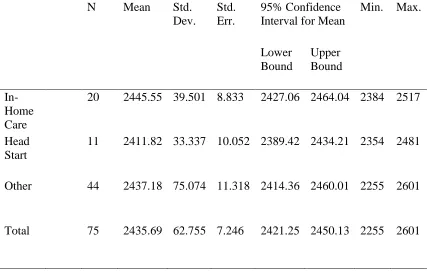
Dependent Variable: SBAC Mathematics Outcomes………..53
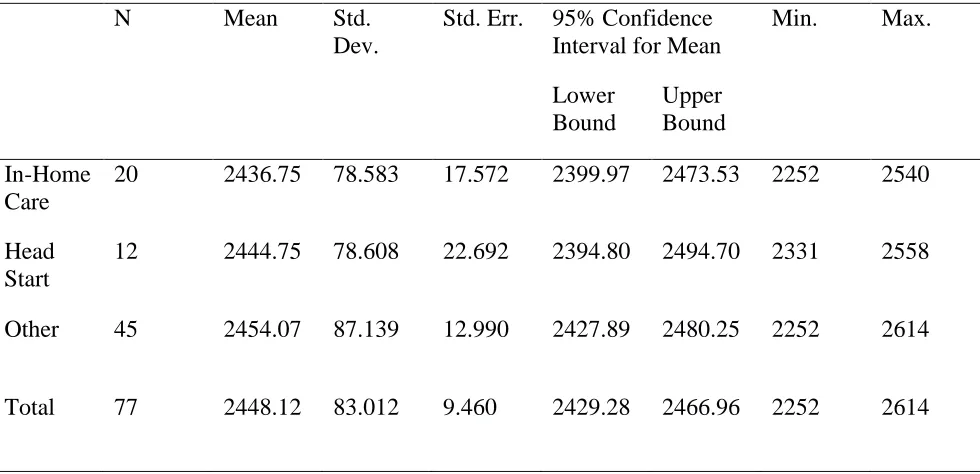
Dependent Variable: SBAC ELA Outcomes………...56
Inferential Statistics………...58
Research Question 1………..58
Pre-K Program Type Effects on SBAC Mathematics……….58
Race/Ethnicity Effects on SBAC Mathematics………...60
Socioeconomic Status Effects on SBAC Mathematics………...62
Research Question 2………..62
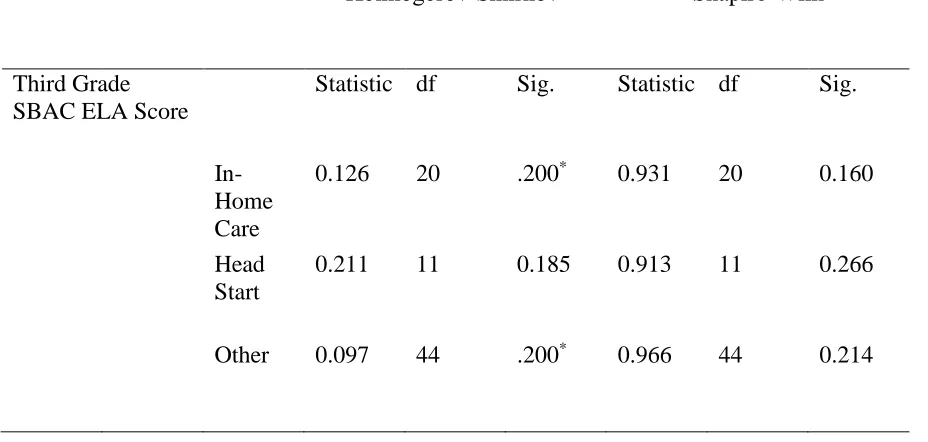
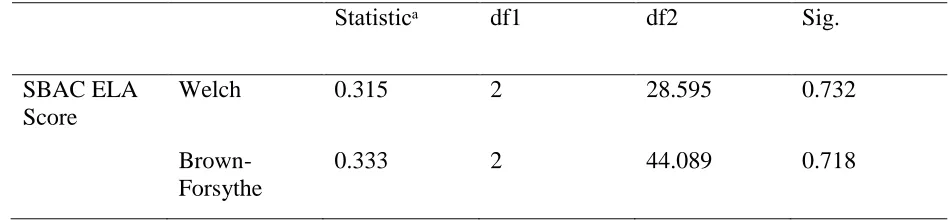
Pre-K Program Type Effects on SBAC ELA………..63
Race/Ethnicity Effects on SBAC ELA………64
Socioeconomic Status Effects on SBAC ELA………....66
Summary……….66
CHAPTER 5………..68
Discussion and Conclusion………...68
Discussion Pertaining to Findings: Pre-K Programs………...68
Discussion Pertaining to Findings: Race/Ethnicity……….71
Investing in Equity and Social Justice……….72
Considerations for Policymakers, Practitioners, and ECE Stakeholders……….72
Suggestions for Future Research……….79
Conclusion………...82
References……….84
Appendices………95
Appendix A: IRB Documentation………96
Exhibit A: IRB Proposal………96
Exhibit B: IRB Guardian Informed Consent………...102
Exhibit C: Parent/Guardian Questionnaire (English/Spanish)………106
Exhibit D: IRB Approval Letter………...108
Appendix B: Research Agreement/Data Use Agreement ODE………..109
Appendix C: Communication with School Officials………...115
Exhibit A: Request for Study Participation………...115
Exhibit B: Communication with Building Principals……….118
Exhibit C: Guidelines for Classroom Teachers………..120
Exhibit D: Clarification on Guidelines………...121
Exhibit E: Request for SSID Matching………..122
LIST OF TABLES
TABLE 1: Statistical Tests Selected………..45
TABLE 2: Demographic Characteristics by Program Type, Race/Ethnicity, and SES…………53
TABLE 3: SBAC Mathematics Scores by Pre-K Program Type………...55
TABLE 4: SBAC Mathematics Scores by Race/Ethnicity………....55
TABLE 5: SBAC ELA Scores by Pre-K Program Type………...57
TABLE 6: SBAC ELA Scores by Race/Ethnicity……….57
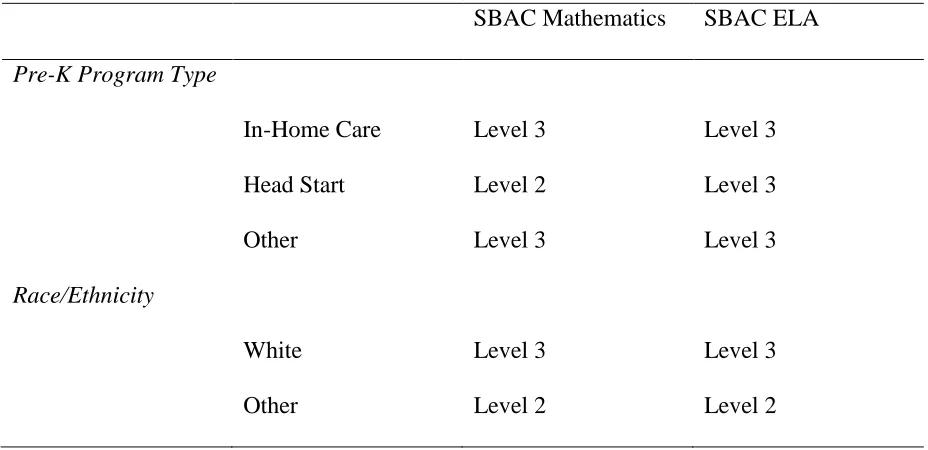
TABLE 7: Achievement Levels for Mean SBAC Scores by Pre-K Program Type and White vs. Other………..58
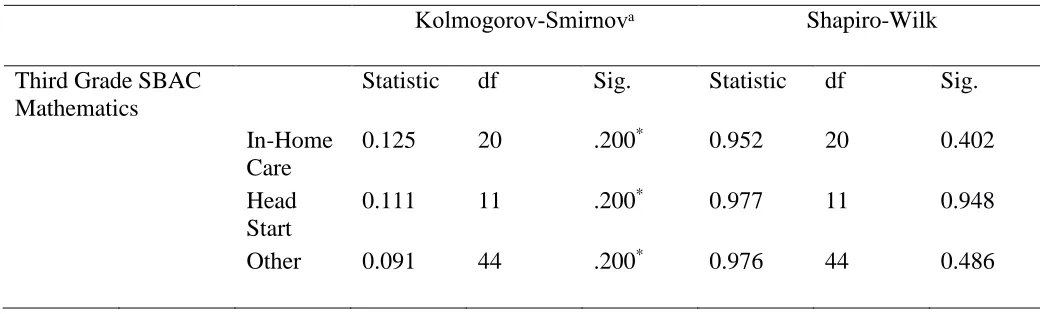
TABLE 8: Tests of Normality Results for SBAC Mathematics by Pre-K Programs…………..59
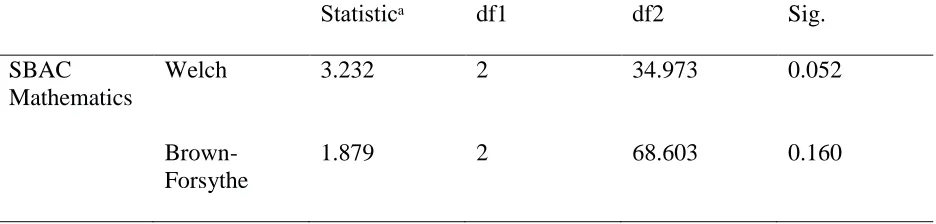
TABLE 9: Robust Tests of Equality of Means Results for SBAC Mathematics by Pre-K Programs………....60
TABLE 10: Tests of Normality Results for SBAC Mathematics by Race/Ethnicity………61
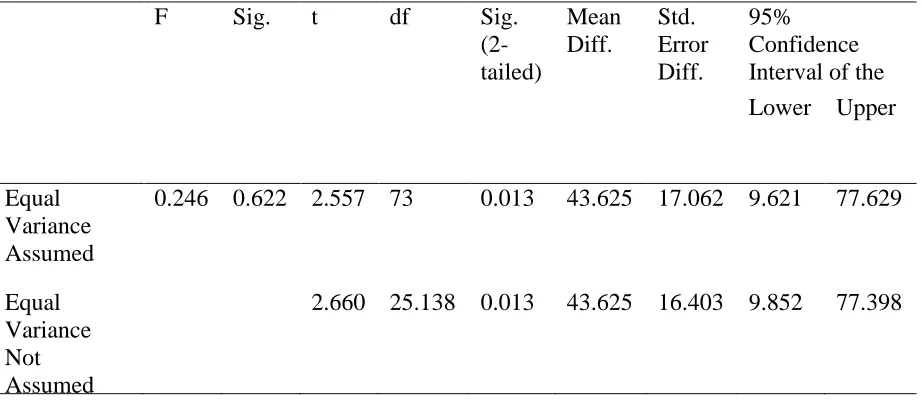
TABLE 11: T-Test for Equality of Means Results for SBAC Mathematics Scores by Race/Ethnicity………...61
TABLE 12: Tests of Normality Results for SBAC ELA by Pre-K Programs………..63
TABLE 13: ANOVA Results for SBAC ELA by Pre-K Programs………..64
CHAPTER 1
INTRODUCTION
Across the nation, there is a growing emphasis on the importance of early childhood education (Gewertz, 2014; Karch, 2010). Determining the needs of our youngest students, ensuring they are ready for Kindergarten, and improving early childhood education is at the forefront of current national education reform (Gewertz, 2014; Hatcher, Nuner, & Paulsel, 2012). Policymakers and stakeholders are invested in creating a comprehensive system of education that is founded on the quality of preschool and Kindergarten programs (Maxwell, 2012; Temple & Reynolds, 2005). This nationwide trend of prioritizing early childhood education is highlighted by state policymakers investing nearly $7 billion dollars in ECE programs in the 2015-16 fiscal year (Ali et al., 2016).
With the changing landscape of K-12 education increasing academic rigor through such initiatives as the Common Core State Standards, providing an effective, high-quality educational foundation for all children poised to enter the public-school system is critical to each child’s academic success in Kindergarten and subsequent grades within Oregon’s public school system. This study sought to explore the relationship between a child’s access to preschool programming in the year prior to Kindergarten and their subsequent academic achievement outcomes measured by standardized assessments administered in third grade.
There are only a few short years between Kindergarten and third grade, at which point a child’s performance is an indicator of long term academic outcomes (Alexander & Entwisle,
academic achievement (Chew & Morris, 1989). Lower levels of initial school readiness have also been shown to correlate with future grade retention (Davoudzadeh et al., 2015). Strengths and weakness possessed by children upon Kindergarten entry create discernible readiness profiles that influence future achievement outcomes (Cheung, Hans-Vaughn, McWayne, & Wright, 2012; Furlong, Quirk, & Nylund-Gibson, 2013). Kindergarten teachers are tasked with moving each child towards attainment of specified learning targets and standards, and some children enter Kindergarten better prepared than others to meet these academic demands based upon their prior life experiences (Buysse & Wesley, 2003). In fact, a growing number of children are identified as being unprepared for Kindergarten. (Fitzpatrick & Pagani, 2014; Whitted, 2011).
The experiences in a child’s life prior to Kindergarten shape their readiness for school and correlate to later academic achievement outcomes across the child’s formal years of
schooling (Bryant, Christian, & Morrison, 1998; Davoudzadeh, Grimm, & McTernan, 2015; Furlong, Quirk, & Nylund-Gibson, 2013; Magnuson, Meyers, Ruhm, & Waldfogel, 2004). “Early brain and child development research unequivocally demonstrates that human development is powerfully affected by contextual surroundings and experiences” (Glassy &
Roman, 2005, p. 187). An expanded awareness of the correlation between early childhood learning experiences and long-term academic achievement outcomes has made early childhood education a national priority (Johns, 2005).
Harmon, Heckman, & Tremblay, 2009; Duncan & Magnuson, 2013; Herman-Smith, 2012; Kaufman et al., 2015; Magnuson & Shager, 2010). Such benefits include short-term gains of increased academic achievement and reduced identification for special education classes or grade level retention, as well as longer term gains of increased high school completion rates and
continued educational attainment, ability to earn a higher wage, higher tax revenues for society, and fewer incidence of crime (Clothier & Poppe, 2007; Doyle et al., 2009; Duncan & Magnuson, 2013; Herman-Smith, 2013; Kaufman et al., 2015). Thus, the early investment in educating our nation’s youngest children may be costly to implement, but the benefits to society are increased
adult productivity that result in sustained and long-term returns (Doyle et al., 2009; Temple & Reynolds, 2005).
Glassy and Romano (2005) found that children who attend high-quality child-care programs have higher skills in the areas of math, language, cognition, social skills,
self-regulation, and interpersonal relations as compared to their peers immersed in lower quality care prior to Kindergarten entry. In Georgia, Gibbs, Kees Taylor, and Slate (2000) investigated the effect on Kindergarten Readiness as measured by the Georgia Kindergarten Assessment Program based upon preschool access prior to Kindergarten and found that children who attended
strong academic focus (Magnuson, Myers, Ruhm, &Waldfogel, 2004). Children living in poverty who attended Title 1 public Pre-K programs embedded within local elementary school sites showed greater gains in cognitive and language development than their peers who attended community based child-care programs (Bleiker, Hartman, Madigan, Manfra, Tran, & Winsler, 2008). This effect is also true for children who attend Pre-Kindergarten programs as compared to their peers who attend Head Start (Brooks-Gunn, Waldfogel, & Zhai, 2011). Upon analysis of the Early Childhood Longitudinal Study-Birth Cohort of 2001, which consisted of a nationally representative sample of 10,700 children, children who attended Head Start were shown to have lower school readiness scores than their peers who attended Pre-K or other center-based care, though their scores were higher than children in other forms of non-parental care or parental care (Brooks-Gunn et al., 2014).
Cox, Pianta, and Rimm-Kaufman (2000) reported that 52% of students entered
As all children stand to benefit from exposure to high-quality preschool programming, investigating the programs that create the largest sustainable gains for children will be important for Oregon policymakers to consider, as the literature has shown that Kindergarten readiness is impacted by pre-Kindergarten program types and quality. Research is needed that is specific to Oregon’s children and state programs. This research aimed to add to the body of state-specific
research needed to drive Early Childhood Education policy forward in order to provide a solid foundation for all children to be successful in Kindergarten and beyond by examining a student population within a specific school district within the state.
Purpose of the Study
The purpose of this research was to determine if a relationship existed between categories of preschool programming accessed in the year prior to Kindergarten entry, in addition to
race/ethnicity and socioeconomic status, and academic achievement outcomes four years later in third-grade. “We know little about what parents do to prepare their child for Kindergarten” (Bandyk, Diamond, & Reagan, 2000, p. 94), yet the changing landscape of K-12 education is correlated with the need for effective, high quality Pre-K programs and equitable access for all children to such programs. Additionally, the purpose of Kindergarten is evolving, as a shift from its conception as a place for children to be socialized is moving toward an increasingly academic model (Buysse & Wesley, 2003; Hatcher, Nuner, & Paulsel, 2012).
Research Questions
1. What is the relationship between students’ Pre-K program type, race/ethnicity, family SES, and their third grade Smarter Balanced Assessment Consortium Mathematics score?
2. What is the relationship between students’ Pre-K program type, race/ethnicity, family SES, and their third grade Smarter Balanced Assessment Consortium English Language Arts score?
Significance of the Study
With the implementation of full-day Kindergarten in Oregon, the Kindergarten
population has changed dramatically. The Oregon Department of Education reported in the 2016 Enrollment Summary Report that the number of Oregon children enrolled in full-day
Kindergarten has risen from 4,625 in the 2003-04 school year to 17,609 in the 2014-15 school year. Across Oregon school districts, there is wide variability in regards to the availability of high-quality preschool programs and access for children prior to Kindergarten entry. Not all children enter Kindergarten with the developed skills imperative to academic and social success, thus making a case for the increased access to and expansion of high-quality preschool programs across Oregon. This study contributes by exploring the types of preschool experiences that correlate with grade level achievement in the third-grade.
Limitations
collected and securely maintained by ODE, but the preschool programming variable remained unaccounted for, thus requiring this study to rely upon self-reporting by parents/guardians to determine preschool programming attendance prior to the commencement of Kindergarten. Self-reporting can in and of itself be considered a limitation, as in this study, it required the accurate recollection of an event from four years prior, as study participants had just begun the fall of their fourth grade year of schooling and data analysis was possible due to the availability of their SBAC scores from the spring of third grade. Additionally, parents/guardians who self-reported had to make a distinction between two categories that were difficult to isolate from one another: Private Preschool and Child-Care Center. It is possible that parents’ incorrect interpretation of these broad categories influenced inaccurate responses, though in the process of analytics, these categories were collapsed into a combined category out of necessity.
Additionally, though research on the preschool program Head Start is extensive, the body of research on other preschool program types such as In-Home Care and Preschool in an
Elementary School, is meager at best. Thus, providing a comprehensive overview of the variety of preschool programs in existence and their relationship to measures of academic achievement was impacted by the modest research on this topic from which to draw upon.
Summary
Research, policy work, and the day-to-day life in the elementary classroom highlight the importance of exposure to high-quality learning opportunities for young children prior to
CHAPTER 2
REVIEW OF THE LITERATURE
This review of literature contains analysis of outcomes for preschool programs previously studied, precursors to Kindergarten readiness that relate to future academic success, and
predictors of academic achievement beyond Kindergarten. These studies offer a broader research narrative that informed this study. Additionally, Oregon legislative issues offer context for this study.
Oregon’s Early Childhood Legislation
2012 marked the passage of Oregon House Bill 4165, which established the state-wide Kindergarten Assessment, Quality Rating and Improvement System (QRIS) for early childhood programs in the state, and began the work of alignment between early childhood stakeholders and providers (Children’s Institute, 2015). Additionally, Oregon House Bills 3380 and 5016
were successfully passed in 2015, which invested twenty-seven million dollars in high-quality preschool programming in Oregon and an additional five million dollars in the Kindergarten Partnership and Innovation Fund, which in 2014 granted four million dollars to Oregon
communities and school districts to increase alignment efforts between early childhood programs and the Oregon public school system (Children’s Institute, 2015).
In addition to these recent acts of legislation in the state, Oregon’s initial year of offering full-day Kindergarten statewide occurred in the 2015-16 school year. The Kindergarten
and Mathematics SBAC data impossible prior to the 2016-17 school year, though interest exists in the potential relationship between the two measures for Oregon’s children.
Preschool Selection
Parents and guardians of young children have the freedom to select the preschool
program of best fit for their family, though access for their child may be limited due to financial constraints or availability of openings in the preferred program. Although access to high-quality childcare and preschool programming is often desirable, barriers such as cost prohibit equal access for children across tiers of socioeconomic status (Glassy, Romano et al., 2005). “Families facing economic constraints are limited in the quality and types of learning experience they can provide for their children” (Magnuson et al., 2004, p. 117). In the face of such findings, ECE
stakeholders are called upon to examine who has access to which programs based upon SES, and moreover, to investigate how access to types of programs correlates to both initial and persisting academic achievement outcomes.
Impoverished children who access informal care are more likely than their economically advantaged peers to be in the care of a relative rather than a non-relative, which perpetuates the school readiness gap (Magnuson et al., 2004; Cooper Stoll & Delgado, 2015). In a national sample of 12,800 Kindergarten students in 1998, Magnuson et al., (2004) noted that 83% of children had received non-parental care in the previous year, with forms of center-based care being represented as 61%, while Head Start and other non-parental care each represented 11% of the care and educational opportunities afforded to young children.
Outcomes Associated with Preschool
strong academic focus (Magnuson et al., 2004). Children from low-income families have shown greater gains in expressive language in universal versus targeted Pre-K programs, though gains were made regardless of program type in the areas of letter naming, receptive language, rhyming, applied problems, and naming numbers (Bryant, Bruchinal, Dotterer, Early, & Pianta, 2013). Children living in poverty who attend Title 1 public Pre-K programs showed greater gains in cognitive and language development than their peers who attended community based child-care programs (Bleiker, Hartman, Madigan, Manfra, Tran, & Winsler, 2008). This effect is also true for children who attend Pre-Kindergarten programs as compared to their peers who attend Head Start (Brooks-Gunn, Waldfogel, & Zhai, 2011).
Gibbs, Kees-Taylor, and Slate (2000) investigated the effect on Kindergarten readiness as measured by the Georgia Kindergarten Assessment Program (GKAP) based upon preschool program access prior to Kindergarten and found that children who attended preschool scored higher on the overall GKAP, as well as the Physical and Personal indicators, than did students who did not attend preschool. A study in Oklahoma examined Tulsa’s universal preschool
program and deemed it most beneficial for Hispanic children, especially those whose primary home language was Spanish or whose parents were born in Mexico (Gormley, 2008).
Outcomes Associated with Child-Care Centers
skills ending the year performing near the national average (Bleiker et al., 2008). Additionally, child-care centers have helped ethnically diverse, low income children obtain necessary school readiness skills in their year prior to Kindergarten (De Feyter & Winsler, 2009).
Attendance in child-care centers also produces high levels of math achievement for children most at-risk (Bryant et al., 1998). Furthermore, Latino children in child-care centers exhibit higher reading scores compared to Latino children who attend Head Start or informal care (Cooper Stoll & Delgado, 2015). Latino children who attend child-care centers also exhibit higher levels of cognitive, language, and fine-motor skills growth as compared to their peers who access childcare in the home of a non-relative (Ansari & Winsler, 2012). Although it should also be noted that the majority of child-care centers nationwide are rated poor to mediocre in quality (Glassy & Romano, 2005).
Outcomes Associated with Head Start
Federal initiatives such as Head Start target a specific population of children ages 3-5 from low income families, and the funds are directly disbursed from the federal government to local service providers. Programs such as Head Start seek to equalize the educational
opportunities for at-risk children from low-income homes, though Head Start is not adequately funded to serve all children who qualify nationwide, leaving a gap in accessibility for our nation’s neediest children (Finn, 2014; Hustedt & Barnett, 2011).
compared to their peers in parental care (Brooks-Gunn et al., 2011). In contrast, no significant cognitive development effects are present when children who attended Head Start are compared to children who attended preschool or center-based care programs (Brooks-Gunn et al., 2011). Maternal education for children in Head Start programs was found to be lower than that of parents of children enrolled in preschool or center-based programs but higher than mothers whose child was in parental care (Brooks-Gunn et al., 2011). Such findings imply that the educational level of a child’s mother has significant bearing on the educational opportunities afforded to the child prior to Kindergarten entry.
Upon analysis of the Early Childhood Longitudinal Study-Birth Cohort of 2001, which consisted of a nationally representative sample of 10,700 children, children who attended Head Start were shown to have lower school readiness scores than their peers who attended Pre-K or other center-based care, though their scores were higher than children in other forms of non-parental care or non-parental care (Brooks-Gunn, Han, Lee, Waldfogel, & Zhai, 2014). Cheung, Hans-Vaughn, Wayne, and Wright (2012) conducted an analysis of a nationally representative sample of Head Start children across cognitive and social indicators and delineated six distinct academic and social profiles, supporting the notion that within-group variability is present amongst children in poverty, and some are better poised for academic success than others. Head Start is deemed most beneficial for children with less-educated parents than for children whose parents have higher levels of education (Brooks-Gunn et al., 2014).
Model Programs
early education program in Yypsilanti, Michigan that in 1960 randomly assigned disadvantaged African-American children to a treatment and control group and followed participants through age 40 (Heckman, Moon, Pinto, Savelyev, & Yavitz, 2010). The two-year program consisted of half-day school sessions in which teachers with college degrees made home visits to partner with the child’s mother in educating the child. Upon Kindergarten entry, the treatment group
expressed cognitive gains of one standard deviation compared to the control group (Herman-Smith, 2012). The cost per each child participant receiving treatment was $17,759, yet the annual rate of return to society was 5.8% (Heckman et al., 2010). The benefits to society are calculated through savings associated with reduced crime rates and decreased social dependence, as well as positive investments of increased educational attainment, increased earnings, and corresponding taxes paid back into society (Heckman et al., 2010). This study was limited by a small sample of 123 participants and is associated with a high per-child cost, which causes some to question its generalizability, especially to state-funded universal Pre-K programs (Finn, 2010).
The third model program is the Chicago Child-Parent Centers that are federally-funded, located in high poverty neighborhoods, and are accessible to preschool-age children through second or third grade (Temple & Reynolds, 2007) A longitudinal study followed 1,539 low-income, mostly African-American children, 989 who attended CPC in 1983-1984 and compared these children to 550 who attended a Kindergarten intervention without having attended CPC preschool. Participants were followed through age 22, and the rate of return on investment to the public for children who attended CPC preschool programs was calculated at $10.15 per dollar spent (Temple & Reynolds, 2007).
Matters of Program Quality
2,435 children in the 11 state NCEDL study. Increases in language and mathematics outcomes were correlated to increases in preschool center quality (Burchinal et.al, 2013).
Miller and Vortuba-Drzal (2016) conducted a meta-analysis of eight large-scale studies of preschool and child-care centers to examine the relationship between program quality and developmental and readiness outcomes for children who were served, the majority identified as being from low SES households who accessed Head Start or publically funded Pre-K, thus impeding generalizability to a broader population. Preschool programs established to higher quality standards produced positive gains in literacy and language outcomes (Miller & Vorutba-Drzal, 2016). Additionally, the quantity of instructional time was a strong predictor of math, language, and literacy skills (Miller & Vourtuba-Drazal, 2016). Quality and indicators of school readiness beyond language and literacy have not been strongly associated, which may be a result of the over-utilization of a measurement instrument (ECERS-R) criticized for its poor
psychometric properties. (Miller & Vortuba-Drazal, 2016). This global instrument of quality has been influential in the development of the Quality Rating and Improvement Systems used in states across the country, including Oregon, to establish the quality of the preschool and childcare programs within the state, therefore, Miller and Vortuba-Drazal (2016) counsel that there is an “urgent need to identify exactly what constitutes high-quality preschool when it comes to promoting school readiness skills.” (pg. 104). Furthermore, Miller and Vortuba-Drazal
The take-home message is that if we want preschool to promote certain skills and competencies more effectively in children, we have to implement classroom practices that target these skills in explicit, intentional ways. Simply providing children with safe, stimulating and nurturing environments, as indexed by global quality measures such as the ECERS-R, may produce modest gains in school readiness, but the largest gains will be realized in classrooms where teachers use evidence-based practices to target specific skills and competencies underlying school and life success. (p. 107)
A National Focus on Kindergarten Readiness
While Kindergarten readiness is deemed a national priority, it lacks a universally agreed-upon definition (Buysse & Wesley, 2003; Calkins, Halle, Hair, Lavelle, & Terry-Humen, 2006; Choi et al., 2005; Fulgini et al., 2008; Gorrell, Lawrence, & Lin, 2003; Hatcher et al. 2012). “Kindergarten readiness is a complex idea linked to multiple meanings and factors” (Hatcher et
The literature highlights various aspects of a child’s development and skill attainment as
being critical to Kindergarten readiness without agreeing upon a precise list of attributes, characteristics, or skills. Additionally, there is not consensus of these skills’ significance in
relation to creating academic gains. Boones, Cassidy, & Mims (2003) delineate five domains that impact a child’s readiness for Kindergarten: physical health and motor development, social and
emotional development, language development, cognition and general knowledge, and approaches towards learning. Much of the literature expands upon these domains, while also adding additional layers of readiness such as developed executive functioning skills, ability to attend to personal needs, interpersonal skills, and age or maturity.
Precursory Skills
Literacy skills are fundamental to Kindergarten readiness and include letter recognition, associating letters with sounds, recognizing sight words, and writing one’s own name (Brown & Gasko, 2012; Buysse & Wesley, 2003; Hatcher et al, 2012; Irvin et al, 2015). Language skills are closely related to measures of general intelligence (Fitzpatrick & Pagani, 2014). Furthermore, cognitive functioning is a strong indicator of Kindergarten readiness and academic success (Field, Kupersmidt, Voegler-lee & Willoughby, 2012).
academic and social success (Cantin, Hund, & Mann, 2012). Difficulty following directions is one of the most commonly identified problems in Kindergarteners who struggle to meet the demands of school (Cox et al., 2000).
Social and emotional development, such as appropriately interacting with peers and adults, following rules, managing emotions, expressing needs, and being independent are
foundational to school adjustment and academic success (Buysse & Wesley, 2003; Irvin, Tindal, Nese, & Slater, 2015; Reid & Webster-Stratton, 2004). “Socially competent children are also more academically successful, and poor social skills are a strong predictor of academic failure”
(Reid & Webster-Stratton, 2004, p. 96). Children who lack social-emotional skills are more likely to experience alienation in the school setting. Additionally, lacking these necessary skills can produce a negative relationship between the child and Kindergarten teacher, which is
points to the need to include a physical/motor descriptor in the definition of Kindergarten readiness.
Screening for Indicators of Kindergarten Readiness
It is imperative that screening tools be developed and utilized for early detection of academic and behavior skill deficits at the entry to Kindergarten, as poor ratings of readiness are associated with negative outcomes for the individual child such as ongoing behavioral and academic difficulties (Herman, King, Owens, & Reinke, 2015). “Screening children’s overall
behavioral and academic readiness during their entry into Kindergarten presents an opportunity for identifying children unprepared for this significant life event” (Herman et al., 2015, p. 213).
Early identification of skill deficits must be coupled with a plan for timely intervention focused on intentionally developing the necessary skills.
Magnuson, Meyers, Ruhm, and Waldfogel (2004) measured each participant’s math and reading skills at the beginning and end of Kindergarten, as well as the beginning of first grade. The assessment tool was composed from aspects of preexisting instruments including the
Peabody Individual Achievement Tests-Revised and the Woodcock-Johnson Psycho-Educational Battery-Revised (Magnuson et al., 2004). Gibbs, Slate, and Taylor (2000), utilized the Georgia Kindergarten Assessment Program as a measurement tool of school readiness; this tool was created by the state’s Content Review Committee, which consisted of eighteen members with
expertise in the areas of Early Childhood Education and school readiness. Of the three
of a child’s readiness was measured within five specified domains developed from the literature
based upon the researchers matching key indicators of the domains to the ECLS-K data. Kindergarten Readiness Assessment in Oregon
In 2012, the Early Learning Council in Oregon adopted the Kindergarten Assessment (KA) to be utilized annually in public schools within the state and administered in the first six weeks of Kindergarten each school year in order to assess the readiness skills of children
entering the Oregon public school system. After its initial launch in the fall of 2013 with a 95% participation rate statewide, the first results were available for review in 2014 and highlighted the presence of an early achievement gap that was especially notable between children living in poverty and their peers from higher SES households due to inequities in access to high-quality early learning opportunities and lack of exposure to early literacy and mathematics concepts (Adarkar, 2014). 33% of incoming Kindergarten students recognized no more than five letters, and 37% could not identify sounds for any letters in the alphabet (Adarkar, 2014). “The best indicators of a child’s future school success are not found in only children’s behavior but also
include their pre-academic skills such as early literacy and numeracy” (Green, Love, McClelland, & Squires, 2014, p. 1).
Preparing for the Kindergarten Transition
Across various studies, parents have expressed anxiety about their children not being ready for Kindergarten due to the increased academic demands and behavioral expectations (Bandyk et al., 2000; Hatcher et al., 2012). One of the difficulties parents face is having a limited understanding of the school’s view of readiness and what is expected of their child (Buysse &
As stakeholders strive for consensus in defining Kindergarten readiness, it will be imperative for educators and families to actively partner to prepare young children for entry into a formal school environment (Buysse & Wesley, 2003; Choi et al., 2005; Cox et al., 2000). Families can aid in Kindergarten readiness by providing rich, stimulating opportunities for learning in the home environment, while preparing the child to be emotionally ready for the transition (Buysse & Wesley, 2003; Fulgini et al., 2008). Furthermore, exposing young children to group settings and assisting them in separating from figures of attachment will also aid in the transition to Kindergarten (Buysse & Wesley, 2003). Prior to Kindergarten entry, professional educators in a study by Buysse and Wesley (2003), determined that children learn by:
the use of all five senses, play and pretending, relationships and social interactions, imitation, hands-on experiences with materials, active exploration of environments both indoors and outdoors, repetition, a balance of adult instruction and opportunities to choose one’s own activities, conversations, looking at books and being read to, music, and predictable daily routines” (p. 361).
Educators must intentionally create opportunities to communicate such information regarding child development and best practices with the families of incoming Kindergarten students. Additionally, sharing positive parenting strategies is an avenue to bolster development of social and emotional competencies in young children prior to Kindergarten entry (Reid & Webster-Stratton, 2004).
Kindergarten Readiness Beliefs of Educators and Parents
Wesley, 2003; Choi et al., 2005; Gorrell et al., 2003; Hatcher et al., 2012). Parents and teachers alike understand that schools are both academic and social environments which require skills in both dimensions (Hatcher et al., 2012). Parents place great emphasis on academic skill
acquisition when determining if their child is Kindergarten-ready (Bandyk, Diamond, & Reagan, 2000). In a study conducted by Herman, King, Owens, Reinke, and Stormont (2015), academic and overall readiness were expressed in near perfect correlation supporting the notion that teachers greatly weighted a student’s academic background when making a determination about
their overall school readiness. Gorrell, Lawrence, and Lin (2003) found that younger teachers placed greater emphasis on the necessity of academic skills when making a determination about Kindergarten readiness. One might infer this finding correlates with the shift that is occurring nationwide to increase academic rigor and alignment across our system of education as
expressed by such initiatives as the Common Core State Standards (Barnett & Carolan, 2013). Preparing the School Environment
Multiple studies have called into question the school’s ability to be ready for the Kindergarten child. Knowledge of early childhood development, appropriate instructional strategies, and the environment are key components to address when determining if a school is ready to receive Kindergarten students (Buysse & Wesley, 2003). “All too often, children are forced to be ‘ready’ for an inappropriate environment that contains few of the components that would make it ‘ready’ for them” (Cassidy et al., 2003, p. 199). Kindergarten teachers have
voiced feeling conflicted when expressing what is developmentally appropriate for
incoming Kindergarteners (Buysse & Wesley, 2003). Furthermore, strengthening the alignment of curriculum and practices between early childhood education programs and elementary schools is crucial to ensuring children are Kindergarten ready (Brown & Gasko, 2012; Desimone,
Fedoravicius, Finn-Stevenson, Henrich & Payne, 2004).
Teachers can be trained in strategies that promote social skills within their students, as the interaction between the teacher and student affects a child’s social and emotional outcomes (Reid & Webster-Stratton, 2004). The Ready to Learn Program created measurable positive outcomes in the areas of listening comprehension, attending to task, and social skills for children in the treatment group, confirming that students can be taught the skills necessary for school success (Brigman & Webb, 2003). Even with such resources available, Kindergarten teachers in a study by Buysse and Wesley (2003) lamented that with the current focus on preparing the children for academic assessments, time was not available to support the necessary social and emotional development of their students.
The Formative Years Preceding Kindergarten
Children from homes that do not promote literacy and children who have mothers with lower educational levels or lower levels of financial status are most at-risk for academic
difficulties upon entrance into Kindergarten (Bryant et al., 1998). In a study of 538 Kindergarten students, Bryant et al., (1998) found that children from homes with low maternal education and low levels of home literacy environments scored lower on all academic measures and lacked necessary academic skills as compared to their peers, making them the most at-risk group entering Kindergarten.
The quality of a child’s home literacy environment in their preschool years is positively
receptive vocabulary, general information, and letter recognition (Baker, Cameron, Grissmer, & Rimm-Kaufman, 2012; Bryant et al., 1998; Cooper Stoll & Delgado, 2015). To illustrate its importance, children from homes with low maternal education but high home literacy
environments scored higher on academic measures as compared to their peers from homes with high maternal education and low home literacy environments (Bryant et al., 1998).
Outcomes Associated with Socioeconomic Status
Children living in poverty may less frequently experience stimulating learning
experiences in their home environments; additionally, such children have lower enrollment rates in center-based care programs (Magnuson et al., 2004). Children from homes with low levels of maternal education exhibit higher scores in school readiness, receptive vocabulary, reading achievement, and math achievement when accessing a formal child-care setting prior to
Kindergarten, as compared to their peers from homes with low levels of maternal education who were in the care of their parent (Boivin et al., 2010).
In a study by Dotterer, Iruka, & Pungello (2012), their findings were such that, “as SES decreased, negative/intrusive parenting behaviors increased, which were in turn associated with children’s lower pre-academic knowledge scores” (p. 665). The predictive power of SES is
mitigated by nurturing parenting styles and home learning stimulation (Baker, Cameron, Grissmer, & Rimm-Kaufman, 2012). An analysis of the Early Childhood Longitudinal Study Kindergarten class of 1998-1999 revealed four school readiness profiles at Kindergarten entry across a nationally representative sample of 17,219 children: “comprehensive positive
development,” “social/emotional and health strengths,” “social/emotional risk,” and “health risk” (Calkins et al., 2006). Children identified in the profile “comprehensive positive development”
than the other profiles to be female, White, and live in a smaller household in which English was spoken with two parents who had higher levels of income and education.
Of the four profiles, children in the “comprehensive positive development” profile
exhibited the highest levels of school readiness which in turn predicted their first-grade math and reading achievement outcomes, while children from disadvantaged backgrounds whose parents had lower levels of education and income were more likely to fall into one of the two risk profiles. These disadvantaged children’s readiness gap was shown to persist through the end of first grade, at which time they performed poorly on academic measurements of reading and math (Calkins et al., 2006).
Children from low-income families less frequently experience educationally stimulating home environments that promote brain development (Herman-Smith, 2013; Magnuson & Shager, 2010). Neurological risk, human genetics, and parenting practices have been implicated in academic disparities in children of low income homes (Herman-Smith, 2013). In a
longitudinal study of 5,000 children who attended Educare centers nationwide, which support low income families and children from birth to Kindergarten entry, researchers determined that the longer a child is exposed to high-quality care, the higher their level of school readiness skills (Yazejian, Bryant, Freel, & Burchinal, 2015). “Thus, the promise of early education to remediate disadvantaged children’s achievement rests on its ability to provide enriching social and
grade for students eligible for free-lunch who had attended Tulsa’s Universal Pre-K Program as compared to their like peers who did not attend the program.
Outcomes Associated with Race and Ethnicity
In a study of pre-academic knowledge of European American children and African-American children, a gap was already present at 36 months of age with European African-American children scoring higher than their African American counterparts on measurements of school readiness (Dotterer, Iruka, & Pungello, 2012). Upon Kindergarten entry, an achievement gap is a present between economically advantaged White children and Latino children who live in
poverty (Furlong, Quirk, & Nylund-Gibson, 2013; Han, Lee, & Waldfogel, 2012). The math and reading achievement gap between African-American children and their White peers widens over the course of the Kindergarten year, while the reading achievement gap between White children and their Hispanic peers remains steady (Quinn, 2015). Yet differences in standardized test scores attributed to ethnicity or family type are more frequently shown to be outcomes of poverty (Alexander & Entwisle, 1993; Quinn, 2015).
The Importance of Program Quality and Monitoring
children included an out-of-home preschool classroom, a minimum of half-day programming five days a week for the standard school year, low staff–to-child ratios, trained staff, and home visits or other forms of direct interaction with families to help them engage their children in optimal growth and development. In 2009-2010, 18 states required Pre-K teachers across settings to hold a Bachelor’s degree, while the remaining 22 did not enforce such a requirement (Hustedt
& Barnett, 2011). Kansas piloted a preschool program in 6 counties whose quality controls included requirements for teacher qualification and low teacher-to-child ratios (Clothier & Poppe, 2007). “Because quality is theorized and measured in many different ways, there is not one universally accepted definition as to what constitutes high-quality learning environments” (Dynia, Justice, Kaderavek, Logan, & Pelatti, 2016, p. 831).
Dynia et al., (2016) used regression models to analyze the structural and process quality of eighty-five Early Childhood Education and seventy-nine inclusive Early Childhood education classes from two large-scale studies as measured by the Classroom Assessment Scoring System (CLASS) and teacher and observation questionnaires. Higher levels of education by the lead teacher were associated with higher levels of process quality, while conversely, higher percentages of children from low-SES households within the sampled classrooms were
associated lower levels of quality in classroom organization and instructional support (Dynia et al., 2016).
Summary
increase access of early childhood programming for Oregon’s children, improve standards of
quality of such programming, and to align the early childhood system with the public-school system in the state. Based on the findings of referenced studies, such efforts will improve school readiness and positively impact future academic success for Oregon’s children in the public K-12
CHAPTER 3
METHODS
The following chapter describes the study’s methodology, which encompasses the study’s design, sampling plan, instrumentation, and analytics. This research aimed to answer the
following overarching research questions in order to ascertain the relationship between Pre-K program type, race/ethnicity, family SES, and third-grade achievement outcomes.
Research Questions:
1. What is the relationship between students’ Pre-K program type, race/ethnicity, family SES, and their third-grade Smarter Balanced Assessment Consortium Mathematics score? 2. What is the relationship between students’ Pre-K program type, race/ethnicity, family
SES, and their third-grade Smarter Balanced Assessment Consortium English Language Arts score?
Design
The research design was a secondary data analysis study aimed at determining the relationship between several independent variables, (preschool program type, race/ethnicity, and socioeconomic status), and the dependent variables of third Grade Math and English Language Arts achievement, which was measured using scores from the Smarter Balanced Assessment Consortium Mathematics and English Language Arts standardized achievement tests.
Several multiple regression models were to be attempted in order to examine the predictiveness of the defined independent variables of preschool program type, race/ethnicity, and socioeconomic status on the dependent variables of SBAC ELA and Mathematics outcomes.
student upon entry in Oregon public schools, the data set included the de-identified assessment scores from the Smarter Balanced ELA and Mathematics Assessment Consortium matched to the individual student’s race/ethnicity and socioeconomic status. Additionally, a questionnaire (see
Appendix A) was deployed to parents/guardians of all potential study participants in the identified school sites in the participating school district. The locally developed questionnaire honed in upon the educational opportunities via established provider (i.e. preschool program type) afforded each study participant in the year prior to entry into Oregon’s public school system at the Kindergarten grade level. Questionnaires were labeled by school officials and in some instances students themselves with each individual student’s SSID number, before being dispersed and collected by the fourth grade classroom teachers. Subjects with completed
questionnaire data, including a study consent form signed or initialed by the parent or guardian, were matched to the secondary data sets (SBAC Mathematics and ELA scores) provided by the Oregon Department of Education based upon each subject’s SSID number. Demographic variables added additional opportunities for analysis of relationships between identified variables. Demographic variables requested in the secondary data set from ODE included race/ethnicity and socioeconomic status.
Previous studies have examined both short-term initial gains upon Kindergarten entry as a function of preschool status, as well as have examined the lasting impact of preschool
who did not attend Tulsa’s Public Pre-K system (the control group) based upon standardized
measures of achievement testing in third grade. Sampling Design
The participants in the study were fourth grade students attending public school in a participating school district in the state of Oregon during the 2017-18 school year. Fourth grade students were selected, as they had completed the third-grade SBAC assessments in the spring of 2017, and their scores were available for review at the time this study took place. A convenience sampling plan was utilized, as the researcher had political connections to the district. These established connections allowed access by permission of the Director of School Improvement to six fourth-grade classrooms in two local elementary school sites, which was essential for
determining the sample and ascertaining each study participant’s preschool program type. Similarly, researchers in Oklahoma have utilized a convenience sampling plan when examining the difference in achievement outcomes based upon access to preschool programming. Adelstein, Gormley, and Hill (2015), selected a sample that was specific to Oklahoma with Tulsa being the district of study. Children were selected based upon availability of existing data.
by SSID number and were matched to the corresponding Smarter Balanced Assessment Consortium scores based upon this SSID number.
Third grade achievement data for study participants was collected via standardized Smarter Balanced Assessment Consortium state testing data in the areas of Math and English Language Arts for the 2016-17 school year. Assessment data is collected from school districts statewide and securely compiled and stored by the Oregon Department of Education. A Data Use Agreement was submitted by the researcher to the Oregon Department of Education to secure individual variables for each study participant except for the variable of preschool program attended, as this variable is not procured by ODE.
Instrumentation and Administration
A post-hoc data set was collected from the Oregon Department of Education, as this study’s primary focus was fourth-grade children in public schools in the participating school
district. The Oregon Department of Education is required by law to systematically collect and securely store third-grade grade achievement data annually from all public school districts in the state of Oregon.
Smarter Balanced Assessment Consortium Mathematics and English Language Arts standardized tests of achievement are administered annually in third grade in Oregon public schools. Common Core State Standards are assessed via a computer in a secure testing
year have been completed. The assessments are comprised of a Computer Adaptive Test and a Performance Task.
A voluntary questionnaire was distributed to parents/guardians of all fourth-grade students on the rosters of the six classrooms at the two participating elementary school sites. Students were identified on the questionnaire strictly by SSID number. The questionnaire probed for the identification of Pre-K status in the year prior to Kindergarten entry (In-Home Care with a Relative, In-Home Care with a Non-Relative, Head Start, Child-care Center, Private Preschool, Preschool in an Elementary School Site, and Other) for each fourth-grade student included in the study. The voluntary questionnaire was sent home to parents in September of 2017. Completed responses that included a signed study consent form that were received by September 29, 2017, which established the sample for the study.
Data Analysis Procedures
Several multiple-regression models were to be attempted in order to predict third-grade achievement outcomes based upon the established independent variables. Independent variables were weighted equally. According to Laerd Statistics, eight assumptions must be met in order to utilize a multiple regression model (Lund Research Ltd., 2013). The first and second
assumptions were met prior to initiating the study, as the dependent variables (SBAC Mathematics and SBAC ELA) are measured on a continuous scale, and two independent, categorical variables (Pre-K Status and Demographics) were present.
The remaining six assumptions could not be tested prior to employing tests of multiple regression. Independence of observation is verified using the Durbin-Watson statistic.
best fit (Lund Research Ltd., 2013). The lack of multicollinearity is determined if the
independent variables are not highly correlated to one another (Lund Research Ltd., 2013). The lack of significant outliers coupled with normally distributed residuals represent the final of Laerd’s eight assumptions for a multiple-regression model.
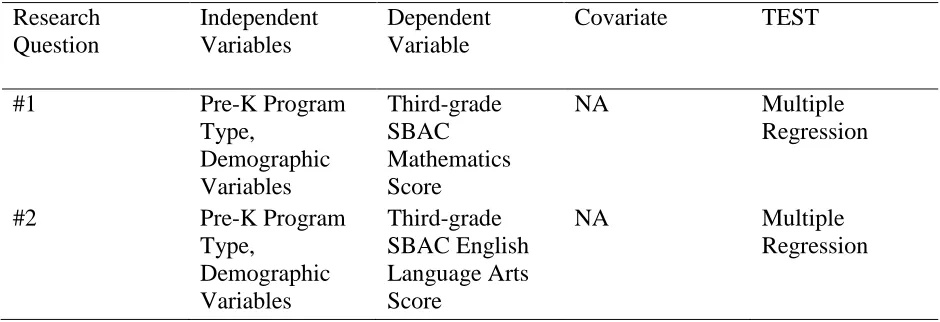
In the table that follows, independent and dependent variables in addition to statistical test that were applied are identified for the research questions.
Table 1
Statistical Tests Selected
Research Question Independent Variables Dependent Variable
Covariate TEST
#1 Pre-K Program
Type, Demographic Variables Third-grade SBAC Mathematics Score
NA Multiple
Regression
#2 Pre-K Program
Type, Demographic Variables Third-grade SBAC English Language Arts Score
NA Multiple
Regression
standard multiple regression in order to predict math and reading outcomes in the fall of a child’s
Kindergarten year based upon their child-care setting in the year prior to Kindergarten. Significance of the Study
This purpose of this study was to provide Oregon educational policymakers with
statistical data regarding levels of third-grade achievement outcomes based upon a child’s access to educational programming opportunities in the year prior to Kindergarten. This information highlights which programs are most effective at preparing the participating communities’ children for academic success and sustaining those gains through third grade. The variable of preschool program attendance is not systematically collected by ODE, and thus, insight into this variable and its relationship to achievement outcomes is beneficial to ECE stakeholders in Oregon.
IRB Approval
Upon approval of the Dissertation Proposal and prior to the initiation of this study, the appropriate IRB forms (see Appendix A) and supporting documentation were submitted to the George Fox University Doctor of Education department. IRB approval was granted on June 10, 2017 by George Fox University Institutional Review Board representative Terry Huffman, Ph.D. Following this approval, a Data Use Agreement (see Appendix B) was submitted to the Oregon Department of Education on August 31, 2017. At the direction of the Assistant Superintendent of the Office of Research and Data Analysis, revisions were made to the Data Use Agreement, and it was approved on September 14, 2017. Class sets of study materials were disbursed to
Oregon Department of Education was contacted in an effort to gain access to the secondary data set that was representative of the defined variables which were securely preserved by ODE. Research Ethics
CHAPTER 4
RESULTS
The results in the following chapter encompass a thorough analysis of the statistical tests utilized to examine potential relationships between the defined independent and dependent variables and exhaustively report such findings. It is necessary to note that a change in analytics was deemed unavoidable in order to complete sound analysis of the variables and their
interactions with one another. A multiple-regression model was not a viable option due to the markedly smaller sample size than the originally projected three hundred participants. Thus, a determination was made to alter the data analysis procedures outlined in Chapter 3 and to select an alternate statistical test that could examine the defined variables and their interactions with one another. A one-way ANOVA was therefore utilized in place of a multiple-regression model.
This study’s ability to access granular, student-level data hinged upon the voluntary
participation of one school district in the state of Oregon, as a data warehouse of individual students’ Pre-K program participation does not exist in the state of Oregon, and the best means
of collecting this data was determined to be a questionnaire deployed and collected via classroom teachers. Due to unforeseen circumstances, the school district that had formerly committed to participation in the study via the Superintendent was no longer a viable option. This not only delayed the timeline of the study’s completion by months but impacted the expected
response-rate and therefore, the final sample size was severely diminished.
districts willing to voluntarily participate needed to provide notice of participation no later than August 31, 2017. Based upon this formal request seeking participation, two districts’
representatives regretfully declined participation, five districts did not respond to the request, and one district voluntarily chose to participate in the study.
Data Linking
On August 31, 2017, a Data Use Agreement was submitted to the Oregon Department of Education’s Procurement Services Division. This agreement specified the administrative and
security requirements agreed upon by the Data User in exchange for protected educational data under the FERPA Act securely housed at ODE. The Assistant Superintendent for the Office of Research and Data Analysis ensured that all student data was meticulously matched to the
Oregon SSID assigned to each student, and took additional measures to match students with their state-assigned SSID number in the instances where the internal district identification number was provided. The Assistant Superintendent created multiple data files in order to provide
comprehensive figures for each independent and dependent variable per study participant as requested by the Data User. These data files were securely transferred via Oregon Department of Education’s secure transfer site. Upon receipt of the data files, files were merged into a data set
that contained all variable information for each SSID number. This data was used for statistical analysis and interpreted using SPSS Statistical Software.
In the following chapter, descriptive statistics are presented for SBAC Mathematics and English Language Arts outcomes by a trichotomy of Pre-K program type variables (In-home care vs. Head Start vs. Other), a dichotomy of race/ethnicity variables (White vs. Other), and
the small sample size. In-home Care with a Relative and In-home Care with a Non-Relative were combined and recoded as In-Home Care. Head Start remained a category in and of itself due to a large body of pre-existing research on this particular Pre-K program, as well as the strict federal regulations which clearly define the program. Center-based care, Private Preschool, Preschool in an Elementary School Site, and Other were collapsed and recoded into the broad category of Other.
Descriptive Statistics
The participating school district is comprised of six elementary schools, two middle schools, and one high school. At his discretion, the Director of School Improvement selected two of the six elementary schools for participation in the study. Study materials, including the locally developed student questionnaire, IRB Parent/Guardian Consent, and disbursement and collection directions for the fourth-grade teachers were delivered to the secretaries of both elementary schools who then dispersed the study materials to the fourth-grade teachers. The student questionnaire (offered in both English and Spanish) was stapled to the IRB Parent/Guardian consent form. Class sets of thirty were made for each of the three fourth-grade teachers at both elementary school sites. Thus, students in a total of six fourth-grade classes were given the study materials, and participation by their parent/guardian was stressed as voluntary. Study materials were returned for eighty-two students of one-hundred-eighty students. However, when
controlling for missing data, the sample size was seventy-seven (n=77), or 43%, for the SBAC Mathematics and seventy-nine (n=79), or 44%, for the SBAC ELA.
the researcher and the educators who were responsible for study material disbursement and collection. Additionally, not a sole interaction between the researcher and the students who were potential study participants- nor between the researcher and the parents/guardians of potential study participants - took place at any time before, during, or after the study’s process and conclusion. The identity of students and their families thus remained protected to the highest possible degree of confidentiality.
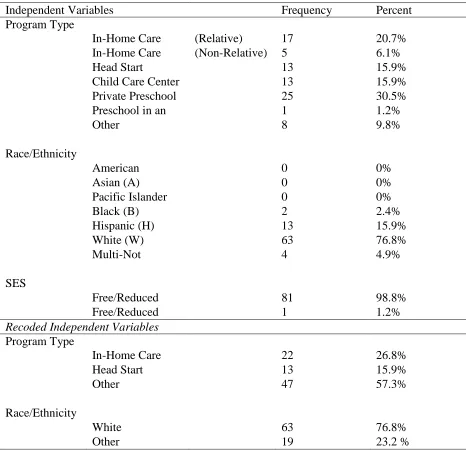
Independent Variable: Pre-K Program Type
Of the eighty-two responses to the Questionnaire, which asked parents/guardians to select the Pre-K program attended by their child the majority of the time (9 months or more) in the year prior to Kindergarten entry, the frequency of each program selected as the primary response was as follows: In-Home Care with a Relative: seventeen (n=17), In-Home Care with a
Non-Relative: five (n=5), Head Start: thirteen (n=13), Child Care Center: thirteen (n=13), Private Preschool: twenty-five (n=25), Preschool in an Elementary School Site: one (n=1), and Other: eight (n=8). Within the category of Other existed five questionnaire responses that included two programs selected by the parent/guardian rather than a single selection of the program accessed the majority of the time in the year prior to Kindergarten entry; these five study participants were assigned by the researcher to the Other category, as doubtfulness was deemed the category of best fit. For purposes of statistical analysis, the frequency of the recoded trichotomy of programs was twenty-two (n=22) who accessed In-Home Care, thirteen (n=13) who accessed Head Start, and forty-seven (n=47) who accessed Other.
Independent Variable: Race/Ethnicity
Asian (A) (n=0), Pacific Islander (P) (n=0), Black (B) (n=2), Hispanic (H) (n=13), White (W) (n=63), and Multi-Not Hispanic (M) (n=4). Due to unequal distribution of study participants in ODE’s race/ethnicity categories, limited sample size, as well as a high prevalence of students
categorized as White, a dichotomy was created by recoding all races/ethnicities other than White into one group titled Other and leaving White as its own group. Ultimately, the independent variable of race/ethnicity, as dichotomized in the categories of White (n=63) versus Other (n=19), was unequally distributed amongst the two groups.
Independent Variable: Socioeconomic Status
The socioeconomic status of each study participant was coded by Oregon Department of Education as either Yes, Receiving Free or Reduced Lunch, or No, Not Receiving Free or Reduced lunch. The sample included one sole study participant (n=1) representing the No category for the independent variable of SES on both the dependent variables of the third-grade SBAC Mathematics and SBAC ELA outcomes. In sharp contrast, seventy-four students (n=74) represented the Yes category for the variable of SES as measured by Free and Reduced lunch status on both dependent variables of third grade SBAC Mathematics and ELA outcomes.
Summary of Demographic Characteristics
The frequency and percent of each independent variable, Pre-K program type,